Key takeaways
- BLM reported 57.2 million acres of federal minerals beneath private surface land in fiscal year 2025. That equals 8.0% of 713.0 million acres of onshore federal minerals within BLM’s responsibilities in FY 2025 Table 1-3.
- BLM reported 57.2 million federal split-estate acres in each of fiscal years 2023, 2024 and 2025. All three tables report this column to one decimal place in millions of acres.

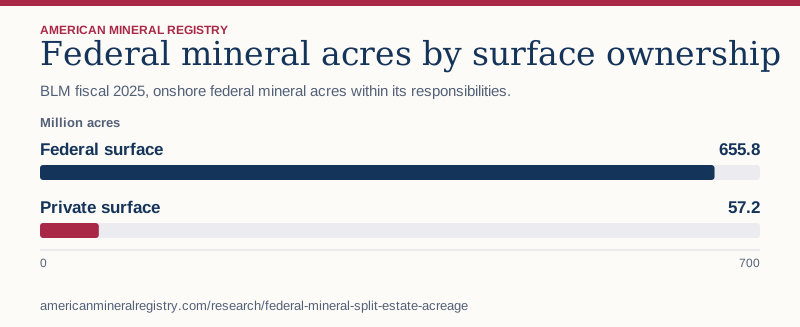
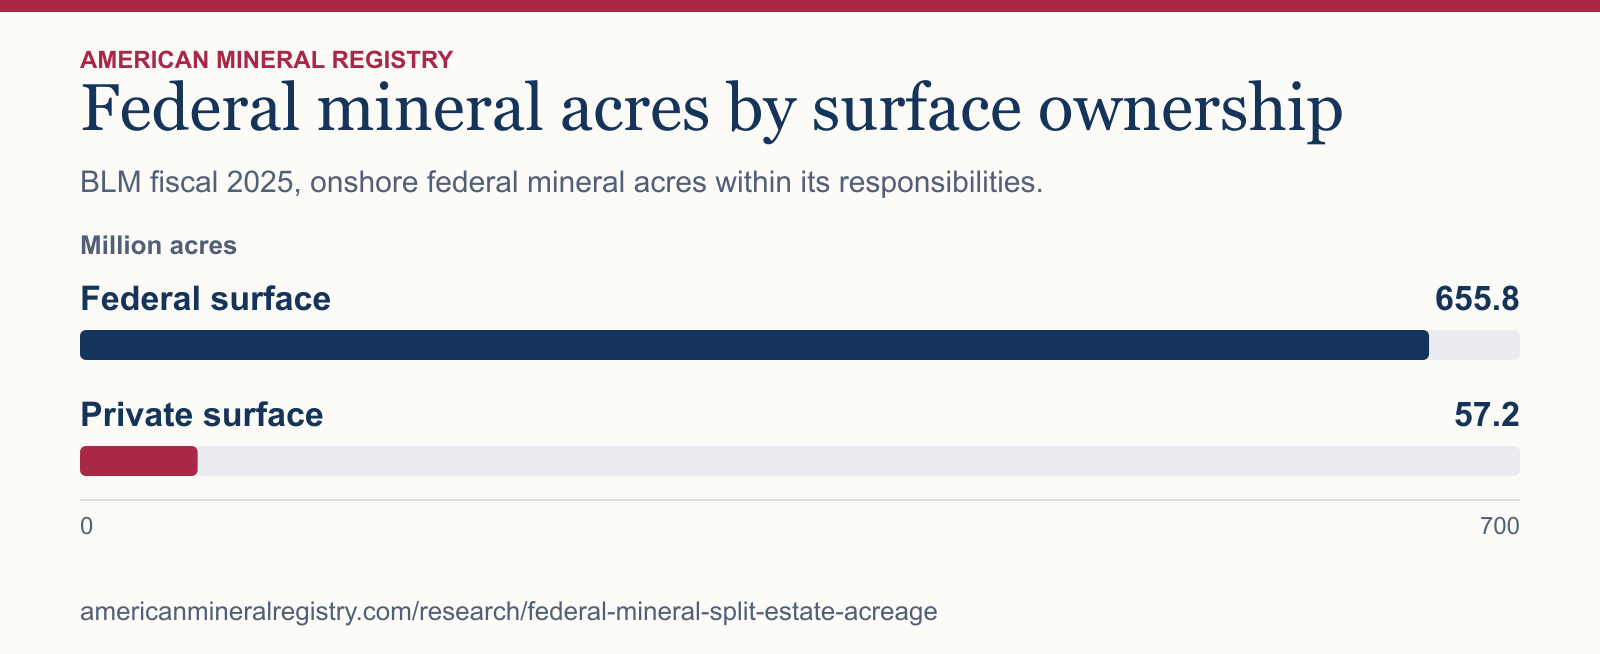
Figure 1 in text
BLM fiscal 2025, onshore federal mineral acres within its responsibilities. Million acres.
| Category | Million acres |
|---|---|
| Federal surface | 655.8 |
| Private surface | 57.2 |
Chart wording and scale
Federal mineral acres by surface ownership BLM fiscal 2025, onshore federal mineral acres within its responsibilities.
Million acres
Federal surface
655.8
Private surface
57.2 0 700
Source and data: Download chart source data
Permanent link to this figure’s text and data · Sources and context
What did BLM report across three fiscal years?
The agency reports its onshore federal minerals total, federal surface lands and federal split-estate minerals in separate columns. All values below are in millions of acres and appear as rounded in Table 1-3.
| Fiscal year | Onshore federal minerals | Federal surface lands | Federal split-estate minerals |
|---|---|---|---|
| 2023 | 712.9 | 655.7 | 57.2 |
| 2024 | 713.3 | 656.1 | 57.2 |
| 2025 | 713.0 | 655.8 | 57.2 |
How much federal split-estate acreage is reported in selected states?
Montana, Wyoming and New Mexico together accounted for 32.8 million acres, or 57.3% of the FY 2025 national column. The table adds North Dakota as a reference point for the selected geography.
| State | Federal split-estate mineral acres, millions | All onshore federal mineral acres, millions |
|---|---|---|
| Montana | 11.7 | 39.6 |
| Wyoming | 11.6 | 41.1 |
| New Mexico | 9.5 | 35.9 |
| North Dakota | 4.5 | 6.9 |
What does the federal split-estate total include?
BLM’s table defines this category as federal mineral rights reserved beneath private surface land. The reservation can cover one, multiple or all minerals. The table treats Bureau of Indian Affairs mineral estate as separate. Private and state mineral interests fall outside this federal column. The national and state figures cannot establish the rights to a particular tract.
How were the acreage shares calculated?
AMR divided 57.2 by 713.0 and multiplied by 100 for the national share. The selected-state comparison adds the three published state figures, divides the sum by 57.2, and multiplies by 100. Both shares are rounded to one decimal place. A repeated rounded acreage does not establish whether the underlying acreage changed. BLM also notes that its source data can change with geographic and database updates.
Sources and data
- BLM Public Land Statistics FY 2025, Table 1-3, printed pages 7–8
- BLM Public Land Statistics FY 2024, Table 1-3, printed pages 7–8
- BLM Public Land Statistics FY 2023, Table 1-3, printed pages 7–8
- BLM Public Land Statistics edition index
Download the data (CSV) · Read the data dictionary. The AMR analysis and figures are licensed CC BY 4.0. Refer to the original issuers for their materials.