Key takeaways
- ONRR recorded $988,813,066.00 under Gas and $936,103,520.20 under Natural gas liquids in FY 2026. These are separate ONRR commodity categories. The Gas figure does not include the natural gas liquids line.
- Gas exceeded Oil in FY 2004 through FY 2007. Oil exceeded Gas from FY 2008 through FY 2026. This compares the two named commodities by nominal receipt dollars across the preserved ONRR annual file.

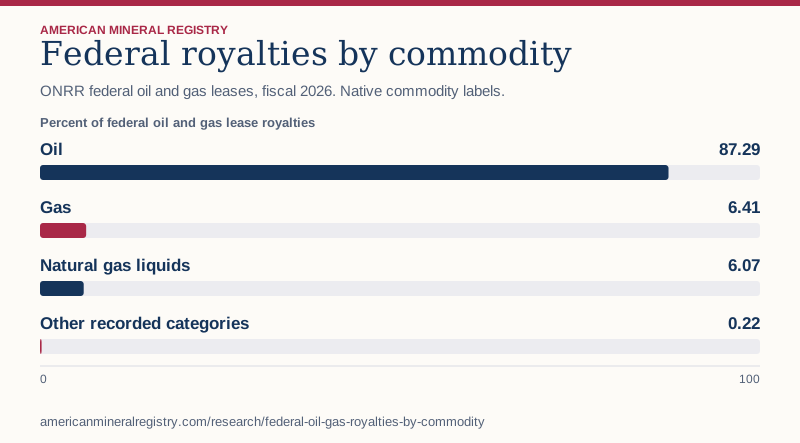
Figure 1 in text
ONRR federal oil and gas leases, fiscal 2026. Native commodity labels. Percent of federal oil and gas lease royalties.
| Category | Percent of federal oil and gas lease royalties |
|---|---|
| Oil | 87.29 |
| Gas | 6.41 |
| Natural gas liquids | 6.07 |
| Other recorded categories | 0.22 |
Chart wording and scale
Federal royalties by commodity ONRR federal oil and gas leases, fiscal 2026. Native commodity labels.
Percent of federal oil and gas lease royalties
Oil
87.29
Gas
6.41
Natural gas liquids
6.07
Other recorded categories
0.22 0 100
Source and data: Download chart source data
Permanent link to this figure’s text and data · Sources and context
How much did each commodity contribute?
Oil was the largest single ONRR commodity in FY 2026 federal oil and gas lease royalties. The denominator below includes every reported commodity in the lease class.
| ONRR commodity | FY 2026 royalty dollars | Share of all included royalties |
|---|---|---|
| Oil | $13,463,336,549.82 | 87.29% |
| Gas | $988,813,066.00 | 6.41% |
| Natural gas liquids | $936,103,520.20 | 6.07% |
| Other recorded commodities | $34,566,257.63 | 0.22% |
When did oil receipts move ahead of gas?
Oil first exceeded Gas in FY 2008 in this file. Gas led in the first four fiscal years. The table uses the source’s fiscal-year labels.
| Fiscal year | Oil | Gas | Natural gas liquids |
|---|---|---|---|
| 2004 | $1.48 billion | $4.57 billion | $234.40 million |
| 2007 | $4.31 billion | $4.39 billion | $360.60 million |
| 2008 | $6.03 billion | $5.53 billion | $583.58 million |
| 2025 | $10.90 billion | $0.98 billion | $940.68 million |
| 2026 | $13.46 billion | $0.99 billion | $936.10 million |
Do gas royalties include natural gas liquids in these statistics?
Gas and natural gas liquids remain separate because ONRR uses different commodity labels. The two categories together sum to $1,924,916,586.20 in FY 2026. A writer using that combined figure should state both categories.
What is included in the royalty denominator?
AMR sums signed Royalties rows for federal Oil & Gas leases onshore and offshore, including commodities beyond the three shown separately. Native American land-class rows, lease bonuses, rents and other revenue types are outside the denominator. The statistic cannot establish a royalty rate or production share.
How can the commodity shares be reproduced?
Download the underlying ONRR file. Filter Land Class to Federal, Land Category to Onshore and Offshore, Mineral Lease Type to Oil & Gas, and Revenue Type to Royalties. Sum Revenue by fiscal year and commodity, preserving negative entries. Divide each commodity by that year’s all-commodity royalty total. The downloadable AMR table retains exact cents and rounds the percentages to two decimals.
Sources and data
Download the data (CSV) · Read the data dictionary. The AMR analysis and figures are licensed CC BY 4.0. Refer to the original issuers for their materials.