This reference follows 41 national year end estimates, eleven complete annual accounting bridges and the full reported shale play comparison. AMR reconciles the changes, preserves rounding differences and calculates comparable shares and ratios. The result separates proved reserves from all oil underground, physical emergency inventories and a forecast of when production will end. Complete source tables, specific finding links and reproducible downloads accompany the analysis.
Key Takeaways
- U.S. proved crude oil and lease condensate reserves were 45.951 billion barrels at year end 2024. (EIA, Apr 2026).
- National oil and lease condensate proved reserves declined 471 million barrels during 2024. (EIA, Apr 2026).
- Extensions and discoveries added 5.145 billion barrels to the reported 2024 reserve bridge. (EIA, Apr 2026).
- Revisions and other changes reduced the 2024 reserve bridge by 3.845 billion barrels. (EIA, Apr 2026).
- Net acquisitions and divestitures added 3.036 billion barrels in the 2024 national table. (EIA, Apr 2026).
- The reserves report estimates 4.806 billion barrels of oil and lease condensate production in 2024. (EIA, Apr 2026).
- The published 2024 components leave a minus 1 million barrel rounding residual. (AMR calculations from EIA, Apr 2026).
- Six of eleven annual reserve changes were positive from 2014 through 2024. (AMR calculations from EIA, Apr 2026).
- The 1984 through 2024 panel maximum is 48.321 billion barrels at year end 2022. (AMR comparison of EIA, Apr 2026).
- The 1984 through 2024 panel minimum is 20.554 billion barrels at year end 2008. (AMR comparison of EIA, Apr 2026).
- Shale plays held 27.533 billion proved oil and lease condensate barrels at year end 2024. (EIA, Apr 2026).
- Shale's share of national proved oil and condensate reserves rose from 56.50% to 59.92%, 2023 to 2024. (AMR calculations from EIA, Apr 2026).
- Bone Spring and Wolfcamp accounted for 63.18% of reported shale proved oil and condensate reserves in 2024. (AMR calculations from EIA, Apr 2026).
- The 2024 reserve to annual production multiple is 9.561, a static ratio rather than a runout forecast. (AMR calculations from EIA, Apr 2026).
How much proved oil does the United States report?
The source reports 45.951 billion barrels of crude oil and lease condensate at the end of 2024. This is a recoverability estimate under defined economic and operating conditions, not an inventory of every barrel underground or an amount already held in storage.

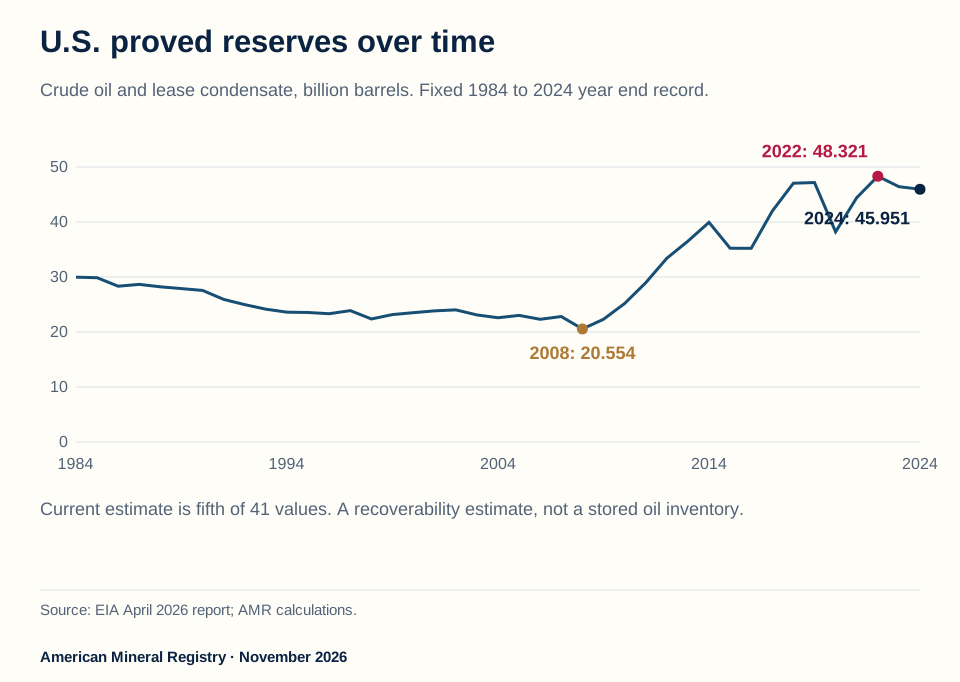
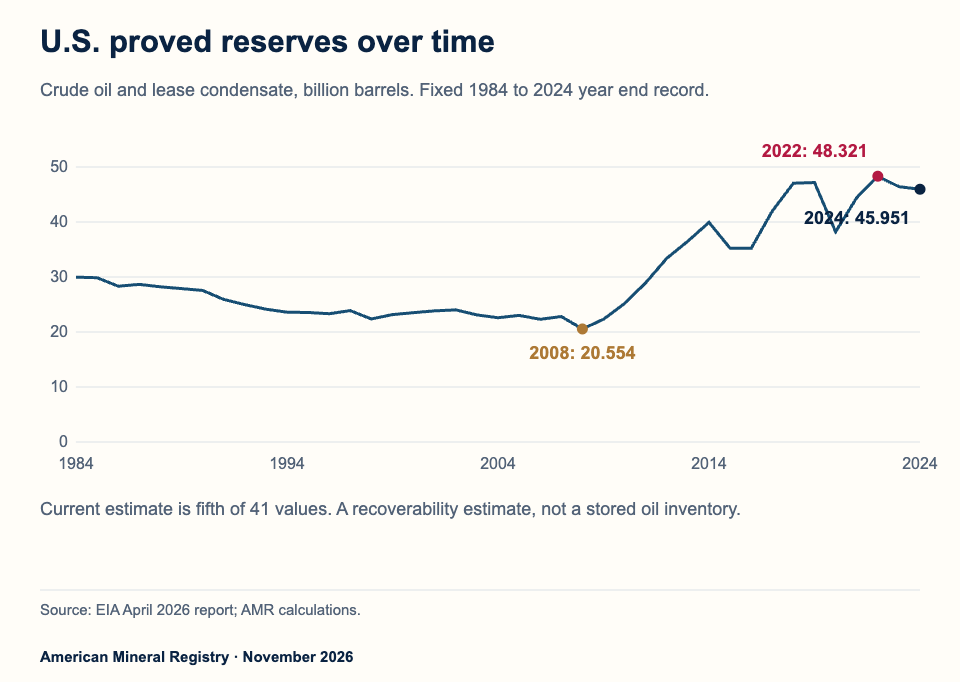
Figure 1 in text
U.S. proved oil reserve statistics: 41 national year end estimates, 1984 to 2024; 2024 is 45.951 billion barrels.
U.S. proved reserves over time Crude oil and lease condensate, billion barrels. Fixed 1984 to 2024 year end record. 0 10 20 30 40 50 1984 1994 2004 2014 2024
2008: 20.554
2022: 48.321
2024: 45.951 Current estimate is fifth of 41 values. A recoverability estimate, not a stored oil inventory. Source: EIA April 2026 report; AMR calculations.
American Mineral Registry · November 2026
Source and data: EIA, national proved reserves figure data
Permanent link to this figure’s text and data · Sources and context
What exactly is included in the national oil number?
It includes crude oil and lease condensate in the source's combined petroleum category. Every national number on this page retains that category, even when the shorter word oil is used in a question heading.
The national estimate is 46,422 million barrels at the end of 2023 and 45,951 million barrels at the end of 2024. Dividing by 1,000 gives 46.422 and 45.951 billion barrels. The difference is negative 471 million barrels. These are year end reserve estimates; they are not annual production or volumes delivered during those years. (EIA, national reserves table, Apr 2026).
EIA defines proved reserves as quantities that geological and engineering analysis demonstrates with reasonable certainty can be recovered under existing economic and operating conditions. That definition connects the estimate to current knowledge and feasibility. It does not classify every petroleum resource as presently recoverable, and it does not promise that the entire reported quantity can be produced immediately. (EIA, report definition, Apr 2026).
The word proved should therefore remain attached when the figure is quoted. Calling the estimate all U.S. oil resources would broaden the question beyond the table. Calling it stored oil would change its physical location and purpose. A useful citation identifies the combined product category, date, unit and definition instead of relying on the word reserves alone.
Where does the current estimate sit in the historical record?
The current estimate is relatively high within this particular 41 observation record, although it is below the sample maximum. A historical comparison needs the fixed window to distinguish a result inside the panel from a claim about every year ever recorded.
The largest year end value in the selected 1984 through 2024 source panel is 48.321 billion barrels in 2022. The next values are 47.172 billion in 2019, 47.053 billion in 2018 and 46.422 billion in 2023. The 2024 estimate of 45.951 billion is fifth when those 41 observations are ordered from largest to smallest. (AMR comparison of EIA historical values, Apr 2026).
The panel minimum is 20.554 billion barrels in 2008. The 2024 estimate is about 2.24 times that value, while it is approximately 4.9% below the 2022 panel maximum. Neither comparison means that individual fields followed the same path or that the difference consists entirely of newly discovered oil. The annual accounting later in this article identifies the additional categories needed to understand a reserve change. (AMR calculations from EIA history, Apr 2026).
All 41 levels are preserved in the working data. The fixed window follows the published figure's stated 1984 through 2024 coverage. Earlier observations that may be stored elsewhere in the workbook are outside this declared comparison. The analysis does not extend the sample only when an additional year would produce a more dramatic ranking.
How recent is the source, and why is the reserve year different?
The source release date identifies when EIA published the report. The reserve date identifies the time the estimate describes. A 2026 publication does not turn a 2024 year end estimate into a 2026 observation.
The opened report states that its 2024 data were released on April 7, 2026, with its next release scheduled for April 2027. This fixed edition was checked in November 2026. The article therefore describes the completed source periods available in the pinned report rather than filling a later year with a placeholder or forecast. (EIA, release information, Apr 2026).
The historical file and all accounting tables come from that same report edition. Combining an old reserve level from one release with a revised level from another can change the calculated difference. A reader studying revisions between releases should preserve both vintages and name that separate comparison explicitly.
For a physical inventory question, use the distinct Strategic Petroleum Reserve and commercial crude stocks reference. That page measures stored crude oil. This page measures proved recoverable quantities associated with the reserve reporting system. The two figures share a barrel unit but not the same statistical meaning.
Why did proved reserves fall during 2024?
The reported decline reflects the complete accounting bridge. Extensions and discoveries and net acquisitions were positive; revisions and other changes and production reduced the balance. The printed components also leave a small rounding difference that must remain visible rather than being forced into another category.

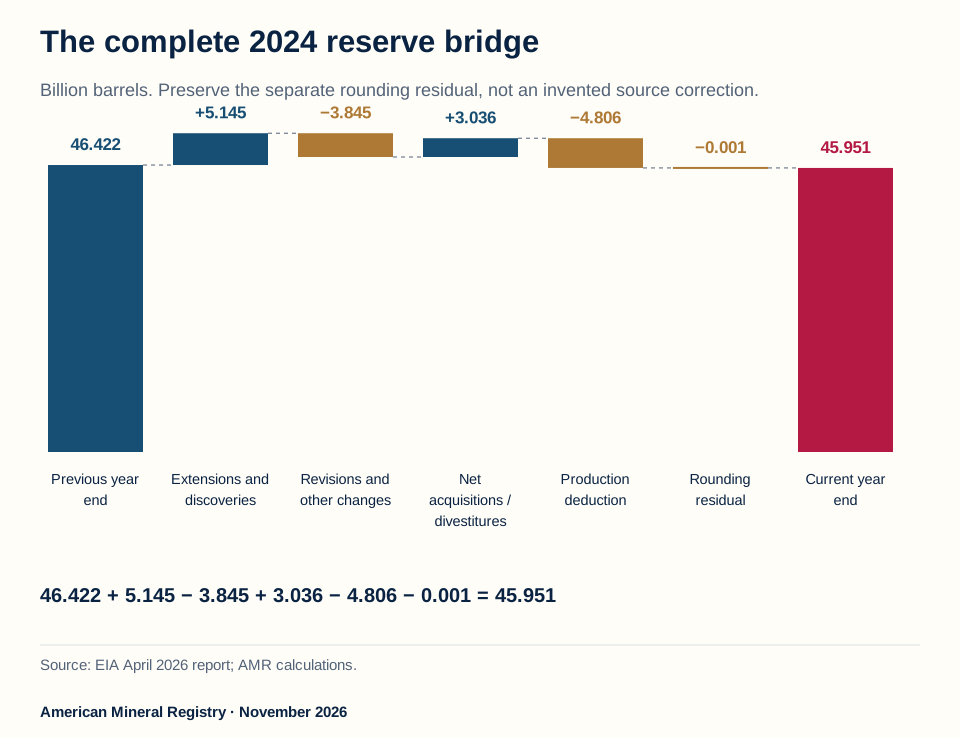
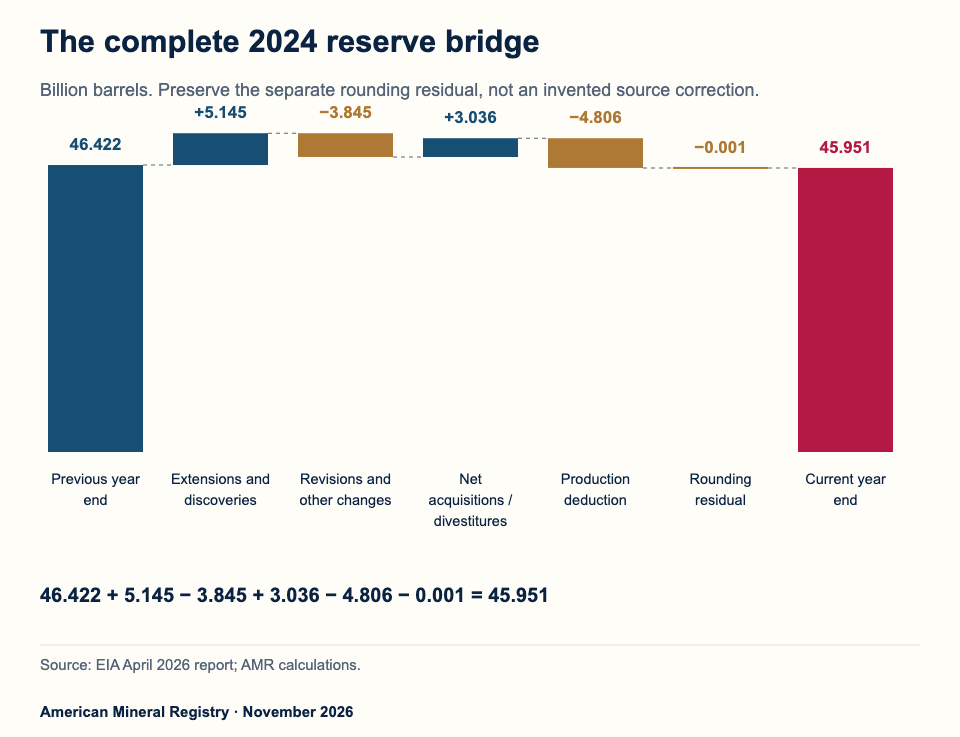
Figure 2 in text
2024 reserve bridge preserves all reported components and minus 1 million barrel residual, ending at 45.951 billion barrels.
The complete 2024 reserve bridge Billion barrels. Preserve the separate rounding residual, not an invented source correction.
46.422 Previous year end
+5.145 Extensions and discoveries
−3.845 Revisions and other changes
+3.036 Net acquisitions / divestitures
−4.806 Production deduction
−0.001 Rounding residual
45.951 Current year end
46.422 + 5.145 − 3.845 + 3.036 − 4.806 − 0.001 = 45.951 Source: EIA April 2026 report; AMR calculations.
American Mineral Registry · November 2026
Additional phone figure text: The printed components give 45.952. The · reported end value is 45.951.
Source and data: EIA, national accounting table
Permanent link to this figure’s text and data · Sources and context
Which components enter the calculation?
The source separates additions and changes from the production deduction. Keeping those categories intact shows why a positive discovery figure can coexist with a smaller total reserve estimate.
Starting with 46,422 million barrels, extensions and discoveries add 5,145 million. Revisions and other changes contribute negative 3,845 million. Net acquisitions and divestitures add 3,036 million, and the reserves report's estimated production deducts 4,806 million. Those published components give a subtotal of 45,952 million barrels before the explicit residual is applied. (EIA, national accounting components, Apr 2026).
The reported end value is 45,951 million barrels. AMR therefore records a negative 1 million barrel residual between the component calculation and the printed end value. This is a transparent reconciliation of rounded published inputs, not a new reserve revision and not an unidentified production estimate. The complete downloadable bridge retains the source figures unchanged. (AMR reconciliation of EIA, Apr 2026).
The waterfall figure expresses the quantities in billion barrels while the data files retain million barrels. A negative component is a subtraction from the reserve balance. Its sign does not by itself identify a physical oil shipment, a loss of ownership or a change in the mineral rights of any particular owner.
Does revisions and other changes mean that the oil disappeared?
No such physical conclusion follows from that row. It is an accounting category, and the source explicitly identifies it as an annual balancing item calculated by EIA. A residual accounting category cannot isolate one geological, commercial or price mechanism.
In the national table, revisions and other changes are negative 3,845 million barrels for 2024. EIA separately explains that reserve estimates can change with prices and costs, discoveries, appraisals, production and improved techniques. (EIA, reserve definition, Apr 2026). Those factors explain why a reserve estimate is conditional, but this table does not estimate how much of that negative row is caused by each factor. (EIA, table footnote and definitions, Apr 2026).
An article should therefore describe the reported row by its actual name. A statement that prices alone erased 3.845 billion barrels, that geology alone removed them or that they were all consumed would assign a cause the selected evidence does not quantify. The complete bridge answers what the reported accounting components were, not a counterfactual explanation of why each one changed.
The same care applies to net acquisitions and divestitures. The source defines that row as acquisitions minus divestitures. It should not be relabeled new discoveries or added a second time to extensions. Its inclusion in the national reported balance is preserved even when a reader expects transactions within the country to offset mechanically. Explaining any reporting or coverage difference requires the source's survey framework, rather than changing the published value.
How large was the decline in percentage terms?
A percentage decline uses the preceding reserve level as its denominator. Percentage points apply to a difference between shares; they are not the unit of a change in a barrel level.
Dividing the reported 471 million barrel decline by the 2023 level of 46,422 million gives approximately 1.0146%. EIA's report summarizes the decline as 1%. AMR's more detailed ratio is calculated from the displayed million barrel values, and does not claim access to greater measurement precision in the underlying operator estimates. (AMR calculation from EIA, Apr 2026).
The denominator also makes the residual's scale clear. One million barrels is a small fraction of the national balance, but omitting it would make the published bridge fail an exact sum of its displayed entries. A reconciliation can preserve both facts: the discrepancy is small, and it is still material to reproducing the arithmetic faithfully.
For a general reader, a concise defensible summary is that national proved oil and condensate reserves fell by 471 million barrels, about 1%, during 2024 despite positive extensions and discoveries. The numerical components and the source's balancing convention should accompany any more detailed explanation of the decline.
Do additions normally offset annual production?
The eleven complete accounting years show several combinations. Reported reserves can grow while oil is being produced, and extensions and discoveries can exceed production even when the final reserve estimate falls. The complete balance, rather than one additions category, determines the result.

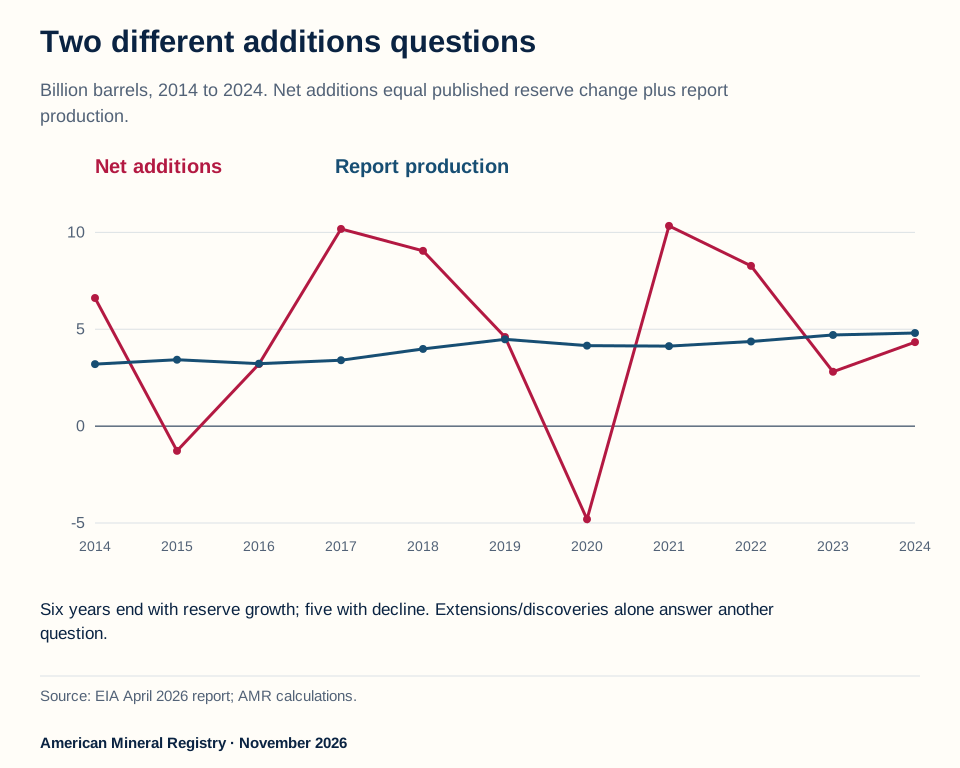
Figure 3 in text
Reported net reserve additions versus annual production across 2014 to 2024; six positive and five negative final reserve changes.
Two different additions questions Billion barrels, 2014 to 2024. Net additions equal published reserve change plus report production. -5 0 5 10
Net additions
Report production 2014 2015 2016 2017 2018 2019 2020 2021 2022 2023 2024 Six years end with reserve growth; five with decline. Extensions/discoveries alone answer another question. Source: EIA April 2026 report; AMR calculations.
American Mineral Registry · November 2026
Additional phone figure text: Net 6.613 · Production 3.200 · Net -1.276 · Production 3.427 · Net 3.206 · Production 3.223 · Net 10.178 · Production 3.401 · Net 9.047 · Production 3.984 · Net 4.599 · Production 4.480 · Net -4.806 · Production 4.154 · Net 10.335 · Production 4.129 · Net 8.271 · Production 4.368 · Net 2.806 · Production 4.705 · Net 4.335 · Production 4.806 · Net additions can be negative. They are not · a count of new discoveries.
Source and data: EIA, annual reserve accounting
Permanent link to this figure’s text and data · Sources and context
What is the difference between discoveries and net additions?
Extensions and discoveries are one named source component. AMR's reported net additions measure reconstructs the full pre-production change as the published reserve change plus the source's production estimate, retaining all other reported effects and the rounding residual.
For 2024, the 471 million barrel reserve decline plus 4,806 million barrels of production gives 4,335 million barrels of reported net additions. Extensions and discoveries alone are 5,145 million barrels. The two differ because revisions, net acquisitions and the displayed rounding residual also enter the balance. Neither measure should be relabeled the other. (AMR calculations from EIA, Apr 2026).
In that same year, extensions and discoveries equal approximately 107.1% of production, while reported net additions equal about 90.2%. Quoting only the first ratio would suggest a different accounting result from the complete balance. The qualified comparison is useful precisely because both ratios are calculated from the same year, product category and report production estimate. (AMR ratios from EIA, Apr 2026).
Net additions can be negative. In this definition, that means the combined pre-production changes reduced the reported reserve estimate. It does not mean there were negative physical discoveries or negative drilling activity. The measure summarizes the complete estimate bridge rather than a count or volume of newly found fields.
Which years had positive or negative reserve changes?
The fixed eleven-year record contains six positive changes and five negative changes. Its alternating signs prevent one year's increase or decline from becoming a claim that proved reserves always move in the same direction.
The positive years are 2014, 2017, 2018, 2019, 2021 and 2022. The negative years are 2015, 2016, 2020, 2023 and 2024. Extensions and discoveries exceed the source production estimate in eight of those eleven years, which is a different count from the six positive final reserve changes. (AMR comparison of EIA annual rows, Apr 2026).
| Year | Published reserve change, million barrels | Net additions, million barrels | Source production, million barrels | End reserves, million barrels |
|---|---|---|---|---|
| 2014 | 3,413 | 6,613 | 3,200 | 39,933 |
| 2015 | -4,703 | -1,276 | 3,427 | 35,230 |
| 2016 | -17 | 3,206 | 3,223 | 35,213 |
| 2017 | 6,777 | 10,178 | 3,401 | 41,990 |
| 2018 | 5,063 | 9,047 | 3,984 | 47,053 |
| 2019 | 119 | 4,599 | 4,480 | 47,172 |
| 2020 | -8,960 | -4,806 | 4,154 | 38,212 |
| 2021 | 6,206 | 10,335 | 4,129 | 44,418 |
| 2022 | 3,903 | 8,271 | 4,368 | 48,321 |
| 2023 | -1,899 | 2,806 | 4,705 | 46,422 |
| 2024 | -471 | 4,335 | 4,806 | 45,951 |
Source: AMR calculations from EIA annual reserve accounting, Apr 2026. Net additions equal published change plus report production. Download the complete ratios and additions table (CSV).
The largest negative change in this eleven-year bridge panel is 8.960 billion barrels in 2020. The largest positive change is 6.777 billion in 2017. These are estimate changes, not oil output volumes or direct measurements of a particular event's causal effect. (AMR comparison of EIA, Apr 2026).
Why must the report's own production definition remain attached?
The bridge production figures are estimates based on the reserves survey. EIA explicitly warns that they may differ from official crude oil and lease condensate production in its Petroleum Supply Annual and Natural Gas Annual.
The report production estimate is 4,705 million barrels for 2023 and 4,806 million for 2024. Those values belong in this reserve bridge because they are the source's matching deductions. Substituting a separate production series, even one from EIA, could make the accounting fail without demonstrating that the original reserve table was wrong. (EIA, annual table production note, Apr 2026).
A comparison of production sources can be useful, but it requires its own reconciliation of coverage, methods, units and revisions. This page does not silently combine those series. The downloadable ratios use the same source production estimate in their denominator throughout the eleven-year window.
For the distinct question of trade, see U.S. crude oil versus total petroleum net imports. A country can produce, trade, hold physical stocks and revise proved reserve estimates during the same period. Each table describes a different part of that system and needs its own denominator.
Which shale plays account for the reported reserves?
The full source shale comparison contains seven named play groups and an Other category. Bone Spring and Wolfcamp hold most of the shale reserve quantity in this selected table. Those shale shares differ from shares of all national crude oil and lease condensate reserves.

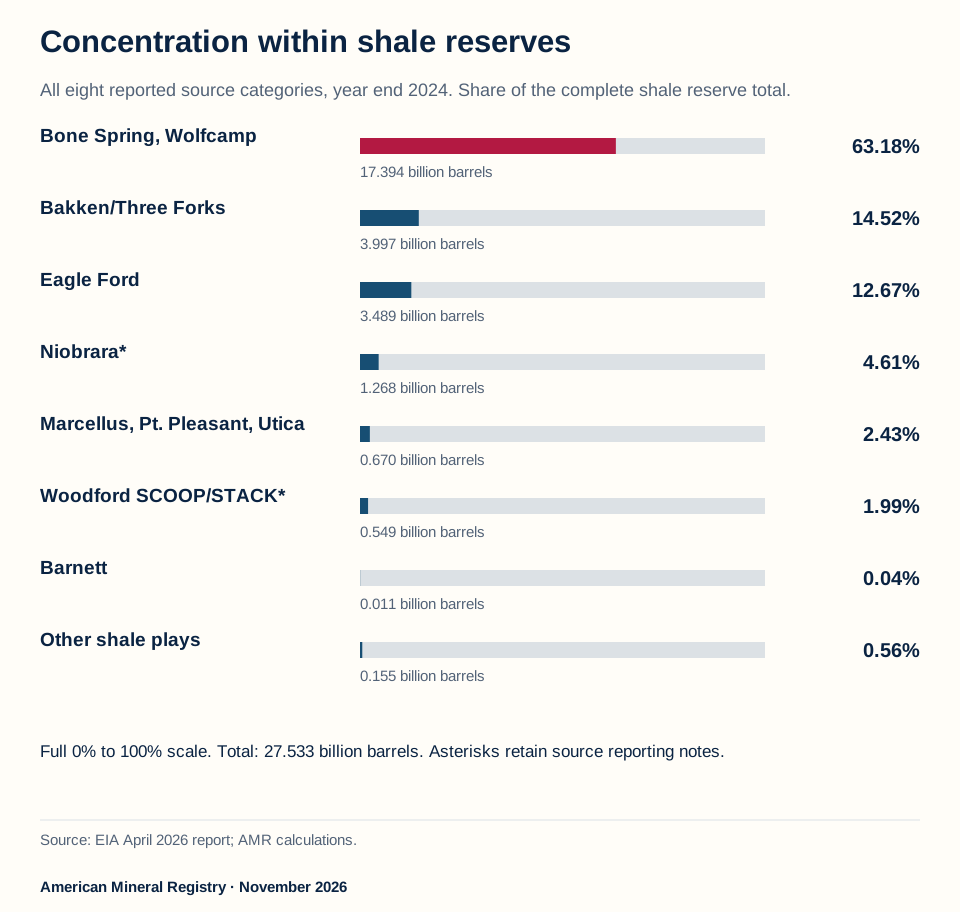
Figure 4 in text
Eight reported shale categories, with Bone Spring/Wolfcamp at 17.394 billion barrels and 63.18 percent of the 2024 shale total.
Concentration within shale reserves All eight reported source categories, year end 2024. Share of the complete shale reserve total.
Bone Spring, Wolfcamp
63.18% 17.394 billion barrels
Bakken/Three Forks
14.52% 3.997 billion barrels
Eagle Ford
12.67% 3.489 billion barrels
Niobrara*
4.61% 1.268 billion barrels
Marcellus, Pt. Pleasant, Utica
2.43% 0.670 billion barrels
Woodford SCOOP/STACK*
1.99% 0.549 billion barrels
Barnett
0.04% 0.011 billion barrels
Other shale plays
0.56% 0.155 billion barrels Full 0% to 100% scale. Total: 27.533 billion barrels. Asterisks retain source reporting notes. Source: EIA April 2026 report; AMR calculations.
American Mineral Registry · November 2026
Additional phone figure text: 17.394 bn barrels · 63.18% · 3.997 bn barrels · 14.52% · 3.489 bn barrels · 12.67% · 1.268 bn barrels · 4.61% · 0.670 bn barrels · 2.43% · 0.549 bn barrels · 1.99% · 0.011 bn barrels · 0.04% · 0.155 bn barrels · 0.56%
Source and data: EIA, shale play reserves and production
Permanent link to this figure’s text and data · Sources and context
How concentrated are the reserves within the shale table?
The top three reported groups account for most of the table's shale reserve estimate. The calculation adds the named groups using the full published shale denominator, rather than dropping small categories and renormalizing the remainder.
Bone Spring and Wolfcamp have 17,394 million barrels of proved oil and lease condensate reserves in 2024. Bakken and Three Forks have 3,997 million, and Eagle Ford has 3,489 million. Their combined 24,880 million barrels represent approximately 90.36% of the 27,533 million barrel shale total. (AMR calculations from EIA shale rows, Apr 2026).
Bone Spring and Wolfcamp alone represent approximately 63.18% of shale reserves, but about 37.85% of all national oil and condensate proved reserves. The matching national value comes from EIA's national table. (EIA, national denominator, Apr 2026). Both shares use the same 17,394 million barrel numerator. The shale denominator is 27,533 million, while the national denominator is 45,951 million. The larger percentage is not a larger physical quantity; it answers a narrower denominator question. (AMR calculations from EIA, Apr 2026).
The named grouping is the source's reporting unit. It should not be split into a separate Bone Spring estimate and a separate Wolfcamp estimate without additional source values. Likewise, the combined Bakken and Three Forks row cannot establish each formation's individual share.
Did every reported shale group increase?
The source records increases, declines and an unchanged value. Retaining all eight categories prevents one expanding group from standing in for all shale activity.
| Source play group | 2023 reserves, million barrels | 2024 reserves, million barrels | Change, million barrels | 2024 share of shale reserves % |
|---|---|---|---|---|
| Bone Spring, Wolfcamp | 15,399 | 17,394 | 1,995 | 63.18 |
| Bakken/Three Forks | 4,234 | 3,997 | -237 | 14.52 |
| Eagle Ford | 4,123 | 3,489 | -634 | 12.67 |
| Niobrara* | 1,002 | 1,268 | 266 | 4.61 |
| Marcellus, Pt. Pleasant, Utica | 645 | 670 | 25 | 2.43 |
| Woodford SCOOP/STACK* | 579 | 549 | -30 | 1.99 |
| Barnett | 11 | 11 | 0 | 0.04 |
| Other shale plays | 236 | 155 | -81 | 0.56 |
Source: EIA shale table, Apr 2026. Asterisks retain source footnotes. Shares are rounded after calculation. Download all eight source categories (CSV).
Three categories increased, four declined and Barnett was unchanged in the displayed reserve values. Bone Spring and Wolfcamp's 1,995 million barrel increase exceeds the entire shale total increase of 1,304 million because decreases in other categories offset part of it. That is an accounting contribution, not a causal estimate of what one play did to another. (AMR comparison of EIA shale rows, Apr 2026).
What do the source groupings and rounding notes mean?
The reporting labels describe estimated reserves assigned to source-defined shale groups. They are not detailed field maps, lease boundaries or a census of privately owned mineral interests.
EIA's note defines the Bone Spring and Wolfcamp row using reported shale volumes in Texas RRC7C, RRC8 and RRC8A and eastern New Mexico. It also supplies special reporting qualifications for Woodford SCOOP/STACK and Niobrara. The public dataset retains the original labels and the source cell spans, while this page avoids drawing a boundary map unsupported by those aggregate rows. (EIA, shale table notes, Apr 2026).
The reserve categories sum to the reported shale reserve total in each displayed year. The production categories have a different result: their sum is 2,834 million barrels in 2023 against a reported total of 2,835 million, and 2,993 million in 2024 against 2,994 million. The source notes that totals may not equal components because of independent rounding. AMR retains those 1 million barrel production residuals separately. (AMR source rounding controls, Apr 2026).
Other is a reported residual category, not an unidentified missing row to replace with zero. Subtotal and U.S. total are aggregations; adding either to the eight leaf categories would double count. The analysis uses the eight leaf groups for the complete distribution and keeps the printed totals as separate control values.
Can shale reserves rise while national reserves fall?
Yes. A component can grow while the full national total contracts if the complementary component declines by more. The source shows this in 2024, with increasing shale proved reserves and a larger decline in the calculated nonshale remainder.

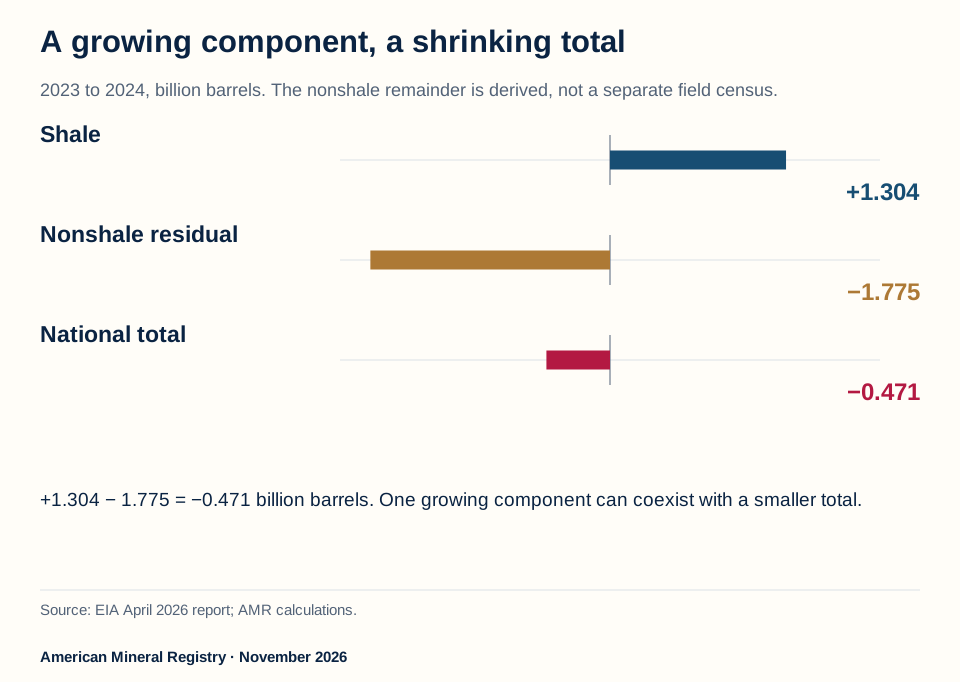
Figure 5 in text
From 2023 to 2024, shale rises 1.304 billion barrels, derived nonshale falls 1.775 billion and national reserves fall 0.471 billion.
A growing component, a shrinking total 2023 to 2024, billion barrels. The nonshale remainder is derived, not a separate field census.
Shale
+1.304
Nonshale residual
−1.775
National total
−0.471 +1.304 − 1.775 = −0.471 billion barrels. One growing component can coexist with a smaller total. Source: EIA April 2026 report; AMR calculations.
American Mineral Registry · November 2026
Source and data: EIA, shale reserves with matching national totals · EIA matching national Table 1
Permanent link to this figure’s text and data · Sources and context
What are the matching national and shale amounts?
The comparison uses year end values from the same report edition and the same combined crude oil and lease condensate category. AMR calculates the nonshale remainder by subtracting reported shale reserves from the matching national total.
In 2023, national reserves are 46,422 million barrels and shale reserves are 26,229 million, leaving a calculated nonshale remainder of 20,193 million. In 2024, the corresponding values are 45,951 million and 27,533 million, leaving 18,418 million. This remainder is a derived complement, rather than a separate source table purporting to describe each nonshale field. (AMR calculations from EIA shale values, Apr 2026). (EIA, matching national values, Apr 2026).
The shale difference is positive 1,304 million barrels. The nonshale remainder difference is negative 1,775 million. Adding those changes gives the national negative 471 million barrel difference exactly at the displayed source precision. This identity explains how the apparently conflicting headlines can both be true. (AMR category reconciliation, Apr 2026).
It does not explain why either estimate changed. A causal account would require evidence within those reporting categories about appraisal, economics, technical changes, production and other factors. The decomposition is complete as arithmetic while remaining explicit about that interpretive boundary.
How does the share change differ from the barrel change?
A share depends on both the component and the total. Here the shale numerator rises while the national denominator falls, so both movements raise shale's share of reported proved reserves.
Shale represents about 56.50% of the national oil and condensate estimate in 2023 and 59.92% in 2024. The difference is approximately 3.42 percentage points, calculated from the unrounded ratios of the published reserve values. Shale reserve volume itself rises by about 4.97%, which is a different statistic from the share change. (AMR calculations from EIA, Apr 2026).
A claim that shale gained 3.42% of barrels would confuse the percentage point difference with the volume growth rate. A claim that national reserves grew 4.97% would assign the component's rate to the whole. Keeping numerator, denominator and difference type together is essential when a statistic is lifted into a short article or chart caption.
The complete national category download supplies the two years' totals, shale values, calculated remainders and exact shares. A writer can reproduce either comparison from those rows without inferring an unreported geographic or ownership allocation.
Do shale reserve shares equal production shares?
They are different ratios. Reserves are year end estimated recoverable quantities, while production is a volume over the year. Their numerator and denominator must remain matched within each measure.
The shale table reports 2,994 million barrels of 2024 oil and condensate production from its shale categories. The national reserves report production estimate is 4,806 million barrels. A production share derived from those matching source values answers a different question from 27,533 divided by 45,951 million barrels of reserves. This reference does not relabel the reserve share as a production share. (EIA, shale and national production tables, Apr 2026).
The distinction also explains why a play with a large reserve estimate need not hold the same fraction of annual output. The timing and pace of extraction matter, while reserves remain conditional estimates. The selected data can compare the reported quantities and ratios, but they do not forecast the next year's production path or prove which specific investment will occur.
Do proved reserves tell us when the United States will run out of oil?
Dividing year end reserves by one year's production gives a static ratio, not a forecast of exhaustion. It holds one production flow and one conditional reserve estimate in a simple calculation, while the actual reserve estimate can change every year.

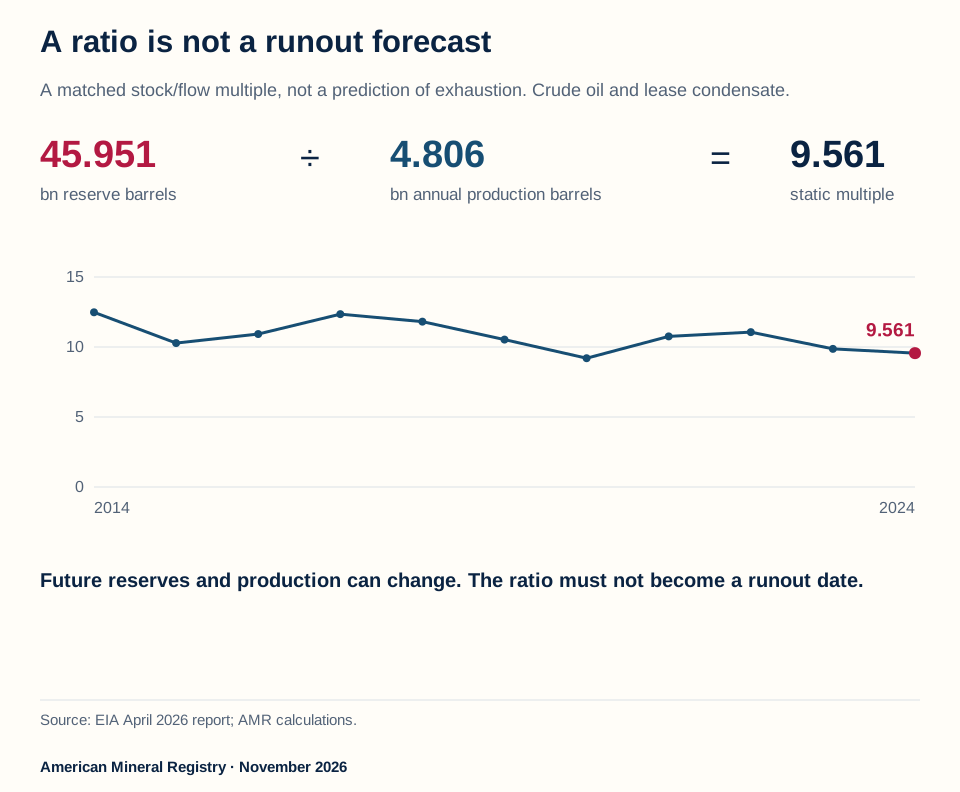
Figure 6 in text
2024 reserve-to-production multiple equals 45.951 divided by 4.806 or 9.561; the complete 2014 to 2024 ratio history is not a runout forecast.
A ratio is not a runout forecast A matched stock/flow multiple, not a prediction of exhaustion. Crude oil and lease condensate.
45.951 bn reserve barrels ÷
4.806 bn annual production barrels =
9.561 static multiple 0 5 10 15 2014 2024
9.561
Future reserves and production can change. The ratio must not become a runout date. Source: EIA April 2026 report; AMR calculations.
American Mineral Registry · November 2026
Additional phone figure text: 2024 year end reserves · 45.951 bn barrels · ÷ 2024 report production · 4.806 bn barrels
Source and data: EIA, matched reserve and production values
Permanent link to this figure’s text and data · Sources and context
What does the reserve to production multiple actually calculate?
It divides the reported reserve level by the matching annual production estimate. The arithmetic is reproducible and can describe the relationship between those quantities, provided its assumptions remain explicit.
For 2024, 45,951 million reserve barrels divided by 4,806 million barrels of production gives approximately 9.561. The units can be expressed as years at that unchanged annual rate, but this is a static accounting multiple. It does not incorporate future discoveries, revisions, price and cost changes, improved methods or changes in production. (AMR calculation from EIA, Apr 2026).
The same calculation is about 12.479 for 2014, 9.199 for 2020 and 11.062 for 2022. Those differences illustrate that the ratio itself moves as the estimate and production change. It is not a countdown that can be reduced by one each passing year while everything else is presumed fixed. (AMR comparison of EIA matched ratios, Apr 2026).
A sentence that says the United States will run out of oil in 9.561 years adds a forecast the data do not contain. The source definition is conditional, the reserves are not all resources underground, and the denominator is one year's source production estimate. A usable citation retains the words static ratio and the matched source year.
Why can the reserve estimate change even as production continues?
The definition depends on what is known and recoverable under the relevant conditions. Oil production reduces the balance, but other components can add enough to offset it or change the estimate in either direction.
The selected annual record demonstrates that reserve growth and production coexist. During 2021, the source estimates 4,129 million barrels of production while the reserve estimate rises by 6,206 million. Reported net additions reconstructed from those values are 10,335 million barrels. This example does not identify one technology or price as the cause; it shows the complete accounting outcome. (AMR comparison of EIA 2021 bridge, Apr 2026).
EIA's methodology collects operators' independently developed reserve estimates and estimates the portion associated with operators who do not report. The opened report says 385 of 398 sampled operators responded, providing about 95% coverage of national oil proved reserves. These describe the report's survey process and coverage, not a new AMR survey or a claim that the remaining portion is zero. (EIA, survey method and coverage, Apr 2026).
Future estimates require future evidence. This fixed historical reference is not a forecast model of drilling, costs, regulation, technology or market prices. It gives the complete reported accounting and makes its uncertainties and source definitions visible so a researcher does not need to substitute a simpler but inaccurate depletion story.
How should these statistics be used in a reusable citation?
Name the product category, estimate date, unit, source report and exact calculation. Preserve whether a number is directly reported, a rounded comparison, a derived remainder or a ratio with a stated denominator.
The specific finding tools provide that information for the current level, complete bridge, additions comparison, historical change frequency, shale concentration, national category reconciliation, rounding controls and static ratio. Each links to the exact supporting section and a matching CSV. These are AMR compilations and calculations from EIA's data, rather than independently measured operator reserves.
A reserve quantity does not establish the value of a particular mineral property, the ownership of a lease, a legally payable royalty or a buyer's ability to extract the estimate. Such conclusions need property-specific and transaction-specific evidence that this national source does not provide. The study's useful contribution is a transparent national comparison with its categories intact.
For related physical and trade measurements, use the strategic and commercial crude stock comparison and crude oil versus total petroleum trade. The AMR statistics library keeps the separate research questions discoverable. Combining their figures requires checking the date, stock or flow boundary and material scope again.
Methodology and Sources
AMR pinned the EIA report released April 7, 2026 and its four primary workbooks on November 14, 2026. The fixed comparison uses 41 national oil and lease condensate year end estimates from 1984 through 2024, eleven annual accounting rows from 2014 through 2024 and all seven named shale groups plus Other for 2023 and 2024. The program reads cached numerical cells directly without recalculating workbooks. All quantities retain million barrel units; display conversions divide by 1,000. National and shale totals remain separate. Every source component, reported change and independent rounding residual is preserved. Net additions equal reported change plus the matching report production estimate. Ratios use the same source edition and category. They do not forecast depletion. Full inputs, cell references, definitions, calculations and controls accompany the downloads.
Glossary
- Proved reserves: Quantities recoverable with reasonable certainty under the source's existing economic and operating conditions. This definition excludes crude placed in underground storage. (EIA reserve definitions, reviewed Nov 2026).
- Lease condensate: Light liquid hydrocarbons separated from natural gas at lease or field facilities. The national reserve figures here include this category alongside crude oil. (EIA glossary, reviewed Nov 2026).
- Year end level: The estimate at the end of a calendar year, distinct from the amount produced during it.
- Million barrels: The working unit; 1,000 million barrels equal one billion barrels.
- Extensions and discoveries: The named positive additions category used in the EIA accounting table.
- Revisions and other changes: The source's annual balancing item, not a separate estimate of one causal mechanism.
- Net acquisitions and divestitures: Acquisitions less divestitures in the reported reserve balance.
- Net additions: AMR's reconstruction of the full pre-production change, equal to published reserve change plus report production.
- Rounding residual: The difference needed to reconcile independently rounded published components and totals.
- Static reserve to production multiple: A reserve level divided by one matching annual production estimate, rather than an exhaustion forecast.
Sources
- EIA: Annual report, definitions, survey method and release date
- EIA: Proved crude oil reserve definitions and exclusions
- EIA: Lease condensate definition
- EIA: National proved reserves figure data, 1984 through 2024
- EIA: Table 1, U.S. proved reserves and changes, 2023 to 2024
- EIA: Table 2, shale oil and condensate production and reserves
- EIA: Table 5, national oil and condensate reserve accounting, 2014 through 2024