American Mineral RegistryResearch & data

U.S. Strategic Petroleum Reserve and Commercial Crude Stocks

Updated

U.S. strategic and commercial crude stocks measure oil already held in inventory, not oil still underground. At December 2025 month-end, EIA reported 413.464 million barrels in the Strategic Petroleum Reserve and 411.171 million barrels outside it, totaling 824.635 million. The SPR represented 50.1390% of that total. These are crude stock categories, not all petroleum products, annual production or proved geological reserves. (AMR calculations from EIA stocks, Nov 2026).

On this page
  1. Key Takeaways
  2. What is the difference between strategic and commercial crude stocks?
  3. How have the two stock categories changed across the complete record?
  4. Why can a year-end number hide what happened during the year?
  5. How much of a total stock change came from the SPR?
  6. Do strategic and commercial stocks always move in opposite directions?
  7. What can inventory statistics tell us about oil supply security?
  8. Methodology and Sources

AMR matches the three EIA series across every month of 2005 through 2025, keeping the available January through August 2026 observations separate. The comparison explains the category boundaries, monthly and year-end records, component changes, opposite movements and the difference between inventories and supply flows. Each result has readable HTML evidence, exact finding links and reproducible downloads. A falling SPR and a falling total crude inventory are related questions with different numerical answers.

Key Takeaways

  • Total U.S. crude stocks close December 2025 at 824.635 million barrels. (AMR calculations from EIA, Nov 2026).
  • December 2025 SPR stocks are 413.464 million barrels; stocks outside SPR are 411.171 million. (AMR calculations from EIA, Nov 2026).
  • The SPR holds 50.1390% of reported total crude stocks at December 2025 month-end. (AMR calculations from EIA, Nov 2026).
  • The fixed sample contains 252 month ends, January 2005 through December 2025, and 251 consecutive changes. (AMR calculations from EIA, Nov 2026).
  • SPR and commercial stocks move in opposite directions in 110 of 251 monthly comparisons, or 43.8%. (AMR calculations from EIA, Nov 2026).
  • Both components fall in 55 monthly comparisons and rise in 38, within the fixed historical sample. (AMR calculations from EIA, Nov 2026).
  • Reported SPR levels are unchanged in 48 comparisons; that does not prove an absence of gross flows. (AMR calculations from EIA, Nov 2026).
  • The fixed-panel SPR maximum is 726.616 million barrels at December 2009 month-end. (AMR calculations from EIA, Nov 2026).
  • The fixed-panel SPR minimum is 347.158 million barrels at June 2023 month-end. (AMR calculations from EIA, Nov 2026).
  • The fixed-panel commercial maximum is 538.595 million barrels at March 2017 month-end. (AMR calculations from EIA, Nov 2026).
  • Total crude stocks peak at 1230.105 million barrels in March 2017 within the fixed panel. (AMR calculations from EIA, Nov 2026).
  • December-to-December 2022 total stocks fall 212.734 million barrels: SPR minus 221.652, commercial plus 8.918 million. (AMR calculations from EIA, Nov 2026).
  • The largest fixed-panel monthly total increase is 48.553 million barrels in April 2020; largest decrease 35.153 million in June 2021. (AMR calculations from EIA, Nov 2026).
  • The separately observed August 2026 total is 701.962 million barrels, with 285.570 million in SPR. (AMR calculations from EIA, Nov 2026).

What is the difference between strategic and commercial crude stocks?

The Strategic Petroleum Reserve is an emergency stock category maintained by the federal government. The excluding-SPR series measures the separate crude inventory outside that category. Adding the two matching month-end observations gives total crude stocks. The labels describe reported inventories, rather than everything the country could ultimately produce.

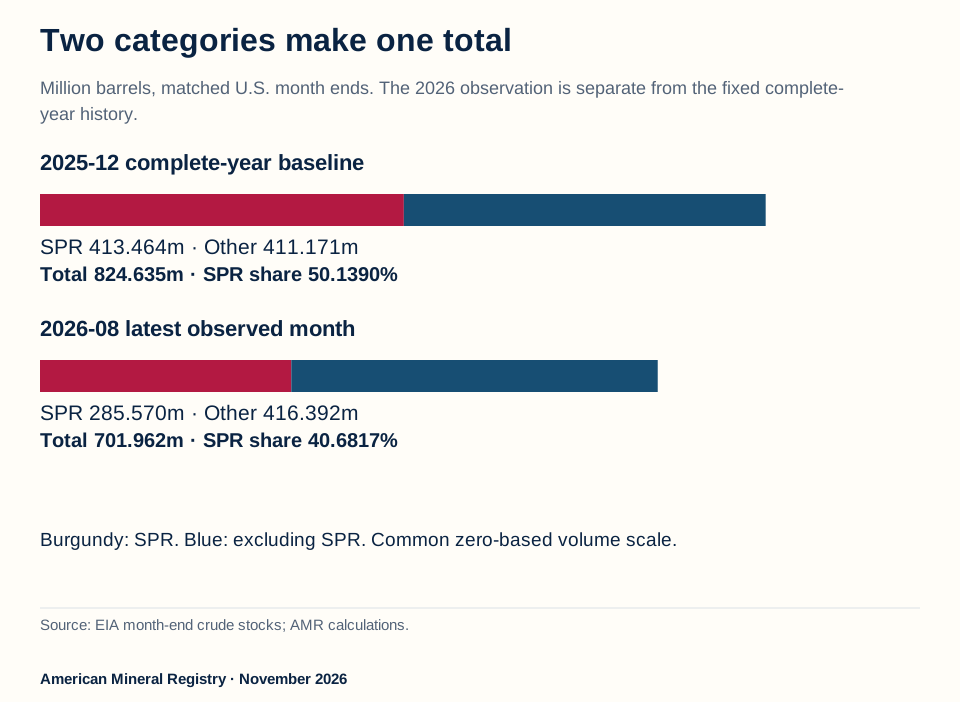
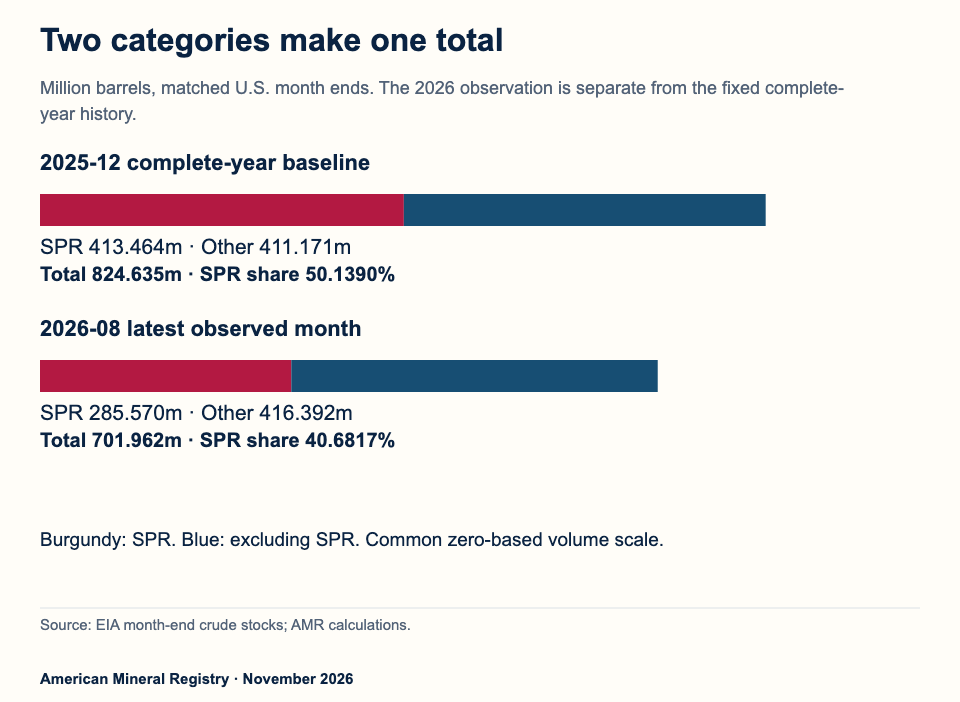
Matched SPR and excluding-SPR inventories sum to total crude stocks; December 2025 total 824.635 million barrels, August 2026 total 701.962 million.
Figure 1: December 2025 and separately observed August 2026 snapshots. Source: AMR calculations from EIA crude stocks, Nov 2026. Chart drawn by American Mineral Registry from the source figures, checked 14 Nov 2026.

Download original chart (SVG) · Chart image (PNG)

Figure 1 in text

Matched SPR and excluding-SPR inventories sum to total crude stocks; December 2025 total 824.635 million barrels, August 2026 total 701.962 million.

Two categories make one total Million barrels, matched U.S. month ends. The 2026 observation is separate from the fixed complete- year history.

2025-12 complete-year baseline SPR 413.464m · Other 411.171m

Total 824.635m · SPR share 50.1390%

2026-08 latest observed month SPR 285.570m · Other 416.392m

Total 701.962m · SPR share 40.6817% Burgundy: SPR. Blue: excluding SPR. Common zero-based volume scale. Source: EIA month-end crude stocks; AMR calculations.

American Mineral Registry · November 2026

Source and data: AMR calculations from EIA crude stocks

Which quantities belong in the same stock comparison?

The three series must have the same geography, petroleum category, unit and reference month. This study uses U.S. crude oil stocks, in thousand barrels, reported as of the last day of each month. It does not combine a weekly SPR observation with a monthly commercial observation or a daily production rate. (EIA, stock definitions and notes, Nov 2026).

Matched month-end crude stocks; million barrels. December is the complete-year baseline, August is a separate observed module.

MonthSPRExcluding SPRTotalSPR share %
2025-12413.464411.171824.63550.1390
2026-08285.570416.392701.96240.6817

Download the complete matching data (CSV).

At December 2025, the components were nearly equal in size. The most recent matched source month in this edition, August 2026, has 285.570 million barrels in the SPR and 416.392 million outside it, totaling 701.962 million. The latest SPR share is 40.6817%. This is an August observation available in the downloaded November source edition, not a measurement of the inventory on the article's update day. (AMR calculations from EIA stocks, Nov 2026).

The December baseline and recent module have different jobs. December closes the latest complete calendar year in the fixed historical sample. August is the latest available matched observation in the pinned files. Keeping both avoids treating an incomplete year as though it already had twelve observations or replacing a stable historical comparison with an undefined “now.”

Does commercial mean every barrel is owned by a private company?

The exact EIA series name is stocks excluding the SPR. Commercial is a convenient shorthand used in this reference, not a separate ownership census of every barrel. The calculation follows the published stock category and does not infer who owns an individual tank, pipeline inventory or shipment.

The SPR category itself also has a material qualification: EIA says it can include non-U.S. stocks held under foreign or commercial storage agreements. A reported SPR total therefore should not automatically be relabeled oil owned exclusively by the U.S. government. Preserve the source category when using the number. (EIA, explanatory stock notes, Nov 2026).

DOE describes the SPR's purpose as protection against a major disruption in commercial oil supplies. That purpose helps explain why the category is monitored separately. It does not mean the monthly inventory observation measures delivery capacity, an authorized future release or the amount that can reach a specific refinery on demand. (DOE, SPR purpose and operation, Nov 2026).

Are these figures the country's total oil reserves?

They are inventories of crude already in the reported storage system. Proved reserves are a different estimate about recoverable oil under specified geological and economic conditions. Petroleum product stocks, such as gasoline or distillate, are also distinct categories. An article about all oil reserves needs to identify which of those meanings it intends.

The stock dataset does not inventory every hydrocarbon molecule in the United States. EIA's January 2005 convention excludes lease stocks from the monthly and annual total, and its notes define further category boundaries. Those exclusions are part of the source's measurement, not an invitation to fill the omitted quantities with assumed zeros. (EIA, stock coverage, Nov 2026).

For a matching underground-reserve question, see U.S. proved oil reserve changes. For imports, exports and production flows, see crude oil versus petroleum trade. Each needs its own category and time denominator.

How have the two stock categories changed across the complete record?

The common panel contains 252 month ends, January 2005 through December 2025. It starts where all three files provide a complete matched comparison and EIA excludes lease stocks. The older SPR-only history remains in the raw source, without extending the commercial comparison by assumption.

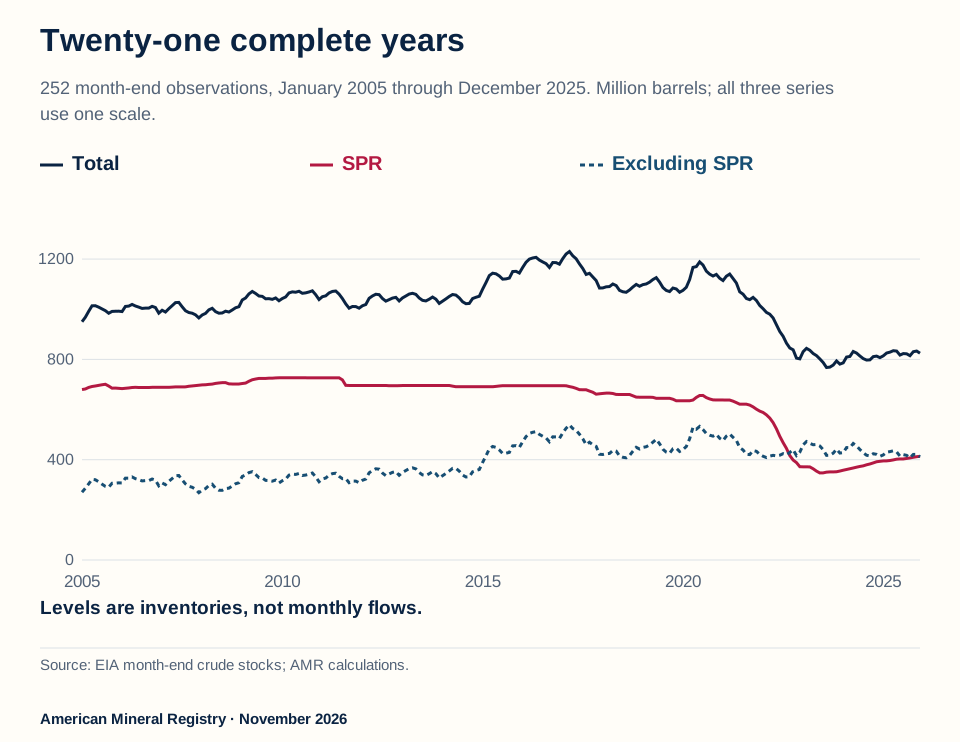
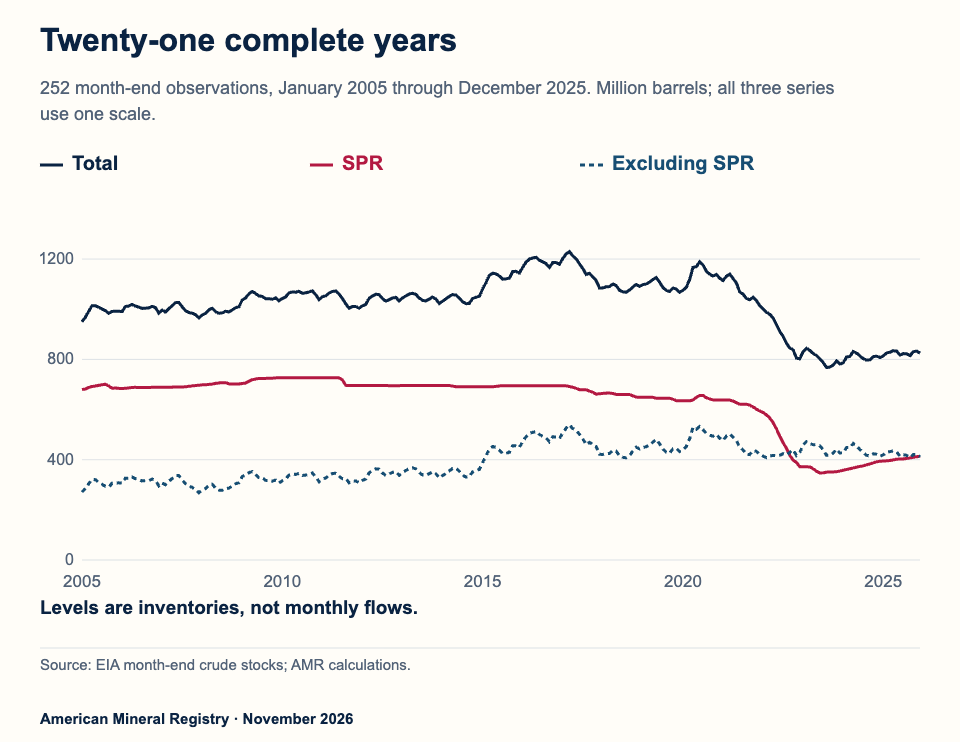
252 month-end observations for SPR, excluding-SPR and total crude stocks, with each category retaining its own path and source boundary.
Figure 2: Complete matched month-end levels, 2005 through 2025. Source: AMR calculations from EIA crude stocks, Nov 2026. Chart drawn by American Mineral Registry from the source figures, checked 14 Nov 2026.

Download original chart (SVG) · Chart image (PNG)

Figure 2 in text

252 month-end observations for SPR, excluding-SPR and total crude stocks, with each category retaining its own path and source boundary.

Twenty-one complete years 252 month-end observations, January 2005 through December 2025. Million barrels; all three series use one scale. 0 400 800 1200

Total

SPR

Excluding SPR 2005 2010 2015 2020 2025

Levels are inventories, not monthly flows. Source: EIA month-end crude stocks; AMR calculations.

American Mineral Registry · November 2026

Source and data: AMR calculations from EIA crude stocks

What do the full month-end histories show?

SPR stocks range from a fixed-panel minimum of 347.158 million barrels in June 2023 to a maximum of 726.616 million in December 2009. Stocks outside the SPR range from 268.393 million in December 2007 to 538.595 million in March 2017. These are extrema among the 252 included month ends, not daily records or the full history since the SPR began. (AMR fixed-panel comparison of EIA, Nov 2026).

Extrema within 252 month ends, January 2005 through December 2025; million barrels, not daily records.

SeriesMinimum monthMinimumMaximum monthMaximum
spr2023-06347.1582009-12726.616
commercial2007-12268.3932017-03538.595
total2023-08767.6312017-031,230.105

Download the complete matching data (CSV).

The total's own minimum and maximum occur at their own dates. It reaches 767.631 million barrels in August 2023 and 1,230.105 million in March 2017 within the fixed panel. A total minimum need not coincide with the SPR minimum because the other component can move at the same time. (AMR fixed-panel comparison of EIA, Nov 2026).

Adding the separate minimum SPR observation to the separate minimum commercial observation would create a combination that did not occur at one matched month end. The valid total is the sum of the components in the same month. The same rule applies to maxima and any comparison of changes. The full monthly download keeps those dates aligned.

Why not claim that these are all-time records?

Because the comparison has a declared source window and observation frequency. The source SPR workbook reaches back to October 1977, while the two matching total/excluding-SPR workbooks used here begin in January 2005. The analytical panel is the common period, and “lowest in the fixed 2005 through 2025 monthly sample” is the supported statement.

The recent 2026 module can be compared with that fixed panel, but it does not redefine the historical sample silently. For example, the August 2026 SPR level is below the fixed-panel minimum. That observation is not a claim that the SPR has never been lower since its earliest filling years, nor is it a claim about every weekly or daily observation. (AMR comparison of EIA source windows, Nov 2026).

A month-end record also need not equal a record in the weekly release. The measurement dates can differ. A monthly table is useful for a consistent long-run comparison, while a weekly series answers a higher-frequency question. This reference does not replace missing daily or weekly observations with a monthly value.

What does the change from the first to the last month mean?

It is a comparison of two observed inventory levels. It does not measure every purchase, sale, exchange, import, refinery input or transfer between those endpoints. Many gross movements can occur while a stock ends at the same level or changes by a relatively small net amount.

The first common observation is January 2005, not December 2004. An endpoint comparison using January's level therefore must be labeled January 2005 to December 2025. It is not the same calculation as a sequence of twenty December-to-December annual changes beginning in 2006. The downloads expose both definitions rather than mixing them under one “since 2005” headline.

The historical chart uses the common month-end levels and the exact same physical unit. It does not index each series to 100 or scale one line to make movements look equal. Source-defined levels reveal both the category sizes and their different paths; shares later answer the separate composition question.

Why can a year-end number hide what happened during the year?

A December observation is one month end out of twelve. It is neither the year's average inventory nor necessarily its highest or lowest value. The range of monthly observations helps a reader see whether a year-end headline captures the year's broader path or only its closing position.

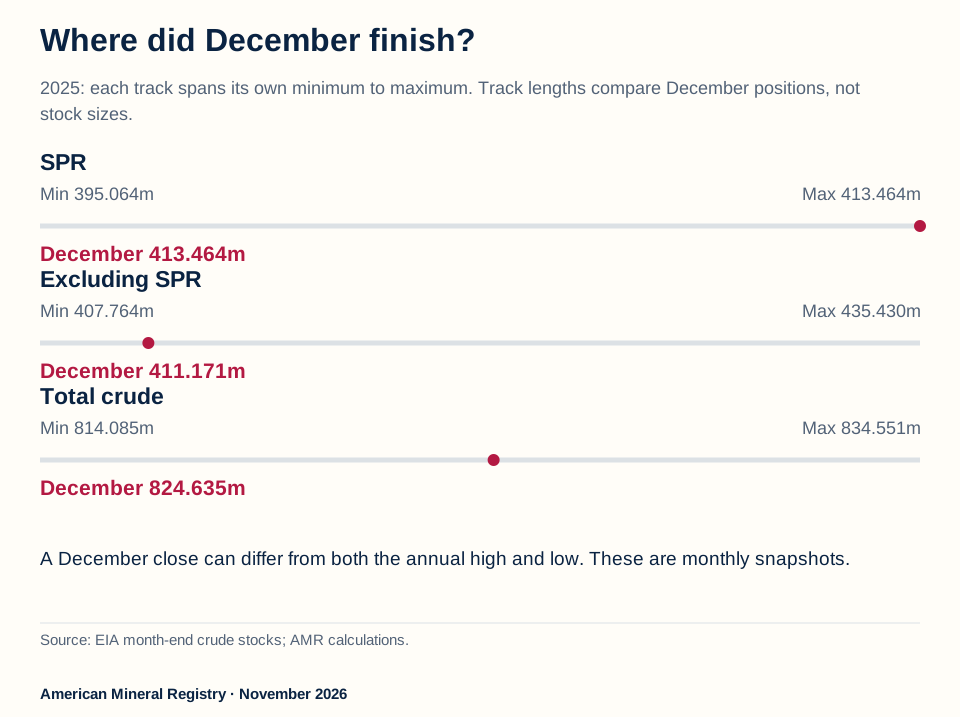
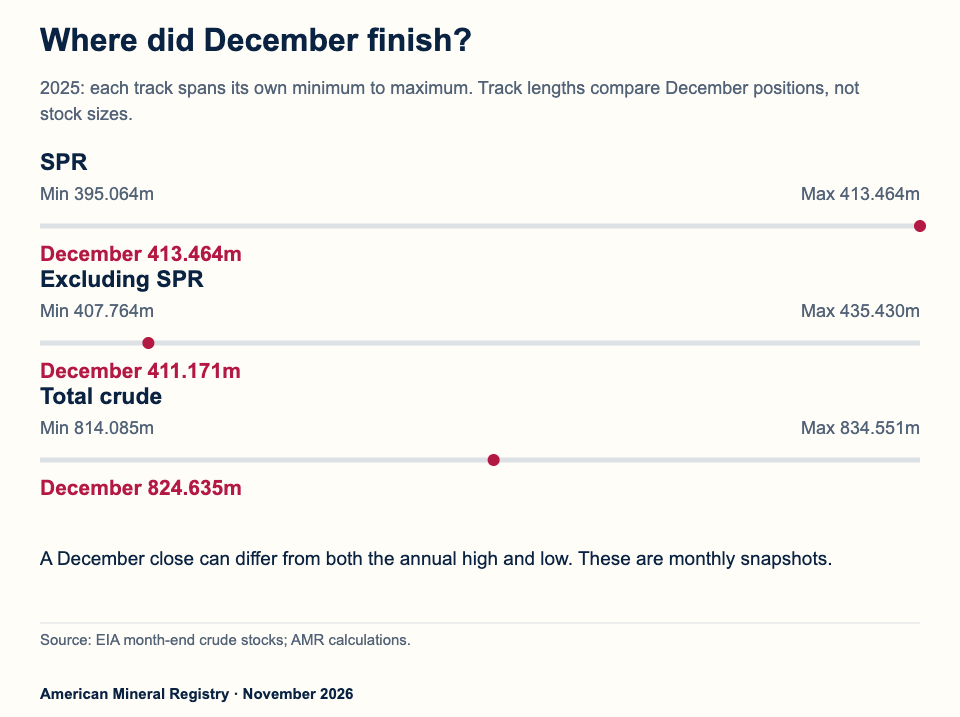
2025 commercial monthly range 407.764 to 435.430 million barrels, December 411.171; SPR 395.064 to 413.464, December 413.464; total 814.085 to 834.551, December 824.635.
Figure 3: December’s position inside each 2025 monthly range, not a common stock-size scale. Source: AMR calculations from EIA crude stocks, Nov 2026. Chart drawn by American Mineral Registry from the source figures, checked 14 Nov 2026.

Download original chart (SVG) · Chart image (PNG)

Figure 3 in text

2025 commercial monthly range 407.764 to 435.430 million barrels, December 411.171; SPR 395.064 to 413.464, December 413.464; total 814.085 to 834.551, December 824.635.

Where did December finish? 2025: each track spans its own minimum to maximum. Track lengths compare December positions, not stock sizes.

SPR Min 395.064m Max 413.464m

December 413.464m

Excluding SPR Min 407.764m Max 435.430m

December 411.171m

Total crude Min 814.085m Max 834.551m

December 824.635m A December close can differ from both the annual high and low. These are monthly snapshots. Source: EIA month-end crude stocks; AMR calculations.

American Mineral Registry · November 2026

Source and data: AMR calculations from EIA crude stocks

How different was December from the year's highest and lowest month?

In 2025, commercial crude stocks reach a monthly maximum of 435.430 million barrels in April and a minimum of 407.764 million in September. December closes at 411.171 million, which is 24.259 million below April and 3.407 million above September. All are month-end observations from the same series. (AMR within-year comparison of EIA, Nov 2026).

All 2025 month-end extrema and December closing stocks; million barrels. The full download includes all 63 year/category rows.

SeriesMinimum monthMinimumMaximum monthMaximumDecember
spr2025-01395.0642025-12413.464413.464
commercial2025-09407.7642025-04435.430411.171
total2025-01814.0852025-04834.551824.635

Download the complete matching data (CSV).

SPR stocks follow a different 2025 path: January is the lowest included month at 395.064 million and December is the highest at 413.464 million, a range of 18.400 million. Total crude stocks range from 814.085 million in January to 834.551 million in April; December is 824.635 million. A single category's high is not automatically the total's high. (AMR within-year comparison of EIA, Nov 2026).

The same calculation is available for all twenty-one complete years and all three stock series. The resulting 63-row table lists minimum and maximum values, every tied extremum month, December's value and its distance from both ends of the range. It does not choose only years with dramatic changes.

Would averaging twelve month ends answer the same question?

No. An average of twelve month-end observations is a descriptive average of those twelve snapshots. It is not an exact time-weighted daily average because the data do not provide every daily stock level or the path between snapshots. December answers what the reported stock was at the closing month end.

Adding the twelve stock levels would be a more serious mistake. The same physical inventory can be counted repeatedly as it remains in storage across months. Summed snapshots are not annual production, annual consumption or the volume that passed through the system. Stock levels and flows require separate accounting.

For a year-over-year inventory change, compare matching endpoints, such as December 2024 with December 2025. For a within-year range, compare all twelve months inside that calendar year. For a typical month-end level, specify the averaging convention. The reference tables preserve those separate questions.

Can the available 2026 months be treated as a full year?

The pinned source files provide eight matched months, January through August 2026. They can support those eight month-end observations and comparisons with an explicitly named earlier endpoint. They cannot support a December 2026 value, a full-year maximum or a full-year average.

From December 2025 to August 2026, SPR stocks fall by 127.894 million barrels while excluding-SPR stocks rise by 5.221 million. Total crude stocks fall by 122.673 million. These are matched endpoint stock changes; they are not the annual 2026 change or a statement that the SPR's gross releases were exactly 127.894 million barrels. (AMR recent-module comparison of EIA, Nov 2026).

The recent download keeps all eight observations visible. A future edition can extend that module after additional complete source months are available. The fixed 2005 through 2025 baseline remains reproducible, so a later observation does not erase which period an earlier statistic described.

How much of a total stock change came from the SPR?

With matched category definitions, the total change equals the SPR change plus the change outside the SPR. AMR applies that identity to every consecutive month and every matched December pair. This is a complete accounting reconciliation, rather than an estimate of which policy or market event caused a change.

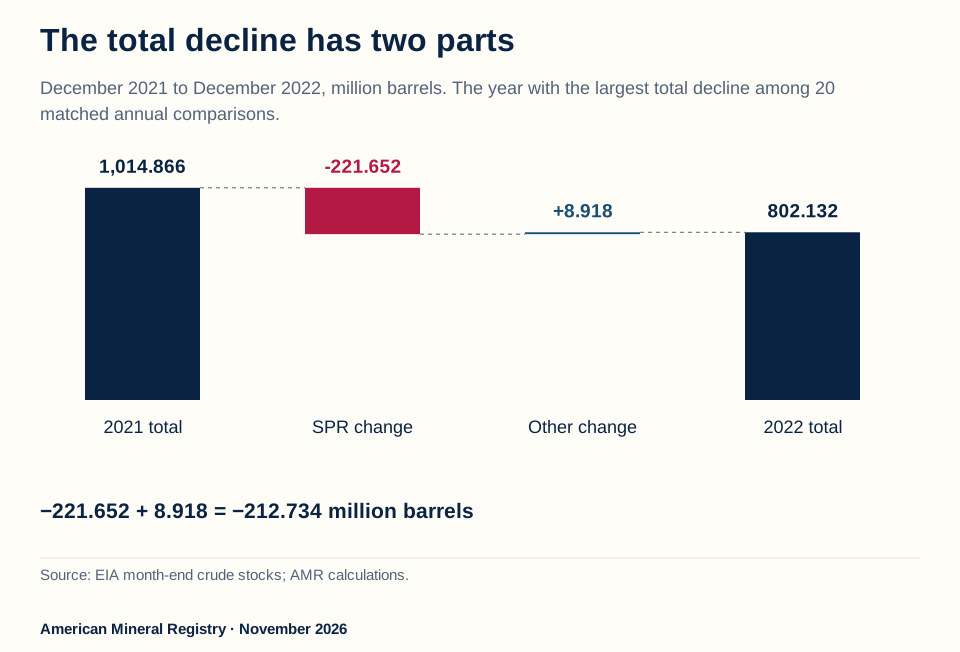
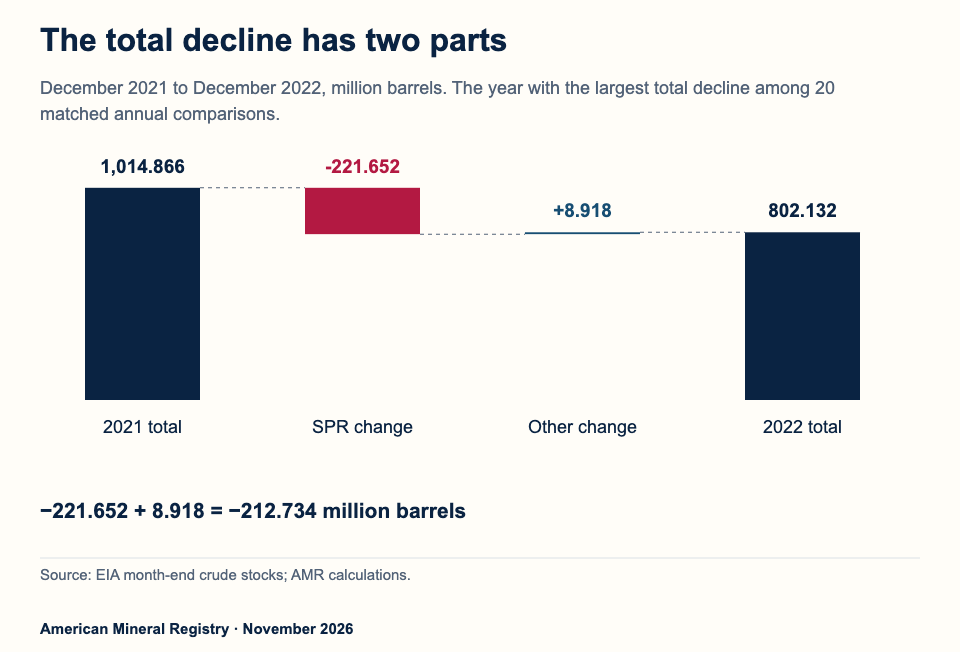
2022 total stocks decline 212.734 million barrels; SPR declines 221.652 million while commercial increases 8.918 million. Accounting contribution, not causation.
Figure 4: The largest December-to-December total decline in the 20-comparison sample is 2022. Source: AMR calculations from EIA crude stocks, Nov 2026. Chart drawn by American Mineral Registry from the source figures, checked 14 Nov 2026.

Download original chart (SVG) · Chart image (PNG)

Figure 4 in text

2022 total stocks decline 212.734 million barrels; SPR declines 221.652 million while commercial increases 8.918 million. Accounting contribution, not causation.

The total decline has two parts December 2021 to December 2022, million barrels. The year with the largest total decline among 20 matched annual comparisons.

1,014.866 2021 total

-221.652 SPR change

+8.918 Other change

802.132 2022 total

−221.652 + 8.918 = −212.734 million barrels Source: EIA month-end crude stocks; AMR calculations.

American Mineral Registry · November 2026

Additional phone figure text: 1,014.866m · -221.652m · +8.918m · 802.132m · SPR −221.652m + other +8.918m = total · −212.734m. Accounting, not causation.

Source and data: AMR calculations from EIA crude stocks

What does the largest annual total decline in the fixed sample show?

The largest December-to-December total crude-stock decline among the twenty comparisons is 2022, from 1,014.866 million barrels at December 2021 to 802.132 million at December 2022, a decrease of 212.734 million. The year is selected by that declared rule, not by a preferred explanation for the result. (AMR annual comparison of EIA, Nov 2026).

Largest annual total decline by the declared rule: December 2021 toDecember 2022; million barrels.

CategoryDecember 2021December 2022Change
spr593.682372.030-221.652
commercial421.184430.1028.918
total1,014.866802.132-212.734

Download the complete matching data (CSV).

Across those same endpoints, SPR stocks decrease by 221.652 million barrels and stocks outside the SPR increase by 8.918 million. The two changes sum to the 212.734 million total decline. Commercial inventory therefore partly offsets the SPR-category decline in the accounting, even though this panel does not identify the individual transactions behind either change. (AMR component reconciliation from EIA, Nov 2026).

For December 2024 to December 2025, the direction reverses: SPR stocks rise by 19.896 million and excluding-SPR stocks fall by 2.209 million, yielding a total increase of 17.687 million. The same identity applies regardless of which component rises or which has the larger change. (AMR component reconciliation from EIA, Nov 2026).

Is a component's share of the change the same as its share of inventory?

No. Inventory shares use a stock level as their denominator at a specified date. A contribution to a net change uses a difference between dates. When components move in opposite directions, one component's contribution can be larger in magnitude than the total net change. That does not mean its share of the stored inventory exceeds 100%.

The clearest reusable comparison often keeps the physical amounts instead of adding a potentially confusing percentage. In the 2022 bridge, minus 221.652 million plus 8.918 million equals minus 212.734 million. The denominator and the offset are visible, and an author can reproduce the identity directly.

An accounting contribution also is not a causal allocation. The stock panel does not estimate what commercial inventories would have been without an SPR release, how refiners changed purchases or how prices responded. Those questions require separate evidence and an appropriate design, rather than relabeling the identity as an impact estimate.

Can the SPR decline be called the volume sold or released?

Not from these stock observations alone. A closing inventory difference is a net result. Gross deliveries, receipts, exchange repayments and other transactions require their corresponding flow records. Two endpoints do not reveal how many offsetting movements occurred between them.

DOE distinguishes a sale from an exchange, with the latter involving a return obligation and premium barrels under the particular agreement. That operational distinction is one reason a stock balance cannot identify the terms or gross volume of every transaction. This reference does not interpret the legality or current authorization of an actual drawdown. (DOE, SPR sales and exchanges, Nov 2026).

The monthly-change download includes the two source levels for each component and the total, so the subtraction can be checked. All 251 monthly reconciliations and twenty annual reconciliations pass exactly at the source's reported thousand-barrel precision. A negative change means a smaller ending stock, not a negative physical inventory.

Do strategic and commercial stocks always move in opposite directions?

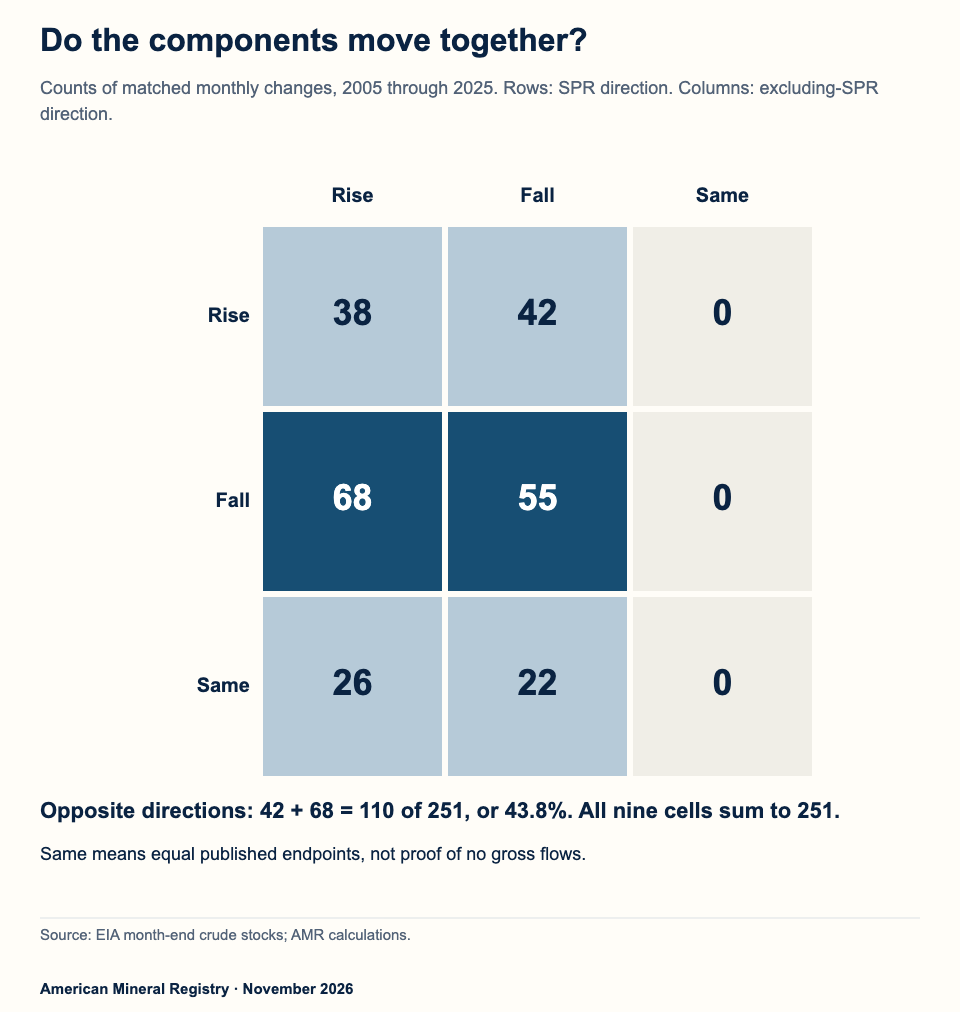
They do not. Across 251 consecutive monthly comparisons in the fixed 2005 through 2025 panel, the two components move in opposite directions in 110 months, or 43.8%. They also rise together, fall together, and sometimes show an unchanged reported SPR level while commercial stocks move.

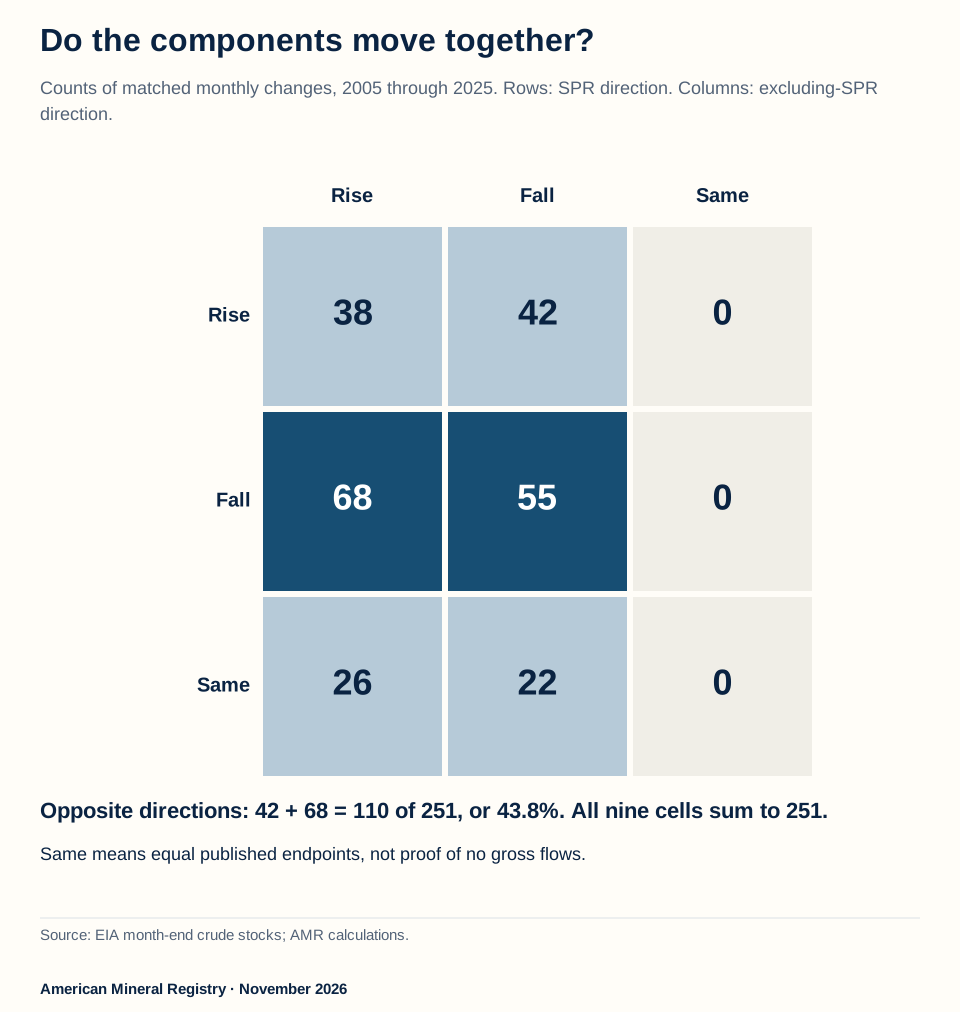
SPR and commercial move in opposite directions 110 of 251 months; both rise 38, both fall 55, SPR unchanged 48. Nine joint direction cells, including observed zeros.
Figure 5: All 251 consecutive monthly comparisons; unchanged reported values remain in the denominator. Source: AMR calculations from EIA crude stocks, Nov 2026. Chart drawn by American Mineral Registry from the source figures, checked 14 Nov 2026.

Download original chart (SVG) · Chart image (PNG)

Figure 5 in text

SPR and commercial move in opposite directions 110 of 251 months; both rise 38, both fall 55, SPR unchanged 48. Nine joint direction cells, including observed zeros.

Do the components move together? Counts of matched monthly changes, 2005 through 2025. Rows: SPR direction. Columns: excluding-SPR direction.

Rise

Fall

Same

Rise

38

42

0

Fall

68

55

0

Same

26

22

0

Opposite directions: 42 + 68 = 110 of 251, or 43.8%. All nine cells sum to 251. Same means equal published endpoints, not proof of no gross flows. Source: EIA month-end crude stocks; AMR calculations.

American Mineral Registry · November 2026

Source and data: AMR calculations from EIA crude stocks

How frequent is each observed combination?

The complete direction matrix retains all nine combinations of rising, falling and unchanged observations. An observed zero in this table means no comparison in the defined sample matched that joint condition. It is not a missing stock value converted into zero or a claim that the combination is impossible.

All 251 consecutive monthly comparisons in the fixed 2005 through 2025 panel. A zero is an observed sample count.

SPR directionCommercial directionObserved monthsShare %
risingrising3815.1
risingfalling4216.7
risingunchanged00.0
fallingrising6827.1
fallingfalling5521.9
fallingunchanged00.0
unchangedrising2610.4
unchangedfalling228.8
unchangedunchanged00.0

Download the complete matching data (CSV).

Both categories rise in 38 months and both fall in 55. SPR rises while commercial falls in 42 months; SPR falls while commercial rises in 68. The two opposite-direction cells sum to 110. The remaining 48 comparisons have an unchanged reported SPR level, with commercial rising in 26 and falling in 22. (AMR direction counts from EIA, Nov 2026).

The unchanged category follows the source's reported values. It does not prove that no oil moved during a month: gross receipts and deliveries could offset, or changes could be smaller than reporting precision. The measured fact is that the two published endpoint values are equal.

Why include the unchanged observations in the denominator?

Because the question asks about every valid consecutive monthly comparison, not only months in which both components change. Removing unchanged-SPR observations would select a smaller denominator and produce a different frequency. This article keeps all 251 comparisons in the primary result.

The initial January 2005 level has no previous month inside the common panel. It therefore contributes a stock observation but not a consecutive-month change. There are 252 levels and 251 changes, not two interchangeable sample sizes. The current 2026 module is also excluded from this fixed frequency rather than mixed in silently.

No smoothing or threshold defines a rise or fall here. The sign of the unrounded difference between reported thousand-barrel observations supplies the classification. A later study could ask about changes above a material threshold, but that would require its own declared rule and denominator.

Does opposite movement prove that oil transferred between the categories?

It establishes directions, not the physical route or ownership of a shipment. A decrease in one category and an increase in the other can be consistent with a transfer, but it can also coincide with other receipts, refinery use and trade flows. The two stock series alone do not identify which explanation applies in a particular month.

The matrix is useful precisely because its modest question is fully answered. It prevents a writer from assuming that an SPR decrease mechanically predicts an equal commercial increase, or that both categories always respond together. A causal or transaction-level story needs dated flow evidence in addition to the direction counts.

Researchers reusing the frequency should retain the fixed period, month-end observation convention, 251-comparison denominator and definition of opposite movement. The specific citation tool links directly to the complete matrix and underlying monthly-change file, rather than leaving the reader to infer the count from an image.

What can inventory statistics tell us about oil supply security?

They show reported crude inventories and their composition at specified dates, including unusual levels and changes within the defined sample. They do not establish when oil runs out, whether every barrel is immediately deliverable or how a release affects prices.

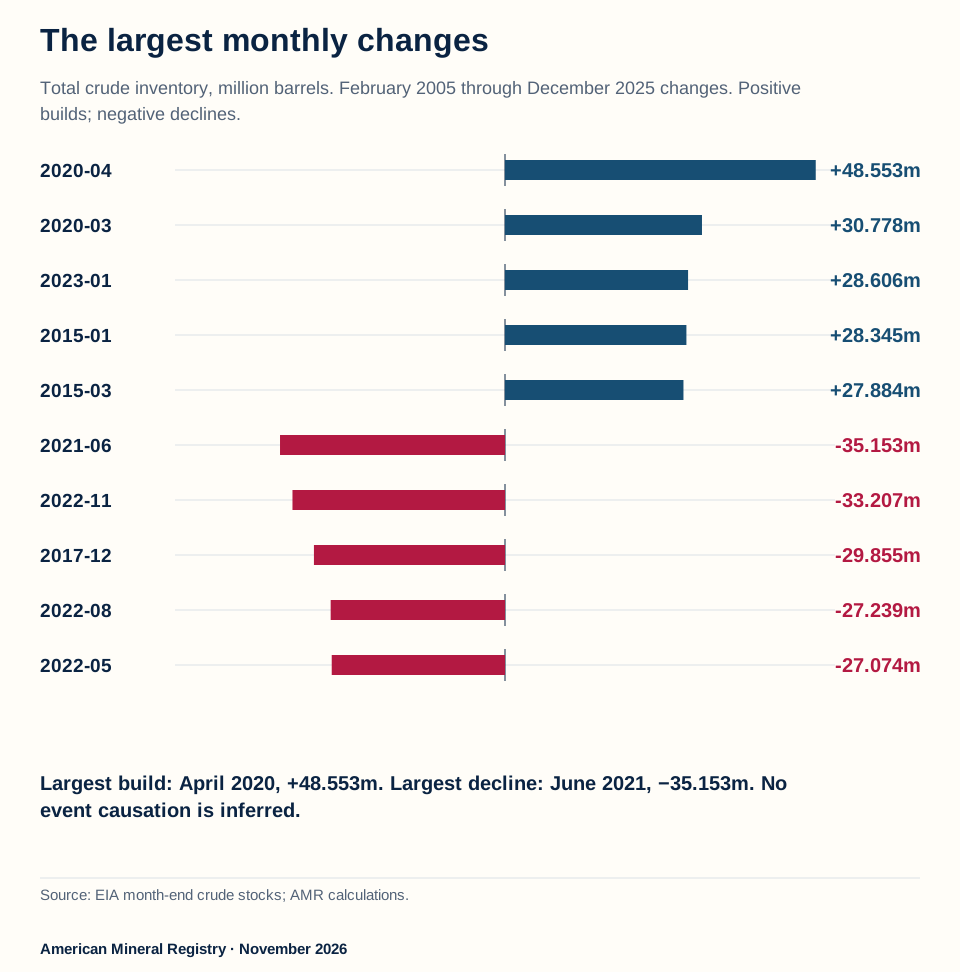
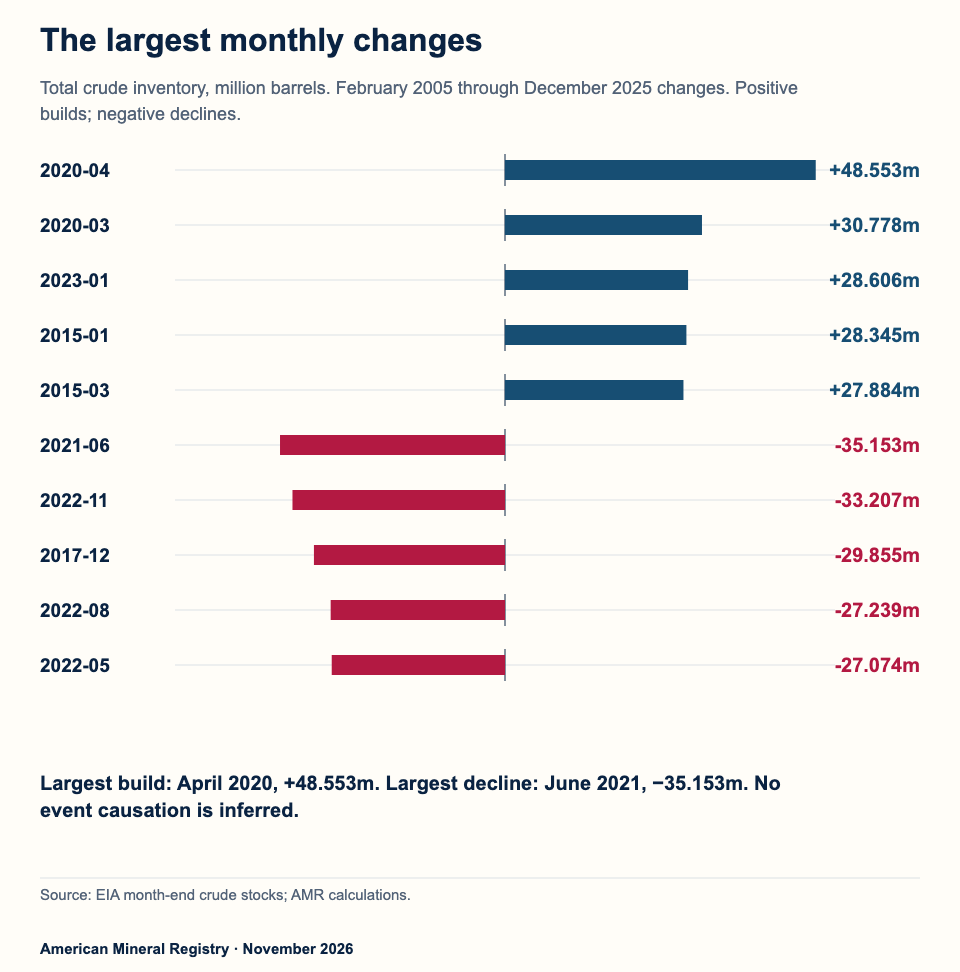
The largest monthly total increase is 48.553 million barrels in April 2020 and largest decline 35.153 million in June 2021; monthly endpoint changes, not gross flows.
Figure 6: Five largest increases and decreases in total crude stocks, fixed 2005 through 2025 panel. Source: AMR calculations from EIA crude stocks, Nov 2026. Chart drawn by American Mineral Registry from the source figures, checked 14 Nov 2026.

Download original chart (SVG) · Chart image (PNG)

Figure 6 in text

The largest monthly total increase is 48.553 million barrels in April 2020 and largest decline 35.153 million in June 2021; monthly endpoint changes, not gross flows.

The largest monthly changes Total crude inventory, million barrels. February 2005 through December 2025 changes. Positive builds; negative declines.

2020-04

+48.553m

2020-03

+30.778m

2023-01

+28.606m

2015-01

+28.345m

2015-03

+27.884m

2021-06

-35.153m

2022-11

-33.207m

2017-12

-29.855m

2022-08

-27.239m

2022-05

-27.074m

Largest build: April 2020, +48.553m. Largest decline: June 2021, −35.153m. No

event causation is inferred. Source: EIA month-end crude stocks; AMR calculations.

American Mineral Registry · November 2026

Source and data: AMR calculations from EIA crude stocks

Which monthly total-stock changes were largest?

Among the 251 fixed-panel changes, the largest total increase is 48.553 million barrels in April 2020, from 1,118.308 million at March month-end to 1,166.861 million at April month-end. The largest decrease is 35.153 million in June 2021, from 1,104.565 million to 1,069.412 million. (AMR ranked monthly changes from EIA, Nov 2026).

Five largest total crude-stock increases and decreases, February 2005 through December 2025; million barrels.

DirectionRankMonthPrevious stockCurrent stockChange
largest increase12020-041,118.3081,166.86148.553
largest increase22020-031,087.5301,118.30830.778
largest increase32023-01802.132830.73828.606
largest increase42015-011,051.8241,080.16928.345
largest increase52015-031,106.2661,134.15027.884
largest decrease12021-061,104.5651,069.412-35.153
largest decrease22022-11838.247805.040-33.207
largest decrease32017-121,114.3321,084.477-29.855
largest decrease42022-08892.081864.842-27.239
largest decrease52022-05965.248938.174-27.074

Download the complete matching data (CSV).

The complete download also ranks five increases and five decreases for SPR and excluding-SPR stocks separately. The total's largest decline need not be the SPR's largest decline, just as the total's minimum need not occur at the SPR minimum. The matched components determine the observed total.

These are changes between monthly closing observations, not the largest daily movement or a gross flow during the month. Naming a month identifies the observation without proving which event caused it. This reference does not assign a price effect, emergency severity or policy outcome to a large movement solely because its date is recognizable.

Why is stock divided by consumption not a reliable runout clock?

A stock divided by a correctly matched daily flow can describe an explicitly defined ratio under a stated hypothetical assumption. It does not establish that the country has that many days before supply ends. Production, imports, exports, refinery use and replenishment continue, and the stock categories are not an inventory of all recoverable resources.

Matching the denominator is essential even for an illustrative ratio. Crude stocks and all-petroleum consumption are different categories. A monthly endpoint and an annual average describe different time conventions. Available delivery rates, crude grades, locations and transport requirements would also matter to a real operating scenario. This stock panel does not supply those complete scenario inputs, so it publishes no invented national countdown.

The source-backed answer is the stock level and its documented historical context. For the broader trade balance, use the matched crude-versus-petroleum import/export comparison. For underground proved estimates, use the proved oil reserve accounting reference. Combining the numbers requires their categories and dates to remain intact.

What should a defensible stock citation contain?

Name the country, crude-stock category, observation date, unit, source and whether the statistic is a level, change, share or frequency. An extremum also needs its sample window and observation frequency. A direction count needs both its numerator and denominator. Those qualifications are part of the finding, rather than optional language to remove from a headline.

AMR's contribution is the reproducible matching, decomposition, extrema and direction comparison. EIA remains the original numerical producer, and DOE supplies the operational context. The citation tools retain both AMR's calculation and the relevant original authorities, while the CSVs preserve the observations used.

The full page and downloads are available without a form or account. A later edition can update the recent-month module and extend the fixed complete-year panel after source verification. The pinned input, dates and code keep this edition auditable even if a producer later revises observations at the same URL.

Methodology and Sources

AMR downloaded the three EIA monthly crude-stock workbooks on November 14, 2026 and matched their common January 2005 through August 2026 coverage. The fixed panel uses all 252 months through December 2025; eight 2026 months remain separate. Original thousand-barrel values reconcile total to SPR plus excluding-SPR stocks exactly. Decimal and independent rational checks verify shares. Consecutive changes require two reported months, giving 251 comparisons; December changes require two December observations, giving twenty. Extrema retain ties. Direction counts use the signs of reported differences and keep unchanged observations. The source defines stocks at period-end and excludes lease stocks beginning January 2005. Numerical findings describe inventories and accounting differences, not transaction flows, causal effects, proved resources or delivery guarantees. Downloads retain original workbooks, source coordinates and reproducible code.

Glossary

  • Stock: A reported inventory at a point in time, distinct from a flow across a period.
  • SPR: Strategic Petroleum Reserve, the emergency stock category defined by the source.
  • Excluding-SPR stocks: The separate crude inventory outside the SPR category, called commercial stocks here.
  • Month end: The last day of the reference month, the EIA stock observation convention.
  • Barrel: The oil volume unit; the input tables report thousand barrels.
  • Million barrels: One thousand of the source's thousand-barrel units.
  • Net stock change: Ending stock minus the named earlier stock, not all gross transactions.
  • Fixed panel: The predeclared complete 2005 through 2025 monthly sample used for historical statistics.
  • Opposite movement: One component rises while the other falls between matched month ends.
  • Percentage point: A difference between percentages, distinct from percentage growth in a stock level.

Sources

Cite a specific finding

Copy a finding with its exact period, denominator and primary source. The permanent link lands on the supporting evidence.

December 2025 composition

EIA reports December 2025 U.S. month-end crude inventories of 413.464 million barrels in SPR and 411.171 million excluding SPR, totaling 824.635 million. AMR calculates the SPR share at 50.1390%.

American Mineral Registry. EIA reports December 2025 U.S. month-end crude inventories of 413.464 million barrels in SPR and 411.171 million excluding SPR, totaling 824.635 million. AMR calculates the SPR share at 50.1390%. U.S. crude oil month-end inventories, not all petroleum products, gross delivery/release flows, proved underground reserves or a runout forecast. Fixed historical sample January 2005 through December 2025; recent 2026 observations separate. https://americanmineralregistry.com/research/us-strategic-petroleum-reserve-commercial-crude-stocks-statistics#stocks-december-composition Primary sources: https://www.eia.gov/dnav/pet/hist/LeafHandler.ashx?n=PET&s=MCRSTUS1&f=M; https://www.eia.gov/dnav/pet/hist/LeafHandler.ashx?n=PET&s=MCSSTUS1&f=M; https://www.eia.gov/dnav/pet/hist/LeafHandler.ashx?n=PET&s=MCESTUS1&f=M
Copy HTML attribution<a href="https://americanmineralregistry.com/research/us-strategic-petroleum-reserve-commercial-crude-stocks-statistics#stocks-december-composition">American Mineral Registry</a>. EIA reports December 2025 U.S. month-end crude inventories of 413.464 million barrels in SPR and 411.171 million excluding SPR, totaling 824.635 million. AMR calculates the SPR share at 50.1390%. U.S. crude oil month-end inventories, not all petroleum products, gross delivery/release flows, proved underground reserves or a runout forecast. Fixed historical sample January 2005 through December 2025; recent 2026 observations separate. Primary sources: <a href="https://www.eia.gov/dnav/pet/hist/LeafHandler.ashx?n=PET&s=MCRSTUS1&f=M">EIA primary numerical source</a>; <a href="https://www.eia.gov/dnav/pet/hist/LeafHandler.ashx?n=PET&s=MCSSTUS1&f=M">EIA SPR monthly stocks</a>; <a href="https://www.eia.gov/dnav/pet/hist/LeafHandler.ashx?n=PET&s=MCESTUS1&f=M">EIA excluding-SPR monthly stocks</a>.

Permanent finding link · Matching data (CSV) · Original producer source

EIA SPR monthly stocks · EIA excluding-SPR monthly stocks

Opposite movements

AMR counts opposite SPR and commercial crude-stock movements in 110 of 251 consecutive monthly comparisons, or 43.8%, across the fixed January 2005 through December 2025 U.S. month-end panel.

American Mineral Registry. AMR counts opposite SPR and commercial crude-stock movements in 110 of 251 consecutive monthly comparisons, or 43.8%, across the fixed January 2005 through December 2025 U.S. month-end panel. U.S. crude oil month-end inventories, not all petroleum products, gross delivery/release flows, proved underground reserves or a runout forecast. Fixed historical sample January 2005 through December 2025; recent 2026 observations separate. https://americanmineralregistry.com/research/us-strategic-petroleum-reserve-commercial-crude-stocks-statistics#stocks-opposite-directions Primary sources: https://www.eia.gov/dnav/pet/hist/LeafHandler.ashx?n=PET&s=MCRSTUS1&f=M; https://www.eia.gov/dnav/pet/hist/LeafHandler.ashx?n=PET&s=MCSSTUS1&f=M; https://www.eia.gov/dnav/pet/hist/LeafHandler.ashx?n=PET&s=MCESTUS1&f=M
Copy HTML attribution<a href="https://americanmineralregistry.com/research/us-strategic-petroleum-reserve-commercial-crude-stocks-statistics#stocks-opposite-directions">American Mineral Registry</a>. AMR counts opposite SPR and commercial crude-stock movements in 110 of 251 consecutive monthly comparisons, or 43.8%, across the fixed January 2005 through December 2025 U.S. month-end panel. U.S. crude oil month-end inventories, not all petroleum products, gross delivery/release flows, proved underground reserves or a runout forecast. Fixed historical sample January 2005 through December 2025; recent 2026 observations separate. Primary sources: <a href="https://www.eia.gov/dnav/pet/hist/LeafHandler.ashx?n=PET&s=MCRSTUS1&f=M">EIA primary numerical source</a>; <a href="https://www.eia.gov/dnav/pet/hist/LeafHandler.ashx?n=PET&s=MCSSTUS1&f=M">EIA SPR monthly stocks</a>; <a href="https://www.eia.gov/dnav/pet/hist/LeafHandler.ashx?n=PET&s=MCESTUS1&f=M">EIA excluding-SPR monthly stocks</a>.

Permanent finding link · Matching data (CSV) · Original producer source

EIA SPR monthly stocks · EIA excluding-SPR monthly stocks

Fixed-panel SPR extrema

Within 252 U.S. SPR month-end observations for 2005 through 2025, the minimum is 347.158 million barrels in June 2023 and the maximum 726.616 million in December 2009. These are fixed-sample monthly extrema, not all-time or daily records.

American Mineral Registry. Within 252 U.S. SPR month-end observations for 2005 through 2025, the minimum is 347.158 million barrels in June 2023 and the maximum 726.616 million in December 2009. These are fixed-sample monthly extrema, not all-time or daily records. U.S. crude oil month-end inventories, not all petroleum products, gross delivery/release flows, proved underground reserves or a runout forecast. Fixed historical sample January 2005 through December 2025; recent 2026 observations separate. https://americanmineralregistry.com/research/us-strategic-petroleum-reserve-commercial-crude-stocks-statistics#stocks-spr-extremes Primary sources: https://www.eia.gov/dnav/pet/hist/LeafHandler.ashx?n=PET&s=MCSSTUS1&f=M
Copy HTML attribution<a href="https://americanmineralregistry.com/research/us-strategic-petroleum-reserve-commercial-crude-stocks-statistics#stocks-spr-extremes">American Mineral Registry</a>. Within 252 U.S. SPR month-end observations for 2005 through 2025, the minimum is 347.158 million barrels in June 2023 and the maximum 726.616 million in December 2009. These are fixed-sample monthly extrema, not all-time or daily records. U.S. crude oil month-end inventories, not all petroleum products, gross delivery/release flows, proved underground reserves or a runout forecast. Fixed historical sample January 2005 through December 2025; recent 2026 observations separate. Primary sources: <a href="https://www.eia.gov/dnav/pet/hist/LeafHandler.ashx?n=PET&s=MCSSTUS1&f=M">EIA primary numerical source</a>.

Permanent finding link · Matching data (CSV) · Original producer source

Largest annual total decline

The largest December-to-December U.S. total crude-stock decline among the 20 fixed-panel comparisons is 2022: minus 212.734 million barrels. SPR changes by minus 221.652 million while excluding-SPR stocks rise 8.918 million. The amounts reconcile, without causal attribution.

American Mineral Registry. The largest December-to-December U.S. total crude-stock decline among the 20 fixed-panel comparisons is 2022: minus 212.734 million barrels. SPR changes by minus 221.652 million while excluding-SPR stocks rise 8.918 million. The amounts reconcile, without causal attribution. U.S. crude oil month-end inventories, not all petroleum products, gross delivery/release flows, proved underground reserves or a runout forecast. Fixed historical sample January 2005 through December 2025; recent 2026 observations separate. https://americanmineralregistry.com/research/us-strategic-petroleum-reserve-commercial-crude-stocks-statistics#stocks-2022-bridge Primary sources: https://www.eia.gov/dnav/pet/hist/LeafHandler.ashx?n=PET&s=MCRSTUS1&f=M; https://www.eia.gov/dnav/pet/hist/LeafHandler.ashx?n=PET&s=MCSSTUS1&f=M; https://www.eia.gov/dnav/pet/hist/LeafHandler.ashx?n=PET&s=MCESTUS1&f=M
Copy HTML attribution<a href="https://americanmineralregistry.com/research/us-strategic-petroleum-reserve-commercial-crude-stocks-statistics#stocks-2022-bridge">American Mineral Registry</a>. The largest December-to-December U.S. total crude-stock decline among the 20 fixed-panel comparisons is 2022: minus 212.734 million barrels. SPR changes by minus 221.652 million while excluding-SPR stocks rise 8.918 million. The amounts reconcile, without causal attribution. U.S. crude oil month-end inventories, not all petroleum products, gross delivery/release flows, proved underground reserves or a runout forecast. Fixed historical sample January 2005 through December 2025; recent 2026 observations separate. Primary sources: <a href="https://www.eia.gov/dnav/pet/hist/LeafHandler.ashx?n=PET&s=MCRSTUS1&f=M">EIA primary numerical source</a>; <a href="https://www.eia.gov/dnav/pet/hist/LeafHandler.ashx?n=PET&s=MCSSTUS1&f=M">EIA SPR monthly stocks</a>; <a href="https://www.eia.gov/dnav/pet/hist/LeafHandler.ashx?n=PET&s=MCESTUS1&f=M">EIA excluding-SPR monthly stocks</a>.

Permanent finding link · Matching data (CSV) · Original producer source

EIA SPR monthly stocks · EIA excluding-SPR monthly stocks

December is not the annual high

In 2025, EIAcommercial crude month-end stocks range from 407.764 million barrels in September to 435.430 million in April. December is 411.171 million, 24.259 million below April and 3.407 million above September.

American Mineral Registry. In 2025, EIAcommercial crude month-end stocks range from 407.764 million barrels in September to 435.430 million in April. December is 411.171 million, 24.259 million below April and 3.407 million above September. U.S. crude oil month-end inventories, not all petroleum products, gross delivery/release flows, proved underground reserves or a runout forecast. Fixed historical sample January 2005 through December 2025; recent 2026 observations separate. https://americanmineralregistry.com/research/us-strategic-petroleum-reserve-commercial-crude-stocks-statistics#stocks-year-end-context Primary sources: https://www.eia.gov/dnav/pet/hist/LeafHandler.ashx?n=PET&s=MCESTUS1&f=M
Copy HTML attribution<a href="https://americanmineralregistry.com/research/us-strategic-petroleum-reserve-commercial-crude-stocks-statistics#stocks-year-end-context">American Mineral Registry</a>. In 2025, EIAcommercial crude month-end stocks range from 407.764 million barrels in September to 435.430 million in April. December is 411.171 million, 24.259 million below April and 3.407 million above September. U.S. crude oil month-end inventories, not all petroleum products, gross delivery/release flows, proved underground reserves or a runout forecast. Fixed historical sample January 2005 through December 2025; recent 2026 observations separate. Primary sources: <a href="https://www.eia.gov/dnav/pet/hist/LeafHandler.ashx?n=PET&s=MCESTUS1&f=M">EIA primary numerical source</a>.

Permanent finding link · Matching data (CSV) · Original producer source

Largest monthly total changes

In 251 fixed-panel monthly U.S. total crude-stock changes ending February 2005 through December 2025, the largest increase is 48.553 million barrels in April 2020 and largest decline 35.153 million in June 2021. These are endpoint inventory differences, not gross flows.

American Mineral Registry. In 251 fixed-panel monthly U.S. total crude-stock changes ending February 2005 through December 2025, the largest increase is 48.553 million barrels in April 2020 and largest decline 35.153 million in June 2021. These are endpoint inventory differences, not gross flows. U.S. crude oil month-end inventories, not all petroleum products, gross delivery/release flows, proved underground reserves or a runout forecast. Fixed historical sample January 2005 through December 2025; recent 2026 observations separate. https://americanmineralregistry.com/research/us-strategic-petroleum-reserve-commercial-crude-stocks-statistics#stocks-monthly-extremes Primary sources: https://www.eia.gov/dnav/pet/hist/LeafHandler.ashx?n=PET&s=MCRSTUS1&f=M; https://www.eia.gov/dnav/pet/hist/LeafHandler.ashx?n=PET&s=MCSSTUS1&f=M; https://www.eia.gov/dnav/pet/hist/LeafHandler.ashx?n=PET&s=MCESTUS1&f=M
Copy HTML attribution<a href="https://americanmineralregistry.com/research/us-strategic-petroleum-reserve-commercial-crude-stocks-statistics#stocks-monthly-extremes">American Mineral Registry</a>. In 251 fixed-panel monthly U.S. total crude-stock changes ending February 2005 through December 2025, the largest increase is 48.553 million barrels in April 2020 and largest decline 35.153 million in June 2021. These are endpoint inventory differences, not gross flows. U.S. crude oil month-end inventories, not all petroleum products, gross delivery/release flows, proved underground reserves or a runout forecast. Fixed historical sample January 2005 through December 2025; recent 2026 observations separate. Primary sources: <a href="https://www.eia.gov/dnav/pet/hist/LeafHandler.ashx?n=PET&s=MCRSTUS1&f=M">EIA primary numerical source</a>; <a href="https://www.eia.gov/dnav/pet/hist/LeafHandler.ashx?n=PET&s=MCSSTUS1&f=M">EIA SPR monthly stocks</a>; <a href="https://www.eia.gov/dnav/pet/hist/LeafHandler.ashx?n=PET&s=MCESTUS1&f=M">EIA excluding-SPR monthly stocks</a>.

Permanent finding link · Matching data (CSV) · Original producer source

EIA SPR monthly stocks · EIA excluding-SPR monthly stocks

Components can move together

Across 251 fixed-panel monthly U.S. crude-stock comparisons, SPR and excluding-SPR stocks both rise in 38 months and both fall in 55. Reported SPR stocks are unchanged in 48 comparisons; unchanged endpoints do not establish no gross oil movements.

American Mineral Registry. Across 251 fixed-panel monthly U.S. crude-stock comparisons, SPR and excluding-SPR stocks both rise in 38 months and both fall in 55. Reported SPR stocks are unchanged in 48 comparisons; unchanged endpoints do not establish no gross oil movements. U.S. crude oil month-end inventories, not all petroleum products, gross delivery/release flows, proved underground reserves or a runout forecast. Fixed historical sample January 2005 through December 2025; recent 2026 observations separate. https://americanmineralregistry.com/research/us-strategic-petroleum-reserve-commercial-crude-stocks-statistics#stocks-same-direction Primary sources: https://www.eia.gov/dnav/pet/hist/LeafHandler.ashx?n=PET&s=MCRSTUS1&f=M; https://www.eia.gov/dnav/pet/hist/LeafHandler.ashx?n=PET&s=MCSSTUS1&f=M; https://www.eia.gov/dnav/pet/hist/LeafHandler.ashx?n=PET&s=MCESTUS1&f=M
Copy HTML attribution<a href="https://americanmineralregistry.com/research/us-strategic-petroleum-reserve-commercial-crude-stocks-statistics#stocks-same-direction">American Mineral Registry</a>. Across 251 fixed-panel monthly U.S. crude-stock comparisons, SPR and excluding-SPR stocks both rise in 38 months and both fall in 55. Reported SPR stocks are unchanged in 48 comparisons; unchanged endpoints do not establish no gross oil movements. U.S. crude oil month-end inventories, not all petroleum products, gross delivery/release flows, proved underground reserves or a runout forecast. Fixed historical sample January 2005 through December 2025; recent 2026 observations separate. Primary sources: <a href="https://www.eia.gov/dnav/pet/hist/LeafHandler.ashx?n=PET&s=MCRSTUS1&f=M">EIA primary numerical source</a>; <a href="https://www.eia.gov/dnav/pet/hist/LeafHandler.ashx?n=PET&s=MCSSTUS1&f=M">EIA SPR monthly stocks</a>; <a href="https://www.eia.gov/dnav/pet/hist/LeafHandler.ashx?n=PET&s=MCESTUS1&f=M">EIA excluding-SPR monthly stocks</a>.

Permanent finding link · Matching data (CSV) · Original producer source

EIA SPR monthly stocks · EIA excluding-SPR monthly stocks

Separate recent observation

The pinned source’s latest matched observation is August 2026: 285.570 million barrels in SPR and 416.392 million excluding SPR, totaling 701.962 million. The SPR share is 40.6817%. This is the source’s August month-end value, not inventory on the November 14 analysis date.

American Mineral Registry. The pinned source’s latest matched observation is August 2026: 285.570 million barrels in SPR and 416.392 million excluding SPR, totaling 701.962 million. The SPR share is 40.6817%. This is the source’s August month-end value, not inventory on the November 14 analysis date. U.S. crude oil month-end inventories, not all petroleum products, gross delivery/release flows, proved underground reserves or a runout forecast. Fixed historical sample January 2005 through December 2025; recent 2026 observations separate. https://americanmineralregistry.com/research/us-strategic-petroleum-reserve-commercial-crude-stocks-statistics#stocks-latest-observed Primary sources: https://www.eia.gov/dnav/pet/hist/LeafHandler.ashx?n=PET&s=MCRSTUS1&f=M; https://www.eia.gov/dnav/pet/hist/LeafHandler.ashx?n=PET&s=MCSSTUS1&f=M; https://www.eia.gov/dnav/pet/hist/LeafHandler.ashx?n=PET&s=MCESTUS1&f=M
Copy HTML attribution<a href="https://americanmineralregistry.com/research/us-strategic-petroleum-reserve-commercial-crude-stocks-statistics#stocks-latest-observed">American Mineral Registry</a>. The pinned source’s latest matched observation is August 2026: 285.570 million barrels in SPR and 416.392 million excluding SPR, totaling 701.962 million. The SPR share is 40.6817%. This is the source’s August month-end value, not inventory on the November 14 analysis date. U.S. crude oil month-end inventories, not all petroleum products, gross delivery/release flows, proved underground reserves or a runout forecast. Fixed historical sample January 2005 through December 2025; recent 2026 observations separate. Primary sources: <a href="https://www.eia.gov/dnav/pet/hist/LeafHandler.ashx?n=PET&s=MCRSTUS1&f=M">EIA primary numerical source</a>; <a href="https://www.eia.gov/dnav/pet/hist/LeafHandler.ashx?n=PET&s=MCSSTUS1&f=M">EIA SPR monthly stocks</a>; <a href="https://www.eia.gov/dnav/pet/hist/LeafHandler.ashx?n=PET&s=MCESTUS1&f=M">EIA excluding-SPR monthly stocks</a>.

Permanent finding link · Matching data (CSV) · Original producer source

EIA SPR monthly stocks · EIA excluding-SPR monthly stocks

Complete working tables

Every analytical table below is part of this page’s original HTML. Open a dataset to inspect all rows or use its matching CSV. No account is required. Calculated fractions use up to four decimals; CSVs retain full calculation precision. Original producer URLs and source-cell ledgers are available in the downloads. The dictionary defines every field, unit and denominator.

Comparison snapshots, all 2 rows
Comparison snapshots; the complete matching source-defined dataset
monthcommercial thousand barrelsspr thousand barrelstotal thousand barrelsspr share percentcommercial share percentobservation
2025-12411,171413,464824,63550.139049.8610month-end stock, not monthly average or flow
2026-08416,392285,570701,96240.681759.3183month-end stock, not monthly average or flow

Download the same complete table (CSV)

Consecutive month stock changes, all 251 rows
Consecutive month stock changes; the complete matching source-defined dataset
monthprevious monthcommercial change thousand barrelsspr change thousand barrelstotal change thousand barrelsspr directioncommercial directionspr current thousand barrelsspr previous thousand barrelscommercial current thousand barrelscommercial previous thousand barrelstotal current thousand barrelstotal previous thousand barrels
2005-022005-0115,6962,34318,039risingrising682,013679,670286,010270,314968,023949,984
2005-032005-0217,4966,13723,633risingrising688,150682,013303,506286,010991,656968,023
2005-042005-0318,2113,73021,941risingrising691,880688,150321,717303,5061,013,597991,656
2005-052005-04-1,6882,058370risingfalling693,938691,880320,029321,7171,013,9671,013,597
2005-062005-05-8,1472,460-5,687risingfalling696,398693,938311,882320,0291,008,2801,013,967
2005-072005-06-9,4822,413-7,069risingfalling698,811696,398302,400311,8821,001,2111,008,280
2005-082005-07-8,8261,915-6,911risingfalling700,726698,811293,574302,400994,3001,001,211
2005-092005-08-3,247-7,067-10,314fallingfalling693,659700,726290,327293,574983,986994,300
2005-102005-0915,708-8,4217,287fallingrising685,238693,659306,035290,327991,273983,986
2005-112005-10288392680risingrising685,630685,238306,323306,035991,953991,273
2005-122005-111,328-1,086242fallingrising684,544685,630307,651306,323992,195991,953
2006-012005-12-447-1,086-1,533fallingfalling683,458684,544307,204307,651990,662992,195
2006-022006-0119,1791,31120,490risingrising684,769683,458326,383307,2041,011,152990,662
2006-032006-02341,2851,319risingrising686,054684,769326,417326,3831,012,4711,011,152
2006-042006-034,8411,8336,674risingrising687,887686,054331,258326,4171,019,1451,012,471
2006-052006-04-6,972713-6,259risingfalling688,600687,887324,286331,2581,012,8861,019,145
2006-062006-05-3,763-753-4,516fallingfalling687,847688,600320,523324,2861,008,3701,012,886
2006-072006-06-5,136-2-5,138fallingfalling687,845687,847315,387320,5231,003,2321,008,370
2006-082006-071,235-51,230fallingrising687,840687,845316,622315,3871,004,4621,003,232
2006-092006-08-23-3-26fallingfalling687,837687,840316,599316,6221,004,4361,004,462
2006-102006-096,3187687,086risingrising688,605687,837322,917316,5991,011,5221,004,436
2006-112006-10-4,7330-4,733unchangedfalling688,605688,605318,184322,9171,006,7891,011,522
2006-122006-11-22,3650-22,365unchangedfalling688,605688,605295,819318,184984,4241,006,789
2007-012006-1211,514011,514unchangedrising688,605688,605307,333295,819995,938984,424
2007-022007-01-7,046-1-7,047fallingfalling688,604688,605300,287307,333988,891995,938
2007-032007-0213,254-213,252fallingrising688,602688,604313,541300,2871,002,143988,891
2007-042007-0311,25079012,040risingrising689,392688,602324,791313,5411,014,1831,002,143
2007-052007-0411,29787812,175risingrising690,270689,392336,088324,7911,026,3581,014,183
2007-062007-058650865unchangedrising690,270690,270336,953336,0881,027,2231,026,358
2007-072007-06-17,4730-17,473unchangedfalling690,270690,270319,480336,9531,009,7501,027,223
2007-082007-07-16,010167-15,843risingfalling690,437690,270303,470319,480993,9071,009,750
2007-092007-08-9,4292,366-7,063risingfalling692,803690,437294,041303,470986,844993,907
2007-102007-09-4,0081,326-2,682risingfalling694,129692,803290,033294,041984,162986,844
2007-112007-10-7,8531,374-6,479risingfalling695,503694,129282,180290,033977,683984,162
2007-122007-11-13,7871,438-12,349risingfalling696,941695,503268,393282,180965,334977,683
2008-012007-1210,3341,40811,742risingrising698,349696,941278,727268,393977,076965,334
2008-022008-015,9004736,373risingrising698,822698,349284,627278,727983,449977,076
2008-032008-0212,5911,55014,141risingrising700,372698,822297,218284,627997,590983,449
2008-042008-035,0211,0966,117risingrising701,468700,372302,239297,2181,003,707997,590
2008-052008-04-16,0892,785-13,304risingfalling704,253701,468286,150302,239990,4031,003,707
2008-062008-05-7,8961,702-6,194risingfalling705,955704,253278,254286,150984,209990,403
2008-072008-06-4061,260854risingfalling707,215705,955277,848278,254985,063984,209
2008-082008-077,166-37,163fallingrising707,212707,215285,014277,848992,226985,063
2008-092008-081,448-4,777-3,329fallingrising702,435707,212286,462285,014988,897992,226
2008-102008-098,698-6048,094fallingrising701,831702,435295,160286,462996,991988,897
2008-112008-108,851-38,848fallingrising701,828701,831304,011295,1601,005,839996,991
2008-122008-114,234-54,229fallingrising701,823701,828308,245304,0111,010,0681,005,839
2009-012008-1224,9091,96326,872risingrising703,786701,823333,154308,2451,036,9401,010,068
2009-022009-016,1311,7557,886risingrising705,541703,786339,285333,1541,044,8261,036,940
2009-032009-029,1437,25916,402risingrising712,800705,541348,428339,2851,061,2281,044,826
2009-042009-033,7435,9869,729risingrising718,786712,800352,171348,4281,070,9571,061,228
2009-052009-04-11,0652,912-8,153risingfalling721,698718,786341,106352,1711,062,8041,070,957
2009-062009-05-12,4492,400-10,049risingfalling724,098721,698328,657341,1061,052,7551,062,804
2009-072009-06-1,443-4-1,447fallingfalling724,094724,098327,214328,6571,051,3081,052,755
2009-082009-07-9,668-2-9,670fallingfalling724,092724,094317,546327,2141,041,6381,051,308
2009-092009-08-472994522risingfalling725,086724,092317,074317,5461,042,1601,041,638
2009-102009-09-2,665-5-2,670fallingfalling725,081725,086314,409317,0741,039,4901,042,160
2009-112009-104,4371,0485,485risingrising726,129725,081318,846314,4091,044,9751,039,490
2009-122009-11-11,706487-11,219risingfalling726,616726,129307,140318,8461,033,7561,044,975
2010-012009-128,964-48,960fallingrising726,612726,616316,104307,1401,042,7161,033,756
2010-022010-016,271-46,267fallingrising726,608726,612322,375316,1041,048,9831,042,716
2010-032010-0216,067-416,063fallingrising726,604726,608338,442322,3751,065,0461,048,983
2010-042010-034,193-54,188fallingrising726,599726,604342,635338,4421,069,2341,065,046
2010-052010-04-1,353-5-1,358fallingfalling726,594726,599341,282342,6351,067,8761,069,234
2010-062010-053,706-33,703fallingrising726,591726,594344,988341,2821,071,5791,067,876
2010-072010-06-7,971-5-7,976fallingfalling726,586726,591337,017344,9881,063,6031,071,579
2010-082010-071,702-51,697fallingrising726,581726,586338,719337,0171,065,3001,063,603
2010-092010-083,599-683,531fallingrising726,513726,581342,318338,7191,068,8311,065,300
2010-102010-094,512374,549risingrising726,550726,513346,830342,3181,073,3801,068,831
2010-112010-10-15,388-3-15,391fallingfalling726,547726,550331,442346,8301,057,9891,073,380
2010-122010-11-19,360-2-19,362fallingfalling726,545726,547312,082331,4421,038,6271,057,989
2011-012010-1211,377-211,375fallingrising726,543726,545323,459312,0821,050,0021,038,627
2011-022011-013,355-13,354fallingrising726,542726,543326,814323,4591,053,3561,050,002
2011-032011-0211,607011,607unchangedrising726,542726,542338,421326,8141,064,9631,053,356
2011-042011-035,99205,992unchangedrising726,542726,542344,413338,4211,070,9551,064,963
2011-052011-041,65901,659unchangedrising726,542726,542346,072344,4131,072,6141,070,955
2011-062011-05-12,373-11-12,384fallingfalling726,531726,542333,699346,0721,060,2301,072,614
2011-072011-06-9,407-8,316-17,723fallingfalling718,215726,531324,292333,6991,042,5071,060,230
2011-082011-07525-21,759-21,234fallingrising696,456718,215324,817324,2921,021,2731,042,507
2011-092011-08-16,572-505-17,077fallingfalling695,951696,456308,245324,8171,004,1961,021,273
2011-102011-096,67706,677unchangedrising695,951695,951314,922308,2451,010,8731,004,196
2011-112011-10-3200-320unchangedfalling695,951695,951314,602314,9221,010,5531,010,873
2011-122011-11-6,3810-6,381unchangedfalling695,951695,951308,221314,6021,004,1721,010,553
2012-012011-129,66109,661unchangedrising695,951695,951317,882308,2211,013,8331,004,172
2012-022012-014,99704,997unchangedrising695,951695,951322,879317,8821,018,8301,013,833
2012-032012-0224,729024,729unchangedrising695,951695,951347,608322,8791,043,5591,018,830
2012-042012-039,43709,437unchangedrising695,951695,951357,045347,6081,052,9961,043,559
2012-052012-046,71406,714unchangedrising695,951695,951363,759357,0451,059,7101,052,996
2012-062012-05-1,6060-1,606unchangedfalling695,951695,951362,153363,7591,058,1041,059,710
2012-072012-06-15,476-1-15,477fallingfalling695,950695,951346,677362,1531,042,6271,058,104
2012-082012-07-10,2860-10,286unchangedfalling695,950695,950336,391346,6771,032,3411,042,627
2012-092012-086,951-9985,953fallingrising694,952695,950343,342336,3911,038,2941,032,341
2012-102012-096,18906,189unchangedrising694,952694,952349,531343,3421,044,4831,038,294
2012-112012-102,88002,880unchangedrising694,952694,952352,411349,5311,047,3631,044,483
2012-122012-11-14,615316-14,299risingfalling695,268694,952337,796352,4111,033,0641,047,363
2013-012012-1211,49853712,035risingrising695,805695,268349,294337,7961,045,0991,033,064
2013-022013-017,5051647,669risingrising695,969695,805356,799349,2941,052,7681,045,099
2013-032013-027,82207,822unchangedrising695,969695,969364,621356,7991,060,5901,052,768
2013-042013-032,93402,934unchangedrising695,969695,969367,555364,6211,063,5241,060,590
2013-052013-04-4,2510-4,251unchangedfalling695,969695,969363,304367,5551,059,2731,063,524
2013-062013-05-14,4970-14,497unchangedfalling695,969695,969348,807363,3041,044,7761,059,273
2013-072013-06-9,4160-9,416unchangedfalling695,969695,969339,391348,8071,035,3601,044,776
2013-082013-07-2,2640-2,264unchangedfalling695,969695,969337,127339,3911,033,0961,035,360
2013-092013-086,88906,889unchangedrising695,969695,969344,016337,1271,039,9851,033,096
2013-102013-098,58108,581unchangedrising695,969695,969352,597344,0161,048,5661,039,985
2013-112013-10-8,4250-8,425unchangedfalling695,969695,969344,172352,5971,040,1411,048,566
2013-122013-11-16,9810-16,981unchangedfalling695,969695,969327,191344,1721,023,1601,040,141
2014-012013-129,04709,047unchangedrising695,969695,969336,238327,1911,032,2071,023,160
2014-022014-019,03609,036unchangedrising695,969695,969345,274336,2381,041,2431,032,207
2014-032014-029,713-409,673fallingrising695,929695,969354,987345,2741,050,9161,041,243
2014-042014-0310,352-2,6147,738fallingrising693,315695,929365,339354,9871,058,6541,050,916
2014-052014-04121-2,343-2,222fallingrising690,972693,315365,460365,3391,056,4321,058,654
2014-062014-05-11,1550-11,155unchangedfalling690,972690,972354,305365,4601,045,2771,056,432
2014-072014-06-15,5680-15,568unchangedfalling690,972690,972338,737354,3051,029,7091,045,277
2014-082014-07-7,6610-7,661unchangedfalling690,972690,972331,076338,7371,022,0481,029,709
2014-092014-081,079-31,076fallingrising690,969690,972332,155331,0761,023,1241,022,048
2014-102014-0919,562-319,559fallingrising690,966690,969351,717332,1551,042,6831,023,124
2014-112014-105,012-35,009fallingrising690,963690,966356,729351,7171,047,6921,042,683
2014-122014-114,136-44,132fallingrising690,959690,963360,865356,7291,051,8241,047,692
2015-012014-1228,348-328,345fallingrising690,956690,959389,213360,8651,080,1691,051,824
2015-022015-0126,100-326,097fallingrising690,953690,956415,313389,2131,106,2661,080,169
2015-032015-0227,887-327,884fallingrising690,950690,953443,200415,3131,134,1501,106,266
2015-042015-039,513-39,510fallingrising690,947690,950452,713443,2001,143,6601,134,150
2015-052015-04-3,7521,398-2,354risingfalling692,345690,947448,961452,7131,141,3061,143,660
2015-062015-05-10,1511,546-8,605risingfalling693,891692,345438,810448,9611,132,7011,141,306
2015-072015-06-14,0011,243-12,758risingfalling695,134693,891424,809438,8101,119,9431,132,701
2015-082015-071,044-41,040fallingrising695,130695,134425,853424,8091,120,9831,119,943
2015-092015-083,276-23,274fallingrising695,128695,130429,129425,8531,124,2571,120,983
2015-102015-0926,084-226,082fallingrising695,126695,128455,213429,1291,150,3391,124,257
2015-112015-10781-3778fallingrising695,123695,126455,994455,2131,151,1171,150,339
2015-122015-11-6,774-4-6,778fallingfalling695,119695,123449,220455,9941,144,3391,151,117
2016-012015-1222,547-322,544fallingrising695,116695,119471,767449,2201,166,8831,144,339
2016-022016-0120,386-220,384fallingrising695,114695,116492,153471,7671,187,2671,166,883
2016-032016-0212,658-212,656fallingrising695,112695,114504,811492,1531,199,9231,187,267
2016-042016-034,512-54,507fallingrising695,107695,112509,323504,8111,204,4301,199,923
2016-052016-042,538-32,535fallingrising695,104695,107511,861509,3231,206,9651,204,430
2016-062016-05-11,004-4-11,008fallingfalling695,100695,104500,857511,8611,195,9571,206,965
2016-072016-06-7,399-4-7,403fallingfalling695,096695,100493,458500,8571,188,5541,195,957
2016-082016-07-6,783-3-6,786fallingfalling695,093695,096486,675493,4581,181,7681,188,554
2016-092016-08-15,138-3-15,141fallingfalling695,090695,093471,537486,6751,166,6271,181,768
2016-102016-0919,666-319,663fallingrising695,087695,090491,203471,5371,186,2901,166,627
2016-112016-10-469-3-472fallingfalling695,084695,087490,734491,2031,185,8181,186,290
2016-122016-11-6,112-2-6,114fallingfalling695,082695,084484,622490,7341,179,7041,185,818
2017-012016-1222,176-422,172fallingrising695,078695,082506,798484,6221,201,8761,179,704
2017-022017-0118,621-25318,368fallingrising694,825695,078525,419506,7981,220,2441,201,876
2017-032017-0213,176-3,3159,861fallingrising691,510694,825538,595525,4191,230,1051,220,244
2017-042017-03-14,309-2,723-17,032fallingfalling688,787691,510524,286538,5951,213,0731,230,105
2017-052017-04-7,478-4,309-11,787fallingfalling684,478688,787516,808524,2861,201,2861,213,073
2017-062017-05-15,251-5,304-20,555fallingfalling679,174684,478501,557516,8081,180,7311,201,286
2017-072017-06-18,146-291-18,437fallingfalling678,883679,174483,411501,5571,162,2941,180,731
2017-082017-07-23,429-84-23,513fallingfalling678,799678,883459,982483,4111,138,7811,162,294
2017-092017-089,606-5,1594,447fallingrising673,640678,799469,588459,9821,143,2281,138,781
2017-102017-09-9,857-4,689-14,546fallingfalling668,951673,640459,731469,5881,128,6821,143,228
2017-112017-10-6,677-7,673-14,350fallingfalling661,278668,951453,054459,7311,114,3321,128,682
2017-122017-11-31,4081,553-29,855risingfalling662,831661,278421,646453,0541,084,4771,114,332
2018-012017-12-8861,403517risingfalling664,234662,831420,760421,6461,084,9941,084,477
2018-022018-013,0831,2244,307risingrising665,458664,234423,843420,7601,089,3011,084,994
2018-032018-021,096-21,094fallingrising665,456665,458424,939423,8431,090,3951,089,301
2018-042018-0311,639-1,49010,149fallingrising663,966665,456436,578424,9391,100,5441,090,395
2018-052018-04-2,381-3,799-6,180fallingfalling660,167663,966434,197436,5781,094,3641,100,544
2018-062018-05-19,045-152-19,197fallingfalling660,015660,167415,152434,1971,075,1671,094,364
2018-072018-06-5,511-2-5,513fallingfalling660,013660,015409,641415,1521,069,6541,075,167
2018-082018-07-2,058-2-2,060fallingfalling660,011660,013407,583409,6411,067,5941,069,654
2018-092018-089,101-29,099fallingrising660,009660,011416,684407,5831,076,6931,067,594
2018-102018-0917,124-5,16911,955fallingrising654,840660,009433,808416,6841,088,6481,076,693
2018-112018-1015,571-5,27310,298fallingrising649,567654,840449,379433,8081,098,9461,088,648
2018-122018-11-6,878-428-7,306fallingfalling649,139649,567442,501449,3791,091,6401,098,946
2019-012018-126,47106,471unchangedrising649,139649,139448,972442,5011,098,1111,091,640
2019-022019-012,688-132,675fallingrising649,126649,139451,660448,9721,100,7861,098,111
2019-032019-027,23007,230unchangedrising649,126649,126458,890451,6601,108,0161,100,786
2019-042019-0310,912-53810,374fallingrising648,588649,126469,802458,8901,118,3901,108,016
2019-052019-0411,323-3,7707,553fallingrising644,818648,588481,125469,8021,125,9431,118,390
2019-062019-05-17,6790-17,679unchangedfalling644,818644,818463,446481,1251,108,2641,125,943
2019-072019-06-21,8580-21,858unchangedfalling644,818644,818441,588463,4461,086,4061,108,264
2019-082019-07-11,4700-11,470unchangedfalling644,818644,818430,118441,5881,074,9361,086,406
2019-092019-08-4,5040-4,504unchangedfalling644,818644,818425,614430,1181,070,4321,074,936
2019-102019-0917,753-3,66514,088fallingrising641,153644,818443,367425,6141,084,5201,070,432
2019-112019-102,520-6,186-3,666fallingrising634,967641,153445,887443,3671,080,8541,084,520
2019-122019-11-13,1150-13,115unchangedfalling634,967634,967432,772445,8871,067,7391,080,854
2020-012019-127,48107,481unchangedrising634,967634,967440,253432,7721,075,2201,067,739
2020-022020-0112,310012,310unchangedrising634,967634,967452,563440,2531,087,5301,075,220
2020-032020-0230,778030,778unchangedrising634,967634,967483,341452,5631,118,3081,087,530
2020-042020-0345,6942,85948,553risingrising637,826634,967529,035483,3411,166,8611,118,308
2020-052020-04-7,44210,5003,058risingfalling648,326637,826521,593529,0351,169,9191,166,861
2020-062020-0511,0647,69718,761risingrising656,023648,326532,657521,5931,188,6801,169,919
2020-072020-06-12,533117-12,416risingfalling656,140656,023520,124532,6571,176,2641,188,680
2020-082020-07-15,725-8,610-24,335fallingfalling647,530656,140504,399520,1241,151,9291,176,264
2020-092020-08-6,675-5,344-12,019fallingfalling642,186647,530497,724504,3991,139,9101,151,929
2020-102020-09-3,802-3,630-7,432fallingfalling638,556642,186493,922497,7241,132,4781,139,910
2020-112020-106,830-4716,359fallingrising638,085638,556500,752493,9221,138,8371,132,478
2020-122020-11-15,2811-15,280risingfalling638,086638,085485,471500,7521,123,5571,138,837
2021-012020-12-9,202-1-9,203fallingfalling638,085638,086476,269485,4711,114,3541,123,557
2021-022021-0117,607-31217,295fallingrising637,773638,085493,876476,2691,131,6491,114,354
2021-032021-028,58818,589risingrising637,774637,773502,464493,8761,140,2381,131,649
2021-042021-03-13,306-4,346-17,652fallingfalling633,428637,774489,158502,4641,122,5861,140,238
2021-052021-04-12,178-5,843-18,021fallingfalling627,585633,428476,980489,1581,104,5651,122,586
2021-062021-05-28,872-6,281-35,153fallingfalling621,304627,585448,108476,9801,069,4121,104,565
2021-072021-06-9,363-2-9,365fallingfalling621,302621,304438,745448,1081,060,0471,069,412
2021-082021-07-17,2200-17,220unchangedfalling621,302621,302421,525438,7451,042,8271,060,047
2021-092021-08-1,182-3,534-4,716fallingfalling617,768621,302420,343421,5251,038,1111,042,827
2021-102021-0916,237-7,1229,115fallingrising610,646617,768436,580420,3431,047,2261,038,111
2021-112021-10-3,193-9,179-12,372fallingfalling601,467610,646433,387436,5801,034,8541,047,226
2021-122021-11-12,203-7,785-19,988fallingfalling593,682601,467421,184433,3871,014,8661,034,854
2022-012021-12-7,470-5,365-12,835fallingfalling588,317593,682413,714421,1841,002,0311,014,866
2022-022022-01-5,188-9,445-14,633fallingfalling578,872588,317408,526413,714987,3981,002,031
2022-032022-025,681-12,811-7,130fallingrising566,061578,872414,207408,526980,268987,398
2022-042022-033,175-18,195-15,020fallingrising547,866566,061417,382414,207965,248980,268
2022-052022-04-2,317-24,757-27,074fallingfalling523,109547,866415,065417,382938,174965,248
2022-062022-052,734-29,785-27,051fallingrising493,324523,109417,799415,065911,123938,174
2022-072022-066,276-25,318-19,042fallingrising468,006493,324424,075417,799892,081911,123
2022-082022-07-4,290-22,949-27,239fallingfalling445,057468,006419,785424,075864,842892,081
2022-092022-089,215-28,664-19,449fallingrising416,393445,057429,000419,785845,393864,842
2022-102022-0910,678-17,824-7,146fallingrising398,569416,393439,678429,000838,247845,393
2022-112022-10-23,057-10,150-33,207fallingfalling388,419398,569416,621439,678805,040838,247
2022-122022-1113,481-16,389-2,908fallingrising372,030388,419430,102416,621802,132805,040
2023-012022-1229,057-45128,606fallingrising371,579372,030459,159430,102830,738802,132
2023-022023-0113,210013,210unchangedrising371,579371,579472,369459,159843,948830,738
2023-032023-02-7,150-404-7,554fallingfalling371,175371,579465,219472,369836,394843,948
2023-042023-03-5,592-7,452-13,044fallingfalling363,723371,175459,627465,219823,350836,394
2023-052023-041,016-9,357-8,341fallingrising354,366363,723460,643459,627815,009823,350
2023-062023-05-5,928-7,208-13,136fallingfalling347,158354,366454,715460,643801,873815,009
2023-072023-06-14,768296-14,472risingfalling347,454347,158439,947454,715787,401801,873
2023-082023-07-22,6462,876-19,770risingfalling350,330347,454417,301439,947767,631787,401
2023-092023-085649441,508risingrising351,274350,330417,865417,301769,139767,631
2023-102023-098,12808,128unchangedrising351,274351,274425,993417,865777,267769,139
2023-112023-1015,84563716,482risingrising351,911351,274441,838425,993793,749777,267
2023-122023-11-15,3472,773-12,574risingfalling354,684351,911426,491441,838781,175793,749
2024-012023-121,6643,3294,993risingrising358,013354,684428,155426,491786,168781,175
2024-022024-0120,1822,94523,127risingrising360,958358,013448,337428,155809,295786,168
2024-032024-02-5832,9762,393risingfalling363,934360,958447,754448,337811,688809,295
2024-042024-0316,8462,98319,829risingrising366,917363,934464,600447,754831,517811,688
2024-052024-04-9,5743,250-6,324risingfalling370,167366,917455,026464,600825,193831,517
2024-062024-05-14,5442,905-11,639risingfalling373,072370,167440,482455,026813,554825,193
2024-072024-06-12,8102,361-10,449risingfalling375,433373,072427,672440,482803,105813,554
2024-082024-07-10,0114,223-5,788risingfalling379,656375,433417,661427,672797,317803,105
2024-092024-08-2,5103,274764risingfalling382,930379,656415,151417,661798,081797,317
2024-102024-098,6144,28812,902risingrising387,218382,930423,765415,151810,983798,081
2024-112024-10-2,5404,5822,042risingfalling391,800387,218421,225423,765813,025810,983
2024-122024-11-7,8451,768-6,077risingfalling393,568391,800413,380421,225806,948813,025
2025-012024-125,6411,4967,137risingrising395,064393,568419,021413,380814,085806,948
2025-022025-0110,99524911,244risingrising395,313395,064430,016419,021825,329814,085
2025-032025-022,1521,3973,549risingrising396,710395,313432,168430,016828,878825,329
2025-042025-033,2622,4115,673risingrising399,121396,710435,430432,168834,551828,878
2025-052025-04-4,3222,938-1,384risingfalling402,059399,121431,108435,430833,167834,551
2025-062025-05-16,858944-15,914risingfalling403,003402,059414,250431,108817,253833,167
2025-072025-065,919-275,892fallingrising402,976403,003420,169414,250823,145817,253
2025-082025-07-2,8751,965-910risingfalling404,941402,976417,294420,169822,235823,145
2025-092025-08-9,5302,042-7,488risingfalling406,983404,941407,764417,294814,747822,235
2025-102025-0913,2302,61115,841risingrising409,594406,983420,994407,764830,588814,747
2025-112025-102932,3282,621risingrising411,922409,594421,287420,994833,209830,588
2025-122025-11-10,1161,542-8,574risingfalling413,464411,922411,171421,287824,635833,209

Download the same complete table (CSV)

December year end stocks, all 21 rows
December year end stocks; the complete matching source-defined dataset
monthcommercial thousand barrelsspr thousand barrelstotal thousand barrelsspr share percentcommercial share percentobservation
2005-12307,651684,544992,19568.992931.0071month-end stock, not monthly average or flow
2006-12295,819688,605984,42469.950030.0500month-end stock, not monthly average or flow
2007-12268,393696,941965,33472.196927.8031month-end stock, not monthly average or flow
2008-12308,245701,8231,010,06869.482730.5173month-end stock, not monthly average or flow
2009-12307,140726,6161,033,75670.288929.7111month-end stock, not monthly average or flow
2010-12312,082726,5451,038,62769.952430.0476month-end stock, not monthly average or flow
2011-12308,221695,9511,004,17269.306030.6940month-end stock, not monthly average or flow
2012-12337,796695,2681,033,06467.301532.6985month-end stock, not monthly average or flow
2013-12327,191695,9691,023,16068.021531.9785month-end stock, not monthly average or flow
2014-12360,865690,9591,051,82465.691534.3085month-end stock, not monthly average or flow
2015-12449,220695,1191,144,33960.744239.2558month-end stock, not monthly average or flow
2016-12484,622695,0821,179,70458.920041.0800month-end stock, not monthly average or flow
2017-12421,646662,8311,084,47761.119938.8801month-end stock, not monthly average or flow
2018-12442,501649,1391,091,64059.464640.5354month-end stock, not monthly average or flow
2019-12432,772634,9671,067,73959.468440.5316month-end stock, not monthly average or flow
2020-12485,471638,0861,123,55756.791643.2084month-end stock, not monthly average or flow
2021-12421,184593,6821,014,86658.498641.5014month-end stock, not monthly average or flow
2022-12430,102372,030802,13246.380153.6199month-end stock, not monthly average or flow
2023-12426,491354,684781,17545.403954.5961month-end stock, not monthly average or flow
2024-12413,380393,568806,94848.772451.2276month-end stock, not monthly average or flow
2025-12411,171413,464824,63550.139049.8610month-end stock, not monthly average or flow

Download the same complete table (CSV)

Fixed panel summary, all 3 rows
Fixed panel summary; the complete matching source-defined dataset
seriesfixed first monthfixed last monthfirst thousand barrelslast thousand barrelsminimum monthminimum thousand barrelsmaximum monthmaximum thousand barrels
spr2005-012025-12679,670413,4642023-06347,1582009-12726,616
commercial2005-012025-12270,314411,1712007-12268,3932017-03538,595
total2005-012025-12949,984824,6352023-08767,6312017-031,230,105

Download the same complete table (CSV)

Joint stock direction frequencies, all 9 rows
Joint stock direction frequencies; the complete matching source-defined dataset
spr directioncommercial directionobserved monthsmatched comparisonsshare percent
risingrising3825115.1394
risingfalling4225116.7331
risingunchanged02510
fallingrising6825127.0916
fallingfalling5525121.9124
fallingunchanged02510
unchangedrising2625110.3586
unchangedfalling222518.7649
unchangedunchanged02510

Download the same complete table (CSV)

Largest monthly stock changes, all 30 rows
Largest monthly stock changes; the complete matching source-defined dataset
seriesdirectionrankmonthprevious monthchange thousand barrelsprevious thousand barrelscurrent thousand barrels
sprlargest increase12020-052020-0410,500637,826648,326
sprlargest increase22020-062020-057,697648,326656,023
sprlargest increase32009-032009-027,259705,541712,800
sprlargest increase42005-032005-026,137682,013688,150
sprlargest increase52009-042009-035,986712,800718,786
sprlargest decrease12022-062022-05-29,785523,109493,324
sprlargest decrease22022-092022-08-28,664445,057416,393
sprlargest decrease32022-072022-06-25,318493,324468,006
sprlargest decrease42022-052022-04-24,757547,866523,109
sprlargest decrease52022-082022-07-22,949468,006445,057
commerciallargest increase12020-042020-0345,694483,341529,035
commerciallargest increase22020-032020-0230,778452,563483,341
commerciallargest increase32023-012022-1229,057430,102459,159
commerciallargest increase42015-012014-1228,348360,865389,213
commerciallargest increase52015-032015-0227,887415,313443,200
commerciallargest decrease12017-122017-11-31,408453,054421,646
commerciallargest decrease22021-062021-05-28,872476,980448,108
commerciallargest decrease32017-082017-07-23,429483,411459,982
commerciallargest decrease42022-112022-10-23,057439,678416,621
commerciallargest decrease52023-082023-07-22,646439,947417,301
totallargest increase12020-042020-0348,5531,118,3081,166,861
totallargest increase22020-032020-0230,7781,087,5301,118,308
totallargest increase32023-012022-1228,606802,132830,738
totallargest increase42015-012014-1228,3451,051,8241,080,169
totallargest increase52015-032015-0227,8841,106,2661,134,150
totallargest decrease12021-062021-05-35,1531,104,5651,069,412
totallargest decrease22022-112022-10-33,207838,247805,040
totallargest decrease32017-122017-11-29,8551,114,3321,084,477
totallargest decrease42022-082022-07-27,239892,081864,842
totallargest decrease52022-052022-04-27,074965,248938,174

Download the same complete table (CSV)

Latest observed versus december, all 3 rows
Latest observed versus december; the complete matching source-defined dataset
seriesprevious monthlatest monthprevious thousand barrelslatest thousand barrelschange thousand barrelschange percent
spr2025-122026-08413,464285,570-127,894-30.9323
commercial2025-122026-08411,171416,3925,2211.2698
total2025-122026-08824,635701,962-122,673-14.8760

Download the same complete table (CSV)

Matched december annual changes, all 20 rows
Matched december annual changes; the complete matching source-defined dataset
yearprior yearspr previous thousand barrelsspr current thousand barrelsspr change thousand barrelsspr change percentcommercial previous thousand barrelscommercial current thousand barrelscommercial change thousand barrelscommercial change percenttotal previous thousand barrelstotal current thousand barrelstotal change thousand barrelstotal change percent
20062,005684,544688,6054,0610.5932307,651295,819-11,832-3.8459992,195984,424-7,771-0.7832
20072,006688,605696,9418,3361.2106295,819268,393-27,426-9.2712984,424965,334-19,090-1.9392
20082,007696,941701,8234,8820.7005268,393308,24539,85214.8484965,3341,010,06844,7344.6340
20092,008701,823726,61624,7933.5327308,245307,140-1,105-0.35851,010,0681,033,75623,6882.3452
20102,009726,616726,545-71-0.0098307,140312,0824,9421.60901,033,7561,038,6274,8710.4712
20112,010726,545695,951-30,594-4.2109312,082308,221-3,861-1.23721,038,6271,004,172-34,455-3.3174
20122,011695,951695,268-683-0.0981308,221337,79629,5759.59541,004,1721,033,06428,8922.8772
20132,012695,268695,9697010.1008337,796327,191-10,605-3.13951,033,0641,023,160-9,904-0.9587
20142,013695,969690,959-5,010-0.7199327,191360,86533,67410.29181,023,1601,051,82428,6642.8015
20152,014690,959695,1194,1600.6021360,865449,22088,35524.48421,051,8241,144,33992,5158.7957
20162,015695,119695,082-37-0.0053449,220484,62235,4027.88081,144,3391,179,70435,3653.0904
20172,016695,082662,831-32,251-4.6399484,622421,646-62,976-12.99491,179,7041,084,477-95,227-8.0721
20182,017662,831649,139-13,692-2.0657421,646442,50120,8554.94611,084,4771,091,6407,1630.6605
20192,018649,139634,967-14,172-2.1832442,501432,772-9,729-2.19861,091,6401,067,739-23,901-2.1895
20202,019634,967638,0863,1190.4912432,772485,47152,69912.17711,067,7391,123,55755,8185.2277
20212,020638,086593,682-44,404-6.9589485,471421,184-64,287-13.24221,123,5571,014,866-108,691-9.6738
20222,021593,682372,030-221,652-37.3351421,184430,1028,9182.11741,014,866802,132-212,734-20.9618
20232,022372,030354,684-17,346-4.6625430,102426,491-3,611-0.8396802,132781,175-20,957-2.6127
20242,023354,684393,56838,88410.9630426,491413,380-13,111-3.0742781,175806,94825,7733.2993
20252,024393,568413,46419,8965.0553413,380411,171-2,209-0.5344806,948824,63517,6872.1918

Download the same complete table (CSV)

Monthly stocks 2005 2025, all 252 rows
Monthly stocks 2005 2025; the complete matching source-defined dataset
monthcommercial thousand barrelsspr thousand barrelstotal thousand barrelsspr share percentcommercial share percentobservation
2005-01270,314679,670949,98471.545428.4546month-end stock, not monthly average or flow
2005-02286,010682,013968,02370.454229.5458month-end stock, not monthly average or flow
2005-03303,506688,150991,65669.394030.6060month-end stock, not monthly average or flow
2005-04321,717691,8801,013,59768.259931.7401month-end stock, not monthly average or flow
2005-05320,029693,9381,013,96768.437931.5621month-end stock, not monthly average or flow
2005-06311,882696,3981,008,28069.067930.9321month-end stock, not monthly average or flow
2005-07302,400698,8111,001,21169.796630.2034month-end stock, not monthly average or flow
2005-08293,574700,726994,30070.474329.5257month-end stock, not monthly average or flow
2005-09290,327693,659983,98670.494829.5052month-end stock, not monthly average or flow
2005-10306,035685,238991,27369.127130.8729month-end stock, not monthly average or flow
2005-11306,323685,630991,95369.119230.8808month-end stock, not monthly average or flow
2005-12307,651684,544992,19568.992931.0071month-end stock, not monthly average or flow
2006-01307,204683,458990,66268.990031.0100month-end stock, not monthly average or flow
2006-02326,383684,7691,011,15267.721732.2783month-end stock, not monthly average or flow
2006-03326,417686,0541,012,47167.760432.2396month-end stock, not monthly average or flow
2006-04331,258687,8871,019,14567.496532.5035month-end stock, not monthly average or flow
2006-05324,286688,6001,012,88667.984032.0160month-end stock, not monthly average or flow
2006-06320,523687,8471,008,37068.213831.7862month-end stock, not monthly average or flow
2006-07315,387687,8451,003,23268.562931.4371month-end stock, not monthly average or flow
2006-08316,622687,8401,004,46268.478431.5216month-end stock, not monthly average or flow
2006-09316,599687,8371,004,43668.479931.5201month-end stock, not monthly average or flow
2006-10322,917688,6051,011,52268.076131.9239month-end stock, not monthly average or flow
2006-11318,184688,6051,006,78968.396231.6038month-end stock, not monthly average or flow
2006-12295,819688,605984,42469.950030.0500month-end stock, not monthly average or flow
2007-01307,333688,605995,93869.141430.8586month-end stock, not monthly average or flow
2007-02300,287688,604988,89169.634030.3660month-end stock, not monthly average or flow
2007-03313,541688,6021,002,14368.712931.2871month-end stock, not monthly average or flow
2007-04324,791689,3921,014,18367.975132.0249month-end stock, not monthly average or flow
2007-05336,088690,2701,026,35867.254332.7457month-end stock, not monthly average or flow
2007-06336,953690,2701,027,22367.197732.8023month-end stock, not monthly average or flow
2007-07319,480690,2701,009,75068.360531.6395month-end stock, not monthly average or flow
2007-08303,470690,437993,90769.467030.5330month-end stock, not monthly average or flow
2007-09294,041692,803986,84470.203929.7961month-end stock, not monthly average or flow
2007-10290,033694,129984,16270.530029.4700month-end stock, not monthly average or flow
2007-11282,180695,503977,68371.137928.8621month-end stock, not monthly average or flow
2007-12268,393696,941965,33472.196927.8031month-end stock, not monthly average or flow
2008-01278,727698,349977,07671.473428.5266month-end stock, not monthly average or flow
2008-02284,627698,822983,44971.058328.9417month-end stock, not monthly average or flow
2008-03297,218700,372997,59070.206429.7936month-end stock, not monthly average or flow
2008-04302,239701,4681,003,70769.887730.1123month-end stock, not monthly average or flow
2008-05286,150704,253990,40371.107728.8923month-end stock, not monthly average or flow
2008-06278,254705,955984,20971.728228.2718month-end stock, not monthly average or flow
2008-07277,848707,215985,06371.793928.2061month-end stock, not monthly average or flow
2008-08285,014707,212992,22671.275328.7247month-end stock, not monthly average or flow
2008-09286,462702,435988,89771.032228.9678month-end stock, not monthly average or flow
2008-10295,160701,831996,99170.394929.6051month-end stock, not monthly average or flow
2008-11304,011701,8281,005,83969.775430.2246month-end stock, not monthly average or flow
2008-12308,245701,8231,010,06869.482730.5173month-end stock, not monthly average or flow
2009-01333,154703,7861,036,94067.871432.1286month-end stock, not monthly average or flow
2009-02339,285705,5411,044,82667.527132.4729month-end stock, not monthly average or flow
2009-03348,428712,8001,061,22867.167532.8325month-end stock, not monthly average or flow
2009-04352,171718,7861,070,95767.116232.8838month-end stock, not monthly average or flow
2009-05341,106721,6981,062,80467.905132.0949month-end stock, not monthly average or flow
2009-06328,657724,0981,052,75568.781231.2188month-end stock, not monthly average or flow
2009-07327,214724,0941,051,30868.875531.1245month-end stock, not monthly average or flow
2009-08317,546724,0921,041,63869.514730.4853month-end stock, not monthly average or flow
2009-09317,074725,0861,042,16069.575330.4247month-end stock, not monthly average or flow
2009-10314,409725,0811,039,49069.753530.2465month-end stock, not monthly average or flow
2009-11318,846726,1291,044,97569.487730.5123month-end stock, not monthly average or flow
2009-12307,140726,6161,033,75670.288929.7111month-end stock, not monthly average or flow
2010-01316,104726,6121,042,71669.684630.3154month-end stock, not monthly average or flow
2010-02322,375726,6081,048,98369.267930.7321month-end stock, not monthly average or flow
2010-03338,442726,6041,065,04668.222831.7772month-end stock, not monthly average or flow
2010-04342,635726,5991,069,23467.955132.0449month-end stock, not monthly average or flow
2010-05341,282726,5941,067,87668.041031.9590month-end stock, not monthly average or flow
2010-06344,988726,5911,071,57967.805632.1944month-end stock, not monthly average or flow
2010-07337,017726,5861,063,60368.313631.6864month-end stock, not monthly average or flow
2010-08338,719726,5811,065,30068.204431.7956month-end stock, not monthly average or flow
2010-09342,318726,5131,068,83167.972732.0273month-end stock, not monthly average or flow
2010-10346,830726,5501,073,38067.688132.3119month-end stock, not monthly average or flow
2010-11331,442726,5471,057,98968.672531.3275month-end stock, not monthly average or flow
2010-12312,082726,5451,038,62769.952430.0476month-end stock, not monthly average or flow
2011-01323,459726,5431,050,00269.194430.8056month-end stock, not monthly average or flow
2011-02326,814726,5421,053,35668.974031.0260month-end stock, not monthly average or flow
2011-03338,421726,5421,064,96368.222331.7777month-end stock, not monthly average or flow
2011-04344,413726,5421,070,95567.840632.1594month-end stock, not monthly average or flow
2011-05346,072726,5421,072,61467.735632.2644month-end stock, not monthly average or flow
2011-06333,699726,5311,060,23068.525831.4742month-end stock, not monthly average or flow
2011-07324,292718,2151,042,50768.893131.1069month-end stock, not monthly average or flow
2011-08324,817696,4561,021,27368.194931.8051month-end stock, not monthly average or flow
2011-09308,245695,9511,004,19669.304330.6957month-end stock, not monthly average or flow
2011-10314,922695,9511,010,87368.846531.1535month-end stock, not monthly average or flow
2011-11314,602695,9511,010,55368.868331.1317month-end stock, not monthly average or flow
2011-12308,221695,9511,004,17269.306030.6940month-end stock, not monthly average or flow
2012-01317,882695,9511,013,83368.645531.3545month-end stock, not monthly average or flow
2012-02322,879695,9511,018,83068.308831.6912month-end stock, not monthly average or flow
2012-03347,608695,9511,043,55966.690133.3099month-end stock, not monthly average or flow
2012-04357,045695,9511,052,99666.092533.9075month-end stock, not monthly average or flow
2012-05363,759695,9511,059,71065.673734.3263month-end stock, not monthly average or flow
2012-06362,153695,9511,058,10465.773434.2266month-end stock, not monthly average or flow
2012-07346,677695,9501,042,62766.749733.2503month-end stock, not monthly average or flow
2012-08336,391695,9501,032,34167.414732.5853month-end stock, not monthly average or flow
2012-09343,342694,9521,038,29466.932133.0679month-end stock, not monthly average or flow
2012-10349,531694,9521,044,48366.535533.4645month-end stock, not monthly average or flow
2012-11352,411694,9521,047,36366.352533.6475month-end stock, not monthly average or flow
2012-12337,796695,2681,033,06467.301532.6985month-end stock, not monthly average or flow
2013-01349,294695,8051,045,09966.577933.4221month-end stock, not monthly average or flow
2013-02356,799695,9691,052,76866.108533.8915month-end stock, not monthly average or flow
2013-03364,621695,9691,060,59065.620934.3791month-end stock, not monthly average or flow
2013-04367,555695,9691,063,52465.439934.5601month-end stock, not monthly average or flow
2013-05363,304695,9691,059,27365.702534.2975month-end stock, not monthly average or flow
2013-06348,807695,9691,044,77666.614233.3858month-end stock, not monthly average or flow
2013-07339,391695,9691,035,36067.220032.7800month-end stock, not monthly average or flow
2013-08337,127695,9691,033,09667.367332.6327month-end stock, not monthly average or flow
2013-09344,016695,9691,039,98566.921133.0789month-end stock, not monthly average or flow
2013-10352,597695,9691,048,56666.373433.6266month-end stock, not monthly average or flow
2013-11344,172695,9691,040,14166.911033.0890month-end stock, not monthly average or flow
2013-12327,191695,9691,023,16068.021531.9785month-end stock, not monthly average or flow
2014-01336,238695,9691,032,20767.425332.5747month-end stock, not monthly average or flow
2014-02345,274695,9691,041,24366.840233.1598month-end stock, not monthly average or flow
2014-03354,987695,9291,050,91666.221233.7788month-end stock, not monthly average or flow
2014-04365,339693,3151,058,65465.490234.5098month-end stock, not monthly average or flow
2014-05365,460690,9721,056,43265.406234.5938month-end stock, not monthly average or flow
2014-06354,305690,9721,045,27766.104233.8958month-end stock, not monthly average or flow
2014-07338,737690,9721,029,70967.103632.8964month-end stock, not monthly average or flow
2014-08331,076690,9721,022,04867.606632.3934month-end stock, not monthly average or flow
2014-09332,155690,9691,023,12467.535232.4648month-end stock, not monthly average or flow
2014-10351,717690,9661,042,68366.268133.7319month-end stock, not monthly average or flow
2014-11356,729690,9631,047,69265.951034.0490month-end stock, not monthly average or flow
2014-12360,865690,9591,051,82465.691534.3085month-end stock, not monthly average or flow
2015-01389,213690,9561,080,16963.967436.0326month-end stock, not monthly average or flow
2015-02415,313690,9531,106,26662.458137.5419month-end stock, not monthly average or flow
2015-03443,200690,9501,134,15060.922339.0777month-end stock, not monthly average or flow
2015-04452,713690,9471,143,66060.415439.5846month-end stock, not monthly average or flow
2015-05448,961692,3451,141,30660.662539.3375month-end stock, not monthly average or flow
2015-06438,810693,8911,132,70161.259938.7401month-end stock, not monthly average or flow
2015-07424,809695,1341,119,94362.068737.9313month-end stock, not monthly average or flow
2015-08425,853695,1301,120,98362.010837.9892month-end stock, not monthly average or flow
2015-09429,129695,1281,124,25761.830038.1700month-end stock, not monthly average or flow
2015-10455,213695,1261,150,33960.427939.5721month-end stock, not monthly average or flow
2015-11455,994695,1231,151,11760.386839.6132month-end stock, not monthly average or flow
2015-12449,220695,1191,144,33960.744239.2558month-end stock, not monthly average or flow
2016-01471,767695,1161,166,88359.570340.4297month-end stock, not monthly average or flow
2016-02492,153695,1141,187,26758.547441.4526month-end stock, not monthly average or flow
2016-03504,811695,1121,199,92357.929742.0703month-end stock, not monthly average or flow
2016-04509,323695,1071,204,43057.712542.2875month-end stock, not monthly average or flow
2016-05511,861695,1041,206,96557.591142.4089month-end stock, not monthly average or flow
2016-06500,857695,1001,195,95758.120841.8792month-end stock, not monthly average or flow
2016-07493,458695,0961,188,55458.482541.5175month-end stock, not monthly average or flow
2016-08486,675695,0931,181,76858.818141.1819month-end stock, not monthly average or flow
2016-09471,537695,0901,166,62759.581240.4188month-end stock, not monthly average or flow
2016-10491,203695,0871,186,29058.593341.4067month-end stock, not monthly average or flow
2016-11490,734695,0841,185,81858.616441.3836month-end stock, not monthly average or flow
2016-12484,622695,0821,179,70458.920041.0800month-end stock, not monthly average or flow
2017-01506,798695,0781,201,87657.832842.1672month-end stock, not monthly average or flow
2017-02525,419694,8251,220,24456.941543.0585month-end stock, not monthly average or flow
2017-03538,595691,5101,230,10556.215543.7845month-end stock, not monthly average or flow
2017-04524,286688,7871,213,07356.780343.2197month-end stock, not monthly average or flow
2017-05516,808684,4781,201,28656.978843.0212month-end stock, not monthly average or flow
2017-06501,557679,1741,180,73157.521542.4785month-end stock, not monthly average or flow
2017-07483,411678,8831,162,29458.408941.5911month-end stock, not monthly average or flow
2017-08459,982678,7991,138,78159.607540.3925month-end stock, not monthly average or flow
2017-09469,588673,6401,143,22858.924441.0756month-end stock, not monthly average or flow
2017-10459,731668,9511,128,68259.268340.7317month-end stock, not monthly average or flow
2017-11453,054661,2781,114,33259.343040.6570month-end stock, not monthly average or flow
2017-12421,646662,8311,084,47761.119938.8801month-end stock, not monthly average or flow
2018-01420,760664,2341,084,99461.220138.7799month-end stock, not monthly average or flow
2018-02423,843665,4581,089,30161.090438.9096month-end stock, not monthly average or flow
2018-03424,939665,4561,090,39561.028938.9711month-end stock, not monthly average or flow
2018-04436,578663,9661,100,54460.330739.6693month-end stock, not monthly average or flow
2018-05434,197660,1671,094,36460.324339.6757month-end stock, not monthly average or flow
2018-06415,152660,0151,075,16761.387238.6128month-end stock, not monthly average or flow
2018-07409,641660,0131,069,65461.703438.2966month-end stock, not monthly average or flow
2018-08407,583660,0111,067,59461.822338.1777month-end stock, not monthly average or flow
2018-09416,684660,0091,076,69361.299638.7004month-end stock, not monthly average or flow
2018-10433,808654,8401,088,64860.151739.8483month-end stock, not monthly average or flow
2018-11449,379649,5671,098,94659.108240.8918month-end stock, not monthly average or flow
2018-12442,501649,1391,091,64059.464640.5354month-end stock, not monthly average or flow
2019-01448,972649,1391,098,11159.114240.8858month-end stock, not monthly average or flow
2019-02451,660649,1261,100,78658.969341.0307month-end stock, not monthly average or flow
2019-03458,890649,1261,108,01658.584541.4155month-end stock, not monthly average or flow
2019-04469,802648,5881,118,39057.993042.0070month-end stock, not monthly average or flow
2019-05481,125644,8181,125,94357.269242.7308month-end stock, not monthly average or flow
2019-06463,446644,8181,108,26458.182741.8173month-end stock, not monthly average or flow
2019-07441,588644,8181,086,40659.353340.6467month-end stock, not monthly average or flow
2019-08430,118644,8181,074,93659.986640.0134month-end stock, not monthly average or flow
2019-09425,614644,8181,070,43260.239039.7610month-end stock, not monthly average or flow
2019-10443,367641,1531,084,52059.118640.8814month-end stock, not monthly average or flow
2019-11445,887634,9671,080,85458.746841.2532month-end stock, not monthly average or flow
2019-12432,772634,9671,067,73959.468440.5316month-end stock, not monthly average or flow
2020-01440,253634,9671,075,22059.054640.9454month-end stock, not monthly average or flow
2020-02452,563634,9671,087,53058.386241.6138month-end stock, not monthly average or flow
2020-03483,341634,9671,118,30856.779343.2207month-end stock, not monthly average or flow
2020-04529,035637,8261,166,86154.661745.3383month-end stock, not monthly average or flow
2020-05521,593648,3261,169,91955.416344.5837month-end stock, not monthly average or flow
2020-06532,657656,0231,188,68055.189244.8108month-end stock, not monthly average or flow
2020-07520,124656,1401,176,26455.781744.2183month-end stock, not monthly average or flow
2020-08504,399647,5301,151,92956.212743.7873month-end stock, not monthly average or flow
2020-09497,724642,1861,139,91056.336643.6634month-end stock, not monthly average or flow
2020-10493,922638,5561,132,47856.385743.6143month-end stock, not monthly average or flow
2020-11500,752638,0851,138,83756.029543.9705month-end stock, not monthly average or flow
2020-12485,471638,0861,123,55756.791643.2084month-end stock, not monthly average or flow
2021-01476,269638,0851,114,35457.260542.7395month-end stock, not monthly average or flow
2021-02493,876637,7731,131,64956.357843.6422month-end stock, not monthly average or flow
2021-03502,464637,7741,140,23855.933444.0666month-end stock, not monthly average or flow
2021-04489,158633,4281,122,58656.425843.5742month-end stock, not monthly average or flow
2021-05476,980627,5851,104,56556.817443.1826month-end stock, not monthly average or flow
2021-06448,108621,3041,069,41258.097741.9023month-end stock, not monthly average or flow
2021-07438,745621,3021,060,04758.610841.3892month-end stock, not monthly average or flow
2021-08421,525621,3021,042,82759.578640.4214month-end stock, not monthly average or flow
2021-09420,343617,7681,038,11159.508940.4911month-end stock, not monthly average or flow
2021-10436,580610,6461,047,22658.310841.6892month-end stock, not monthly average or flow
2021-11433,387601,4671,034,85458.121041.8790month-end stock, not monthly average or flow
2021-12421,184593,6821,014,86658.498641.5014month-end stock, not monthly average or flow
2022-01413,714588,3171,002,03158.712541.2875month-end stock, not monthly average or flow
2022-02408,526578,872987,39858.626041.3740month-end stock, not monthly average or flow
2022-03414,207566,061980,26857.745542.2545month-end stock, not monthly average or flow
2022-04417,382547,866965,24856.759143.2409month-end stock, not monthly average or flow
2022-05415,065523,109938,17455.758244.2418month-end stock, not monthly average or flow
2022-06417,799493,324911,12354.144645.8554month-end stock, not monthly average or flow
2022-07424,075468,006892,08152.462347.5377month-end stock, not monthly average or flow
2022-08419,785445,057864,84251.461148.5389month-end stock, not monthly average or flow
2022-09429,000416,393845,39349.254450.7456month-end stock, not monthly average or flow
2022-10439,678398,569838,24747.547952.4521month-end stock, not monthly average or flow
2022-11416,621388,419805,04048.248451.7516month-end stock, not monthly average or flow
2022-12430,102372,030802,13246.380153.6199month-end stock, not monthly average or flow
2023-01459,159371,579830,73844.728855.2712month-end stock, not monthly average or flow
2023-02472,369371,579843,94844.028755.9713month-end stock, not monthly average or flow
2023-03465,219371,175836,39444.378055.6220month-end stock, not monthly average or flow
2023-04459,627363,723823,35044.176055.8240month-end stock, not monthly average or flow
2023-05460,643354,366815,00943.480056.5200month-end stock, not monthly average or flow
2023-06454,715347,158801,87343.293456.7066month-end stock, not monthly average or flow
2023-07439,947347,454787,40144.126755.8733month-end stock, not monthly average or flow
2023-08417,301350,330767,63145.637854.3622month-end stock, not monthly average or flow
2023-09417,865351,274769,13945.671154.3289month-end stock, not monthly average or flow
2023-10425,993351,274777,26745.193554.8065month-end stock, not monthly average or flow
2023-11441,838351,911793,74944.335355.6647month-end stock, not monthly average or flow
2023-12426,491354,684781,17545.403954.5961month-end stock, not monthly average or flow
2024-01428,155358,013786,16845.539054.4610month-end stock, not monthly average or flow
2024-02448,337360,958809,29544.601555.3985month-end stock, not monthly average or flow
2024-03447,754363,934811,68844.836755.1633month-end stock, not monthly average or flow
2024-04464,600366,917831,51744.126255.8738month-end stock, not monthly average or flow
2024-05455,026370,167825,19344.858255.1418month-end stock, not monthly average or flow
2024-06440,482373,072813,55445.857154.1429month-end stock, not monthly average or flow
2024-07427,672375,433803,10546.747753.2523month-end stock, not monthly average or flow
2024-08417,661379,656797,31747.616752.3833month-end stock, not monthly average or flow
2024-09415,151382,930798,08147.981352.0187month-end stock, not monthly average or flow
2024-10423,765387,218810,98347.746752.2533month-end stock, not monthly average or flow
2024-11421,225391,800813,02548.190451.8096month-end stock, not monthly average or flow
2024-12413,380393,568806,94848.772451.2276month-end stock, not monthly average or flow
2025-01419,021395,064814,08548.528651.4714month-end stock, not monthly average or flow
2025-02430,016395,313825,32947.897652.1024month-end stock, not monthly average or flow
2025-03432,168396,710828,87847.861152.1389month-end stock, not monthly average or flow
2025-04435,430399,121834,55147.824652.1754month-end stock, not monthly average or flow
2025-05431,108402,059833,16748.256751.7433month-end stock, not monthly average or flow
2025-06414,250403,003817,25349.311950.6881month-end stock, not monthly average or flow
2025-07420,169402,976823,14548.955751.0443month-end stock, not monthly average or flow
2025-08417,294404,941822,23549.248850.7512month-end stock, not monthly average or flow
2025-09407,764406,983814,74749.952150.0479month-end stock, not monthly average or flow
2025-10420,994409,594830,58849.313750.6863month-end stock, not monthly average or flow
2025-11421,287411,922833,20949.438050.5620month-end stock, not monthly average or flow
2025-12411,171413,464824,63550.139049.8610month-end stock, not monthly average or flow

Download the same complete table (CSV)

Recent observed months 2026, all 8 rows
Recent observed months 2026; the complete matching source-defined dataset
monthcommercial thousand barrelsspr thousand barrelstotal thousand barrelsspr share percentcommercial share percentobservation
2026-01406,144415,212821,35650.552049.4480month-end stock, not monthly average or flow
2026-02434,907415,442850,34948.855551.1445month-end stock, not monthly average or flow
2026-03453,424414,825868,24947.777252.2228month-end stock, not monthly average or flow
2026-04450,173394,524844,69746.706053.2940month-end stock, not monthly average or flow
2026-05425,203355,381780,58445.527654.4724month-end stock, not monthly average or flow
2026-06404,121322,186726,30744.359555.6405month-end stock, not monthly average or flow
2026-07408,533304,810713,34342.729857.2702month-end stock, not monthly average or flow
2026-08416,392285,570701,96240.681759.3183month-end stock, not monthly average or flow

Download the same complete table (CSV)

Within year month end extremes, all 63 rows
Within year month end extremes; the complete matching source-defined dataset
yearseriesminimum thousand barrelsminimum monthsmaximum thousand barrelsmaximum monthsdecember thousand barrelswithin year range thousand barrelsdecember minus minimum thousand barrelsmaximum minus december thousand barrels
2005spr679,6702005-01700,7262005-08684,54421,0564,87416,182
2005commercial270,3142005-01321,7172005-04307,65151,40337,33714,066
2005total949,9842005-011,013,9672005-05992,19563,98342,21121,772
2006spr683,4582006-01688,6052006-10;2006-11;2006-12688,6055,1475,1470
2006commercial295,8192006-12331,2582006-04295,81935,439035,439
2006total984,4242006-121,019,1452006-04984,42434,721034,721
2007spr688,6022007-03696,9412007-12696,9418,3398,3390
2007commercial268,3932007-12336,9532007-06268,39368,560068,560
2007total965,3342007-121,027,2232007-06965,33461,889061,889
2008spr698,3492008-01707,2152008-07701,8238,8663,4745,392
2008commercial277,8482008-07308,2452008-12308,24530,39730,3970
2008total977,0762008-011,010,0682008-121,010,06832,99232,9920
2009spr703,7862009-01726,6162009-12726,61622,83022,8300
2009commercial307,1402009-12352,1712009-04307,14045,031045,031
2009total1,033,7562009-121,070,9572009-041,033,75637,201037,201
2010spr726,5132010-09726,6122010-01726,545993267
2010commercial312,0822010-12346,8302010-10312,08234,748034,748
2010total1,038,6272010-121,073,3802010-101,038,62734,753034,753
2011spr695,9512011-09;2011-10;2011-11;2011-12726,5432011-01695,95130,592030,592
2011commercial308,2212011-12346,0722011-05308,22137,851037,851
2011total1,004,1722011-121,072,6142011-051,004,17268,442068,442
2012spr694,9522012-09;2012-10;2012-11695,9512012-01;2012-02;2012-03;2012-04;2012-05;2012-06695,268999316683
2012commercial317,8822012-01363,7592012-05337,79645,87719,91425,963
2012total1,013,8332012-011,059,7102012-051,033,06445,87719,23126,646
2013spr695,8052013-01695,9692013-02;2013-03;2013-04;2013-05;2013-06;2013-07;2013-08;2013-09;2013-10;2013-11;2013-12695,9691641640
2013commercial327,1912013-12367,5552013-04327,19140,364040,364
2013total1,023,1602013-121,063,5242013-041,023,16040,364040,364
2014spr690,9592014-12695,9692014-01;2014-02690,9595,01005,010
2014commercial331,0762014-08365,4602014-05360,86534,38429,7894,595
2014total1,022,0482014-081,058,6542014-041,051,82436,60629,7766,830
2015spr690,9472015-04695,1342015-07695,1194,1874,17215
2015commercial389,2132015-01455,9942015-11449,22066,78160,0076,774
2015total1,080,1692015-011,151,1172015-111,144,33970,94864,1706,778
2016spr695,0822016-12695,1162016-01695,08234034
2016commercial471,5372016-09511,8612016-05484,62240,32413,08527,239
2016total1,166,6272016-091,206,9652016-051,179,70440,33813,07727,261
2017spr661,2782017-11695,0782017-01662,83133,8001,55332,247
2017commercial421,6462017-12538,5952017-03421,646116,9490116,949
2017total1,084,4772017-121,230,1052017-031,084,477145,6280145,628
2018spr649,1392018-12665,4582018-02649,13916,319016,319
2018commercial407,5832018-08449,3792018-11442,50141,79634,9186,878
2018total1,067,5942018-081,100,5442018-041,091,64032,95024,0468,904
2019spr634,9672019-11;2019-12649,1392019-01634,96714,172014,172
2019commercial425,6142019-09481,1252019-05432,77255,5117,15848,353
2019total1,067,7392019-121,125,9432019-051,067,73958,204058,204
2020spr634,9672020-01;2020-02;2020-03656,1402020-07638,08621,1733,11918,054
2020commercial440,2532020-01532,6572020-06485,47192,40445,21847,186
2020total1,075,2202020-011,188,6802020-061,123,557113,46048,33765,123
2021spr593,6822021-12638,0852021-01593,68244,403044,403
2021commercial420,3432021-09502,4642021-03421,18482,12184181,280
2021total1,014,8662021-121,140,2382021-031,014,866125,3720125,372
2022spr372,0302022-12588,3172022-01372,030216,2870216,287
2022commercial408,5262022-02439,6782022-10430,10231,15221,5769,576
2022total802,1322022-121,002,0312022-01802,132199,8990199,899
2023spr347,1582023-06371,5792023-01;2023-02354,68424,4217,52616,895
2023commercial417,3012023-08472,3692023-02426,49155,0689,19045,878
2023total767,6312023-08843,9482023-02781,17576,31713,54462,773
2024spr358,0132024-01393,5682024-12393,56835,55535,5550
2024commercial413,3802024-12464,6002024-04413,38051,220051,220
2024total786,1682024-01831,5172024-04806,94845,34920,78024,569
2025spr395,0642025-01413,4642025-12413,46418,40018,4000
2025commercial407,7642025-09435,4302025-04411,17127,6663,40724,259
2025total814,0852025-01834,5512025-04824,63520,46610,5509,916

Download the same complete table (CSV)

Data and downloads

Read the tables directly or download the research. No form or account is required.

Reproducible research bundle (ZIP) · Research reference (PDF) · Full data dictionary · Calculation program (Python)

Comparison snapshots (CSV)

Consecutive month stock changes (CSV)

December year end stocks (CSV)

Fixed panel summary (CSV)

Joint stock direction frequencies (CSV)

Largest monthly stock changes (CSV)

Latest observed versus december (CSV)

Matched december annual changes (CSV)

Monthly stocks 2005 2025 (CSV)

Recent observed months 2026 (CSV)

Within year month end extremes (CSV)

Cite this page

Each figure on this page links to the study it came from. If you quote one, link to this page or to that study.

American Mineral Registry. "U.S. Strategic Petroleum Reserve and Commercial Crude Stocks." American Mineral Registry, November 2026. https://americanmineralregistry.com/research/us-strategic-petroleum-reserve-commercial-crude-stocks-statistics/
<a href="https://americanmineralregistry.com/research/us-strategic-petroleum-reserve-commercial-crude-stocks-statistics/">Strategic and Commercial Crude Stocks</a> (American Mineral Registry, November 2026)