Key takeaways
- Henry Hub moved 8.3% in a typical month versus 5.6% for WTI in the matched historical series. Typical means the median absolute month-to-month percentage change across 347 paired changes from February 1997 through December 2025, calculated from EIA monthly spot-price averages.
- Henry Hub changed at least 10% in 140 of 347 months, compared with 79 for WTI. This counts increases and decreases from one monthly average to the next between February 1997 and December 2025. The exact threshold is applied before rounding.
- Henry Hub's absolute move exceeded WTI's in 216 of 347 matched transitions. The comparison uses percentage changes on both series rather than comparing their different dollar units.

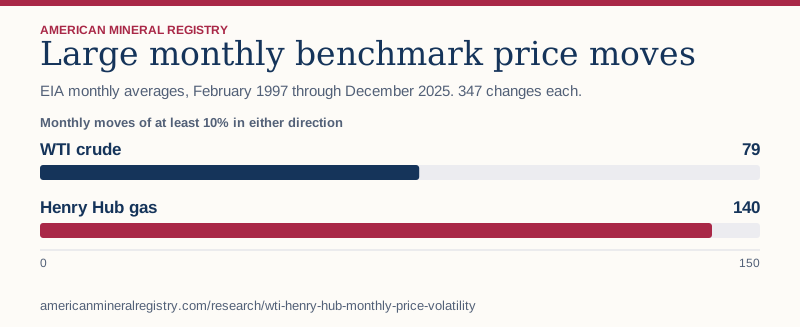
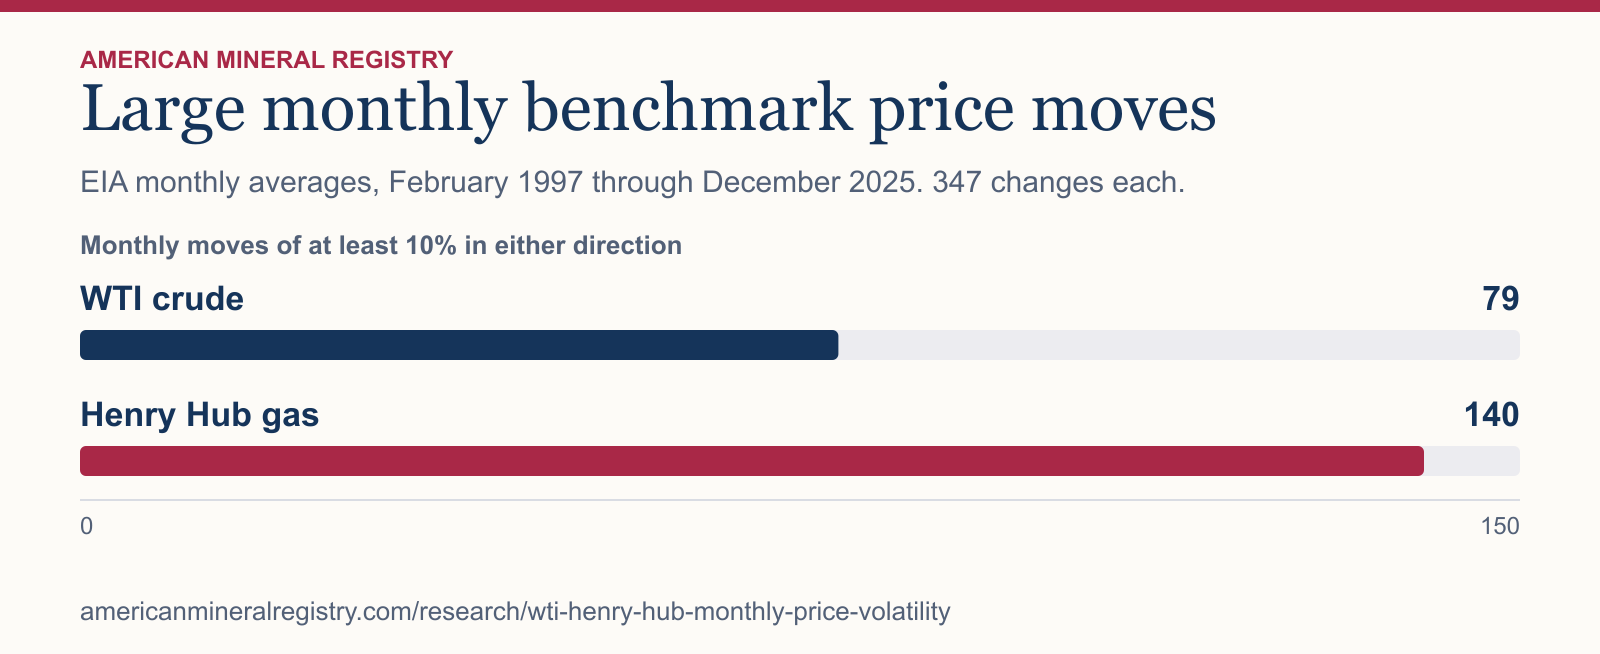
Figure 1 in text
EIA monthly averages, February 1997 through December 2025. 347 changes each. Monthly moves of at least 10% in either direction.
| Category | Monthly moves of at least 10% in either direction |
|---|---|
| WTI crude | 79 |
| Henry Hub gas | 140 |
Chart wording and scale
Large monthly benchmark price moves EIA monthly averages, February 1997 through December 2025. 347 changes each.
Monthly moves of at least 10% in either direction
WTI crude
79
Henry Hub gas
140 0 150
Source and data: Download chart source data
Permanent link to this figure’s text and data · Sources and context
How often did oil or gas prices move by 10%?
From February 1997 through December 2025, Henry Hub moved at least 10% in 140 months and WTI did so in 79 of the same 347 months. A 10% decrease counts the same as a 10% increase in this measure of movement.
| Measure | WTI crude oil | Henry Hub natural gas |
|---|---|---|
| Median absolute monthly change | 5.6% | 8.3% |
| Changes of at least 10% in either direction | 79 of 347 | 140 of 347 |
| Changes of at least 20% in either direction | 12 of 347 | 48 of 347 |
| Largest absolute change | 72.6% increase in May 2020 | 97.4% increase in February 2021 |
What did the largest moves look like?
WTI rose from $16.55 per barrel in April 2020 to $28.56 in May, a 72.6% rise from a low starting price. Henry Hub rose from $2.71 per MMBtu in January 2021 to $5.35 in February, a 97.4% increase. Both comparisons use monthly averages. A large increase can depend heavily on the previous month's level.
Can benchmark price changes tell me how much a royalty check will move?
A benchmark price comparison describes the underlying market, while an individual check reflects the realized sales price, volume, ownership share and any applicable adjustments. The monthly spot benchmark can help explain why comparing check amounts across periods requires more than comparing two dollar totals.
How did AMR match and calculate the series?
The first paired price month is January 1997 and the final one is December 2025, the last complete calendar year in this edition. For each later month, divide the change in monthly average by the previous month's average and multiply by 100. Take the absolute value for the median and threshold counts. The first month has no transition in this download, so the change cells are blank.
Sources and data
Download the data (CSV) · Read the data dictionary. The AMR analysis and figures are licensed CC BY 4.0. Refer to the original issuers for their materials.