This reference reconciles the equipment, metal and dollar denominators. AMR’s contribution is an auditable comparison of the source’s estimates, with original calculations, complete HTML tables and matching downloads. The evidence year is 2022; the source is the second edition of the 2024 report. The November 2026 page date records this compilation and verification, rather than implying a new measurement of current e-waste.
Key Takeaways
- Half the reported equipment mass was metal. AMR calculates 31 / 62 = 50%, using the report’s rounded global 2022 estimates.
- Equipment input and metal output use different boundaries. The formal route handled 13.8 billion kg of e-waste and recovered approximately 6 billion kg of metals.
- Copper, iron and gold together account for USD 50 billion of contained value. AMR calculates about 54.95% of the reported USD 91 billion total.
- Recovered mass and recovered value give different shares. AMR calculates about 61.29% of contained metal mass and 30.77% of contained metal value from the report’s rounded global estimates.
- Undocumented formal collection does not mean landfill. The source distinguishes residual waste and two collection routes outside formal systems.
- The USD 91 billion headline is gross contained value. Collection, separation, recovery losses, treatment and environmental costs change the economic question.
- The report’s USD 37 billion net cost is a societal assessment. It includes monetized environmental benefits and externalized health and environmental costs.
- All calculations retain the original period and precision limits. Rounded route components are not adjusted to force agreement with published totals.
How much metal is contained in electronic waste?
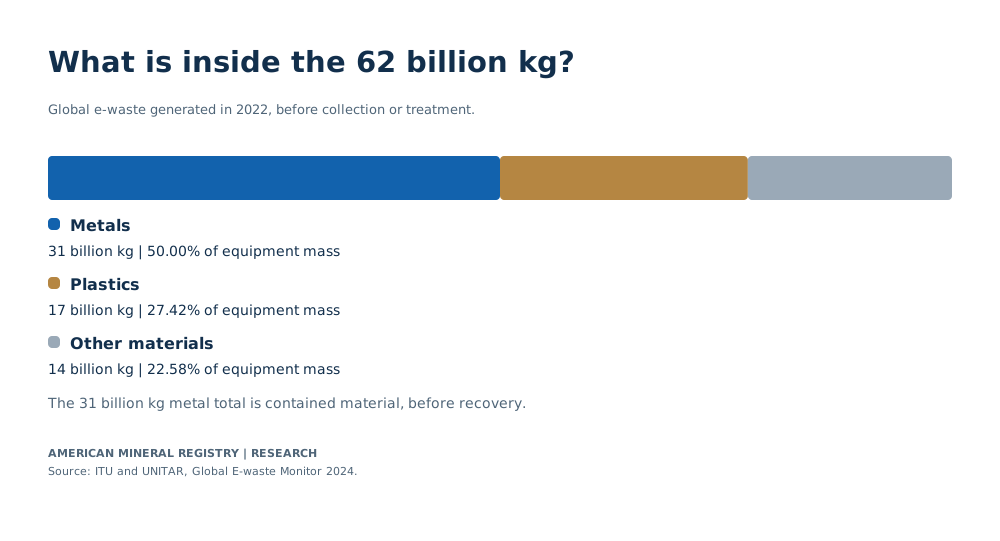
The report estimates that global 2022 e-waste contained 31 billion kg of metals within 62 billion kg of discarded equipment. AMR calculates a 50% metal share of that rounded equipment total. Plastics and other materials make up the remainder. Global E-waste Monitor 2024, pages 13 and 46.

View chart data
Global e-waste generated in 2022, before collection or treatment.
| Material group | Contained mass (billion kg) | AMR share (%) |
|---|---|---|
| Metals | 31 | 50.0000 |
| Plastics | 17 | 27.4194 |
| Other materials | 14 | 22.5806 |
Source estimates are rounded. AMR calculations preserve their stated denominators.
All essential figures appear in the article HTML tables.
ITU and UNITAR, Global E-waste Monitor 2024, pages 13 and 46 Global E-waste Monitor 2024, second edition; Printed pages 13 and 46
| Material group | Contained mass in 2022 (billion kg) | AMR share of 62 billion kg (%) | Boundary |
|---|---|---|---|
| Metals | 31 | 50.0000 | Contained metal mass before management |
| Plastics | 17 | 27.4194 | Material content before management |
| Other materials | 14 | 22.5806 | Includes minerals, glass and composite materials; not all constituents individually quantified |
The distinction between equipment and metal is essential. A discarded refrigerator includes metals, plastics and other components. Its equipment weight enters the e-waste generation total, while the metal contained in it enters the metal-content estimate. A tonne delivered to a recycling facility does not become a tonne of secondary metal. The comparison must account for what the incoming equipment contains and what the process ultimately recovers.
The source identifies iron and steel as the largest metal component, at approximately 24 billion kg. Its prose gives aluminium at 3.9 billion kg and copper at 2.1 billion kg. The selected comparison below uses those prose values consistently. AMR divides each by the same 31 billion kg contained-metal total; the shares describe metal mass, rather than a share of the entire e-waste stream. These are selected abundant metals, with the remaining metal constituents outside this table. Global E-waste Monitor 2024, page 46, composition discussion.
| Selected metal | Contained mass in 2022 (billion kg) | AMR share of 31 billion kg metal total (%) | Precision |
|---|---|---|---|
| Iron and steel | 24 | 77.4194 | Approximately; source prose |
| Aluminium | 3.9 | 12.5806 | Source prose |
| Copper | 2.1 | 6.7742 | Source prose; chart uses coarser rounding |
This composition explains why “valuable electronics” can mean different things. A material can dominate the mass without dominating the dollar value. Conversely, a precious metal can have a small mass and a substantial commodity value. Adding metal kilograms to dollar values would erase that distinction. A meaningful comparison states which property matters: material quantity, contained value, viable recovery or safely managed equipment.
These global estimates also provide no assay for an individual phone, circuit board, cable batch or appliance. The report’s material model links equipment categories to composition data and then assesses recovery by management route and component. Annex 1 describes printed circuit boards, cables and other components as separate inputs to that assessment. A recycler evaluating a particular consignment would need information about that actual feedstock, rather than applying the global metal share as a guaranteed grade. Global E-waste Monitor 2024, Annex 1, pages 111 and 113.
The source’s “other materials” category also deserves its full label. It includes materials such as glass, minerals and composites, and the report notes that not all constituents could be properly quantified individually. It should remain a material category, rather than being renamed worthless waste. This article reports the source’s aggregate; it does not assign an invented market value or recovery rate to that remainder.
Where does e-waste go after it is discarded?
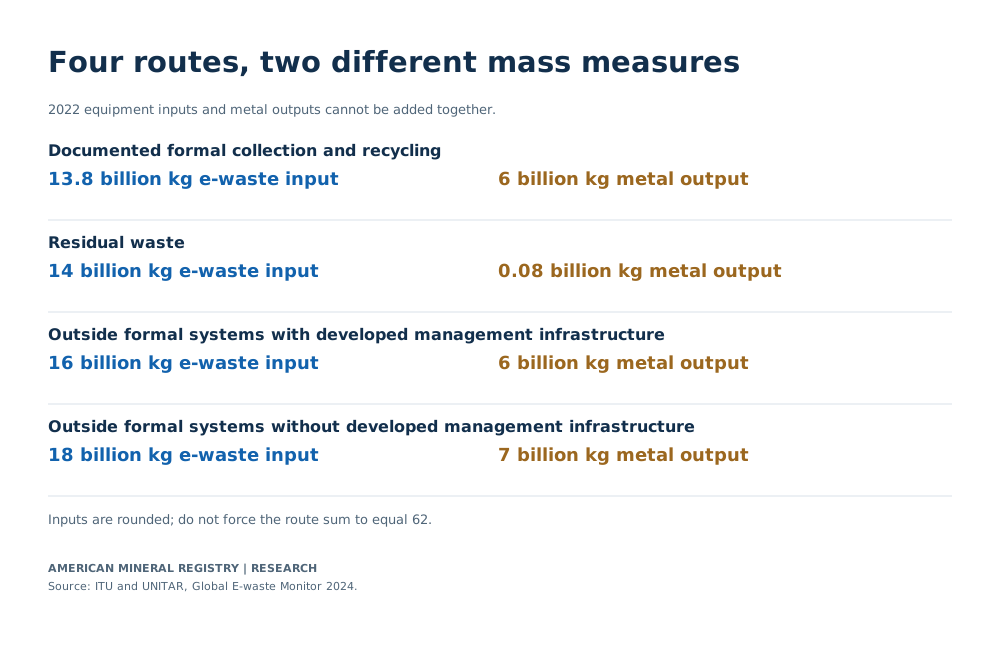
Documented formal collection accounted for 22.3% of global e-waste generated in 2022, while other routes included residual waste and collection outside formal systems. The report estimates material recovery in several routes, including routes with inadequate environmental controls. Global E-waste Monitor 2024, pages 12 to 13 and 31 to 37.

View chart data
2022 equipment inputs and metal outputs cannot be added together.
| Management route | E-waste input (billion kg) | Viable recovered metal output (billion kg) |
|---|---|---|
| Documented formal collection and recycling | 13.8 | 6 |
| Residual waste | 14 | 0.08 |
| Outside formal systems with developed management infrastructure | 16 | 6 |
| Outside formal systems without developed management infrastructure | 18 | 7 |
Source estimates are rounded. AMR calculations preserve their stated denominators.
All essential figures appear in the article HTML tables.
ITU and UNITAR, Global E-waste Monitor 2024, pages 13, 31 and 35 to 37 Global E-waste Monitor 2024, second edition; Printed pages 13, 31 and 35 to 37
| Management route | 2022 e-waste input (billion kg) | 2022 viable recovered metal (billion kg) | Definition and qualification |
|---|---|---|---|
| Documented formal collection and recycling | 13.8 | 6 | Environmentally sound management; input is equipment mass and output is metal mass |
| Residual waste | 14 | 0.08 | Mixed household waste; disposal includes landfilling and incineration |
| Outside formal systems with developed management infrastructure | 16 | 6 | Mostly high-income and upper-middle-income countries; not equivalent to compliant treatment |
| Outside formal systems without developed management infrastructure | 18 | 7 | Mostly low-income and lower-middle-income countries; predominantly informal management |
The formal route covers e-waste documented as separately collected and managed through formal systems. The source describes retailers, municipal collection points and pickup services feeding specialized treatment facilities. Valuable materials are recovered and hazardous fractions receive controlled treatment. Its 13.8 billion kg equipment input is associated with approximately 6 billion kg of recovered metals. The difference between those quantities contains both the nonmetal parts of equipment and other treatment outcomes; it cannot all be labeled lost metal. Global E-waste Monitor 2024, page 31 and Annex 1, page 110.
Residual waste is a distinct route. The report estimates 14 billion kg of e-waste entered normal waste bins alongside household waste. Treatment depends on the waste-management system and includes landfilling or incineration. The source also estimates limited recovery of metals, including recovery from incinerator bottom ash. Its 80 million kg recovered-metal estimate is represented as 0.08 billion kg in AMR’s common-unit table. This does not imply that residual disposal provides adequate e-waste treatment. It identifies a small material output within an otherwise different disposal boundary. Global E-waste Monitor 2024, page 35.
The other routes describe collection outside formal systems in countries with and without developed e-waste management infrastructure. Dealers and waste companies can extract marketable materials without performing the full depollution and environmental controls associated with compliant management. Informal workers can also dismantle equipment and recover valuable fractions. Material re-entering the economy therefore establishes a material-recovery outcome, while leaving questions about hazardous releases and worker protection. Global E-waste Monitor 2024, pages 36 to 37.
Subtracting the published 22.3% formal indicator from 100% gives a 77.7 percentage-point remainder outside that indicator. The subtraction says nothing by itself about how the remainder is divided among landfill, incineration, informal recycling and other collection. The route definitions supply that missing information. A headline assigning the entire remainder to landfill would change the source’s meaning.
The route estimates also illustrate normal rounding limits. Their displayed equipment inputs sum to 61.8 billion kg, compared with the rounded global total of 62 billion kg. Their displayed recovered-metal outputs sum to 19.08 billion kg, compared with the rounded global recovered-metal total of 19 billion kg. AMR preserves both the published aggregate and the displayed route estimates. No route is silently enlarged or reduced to make the chart balance. This is an approximate global model, rather than a shipment ledger.
What does the USD 91 billion e-waste value mean?
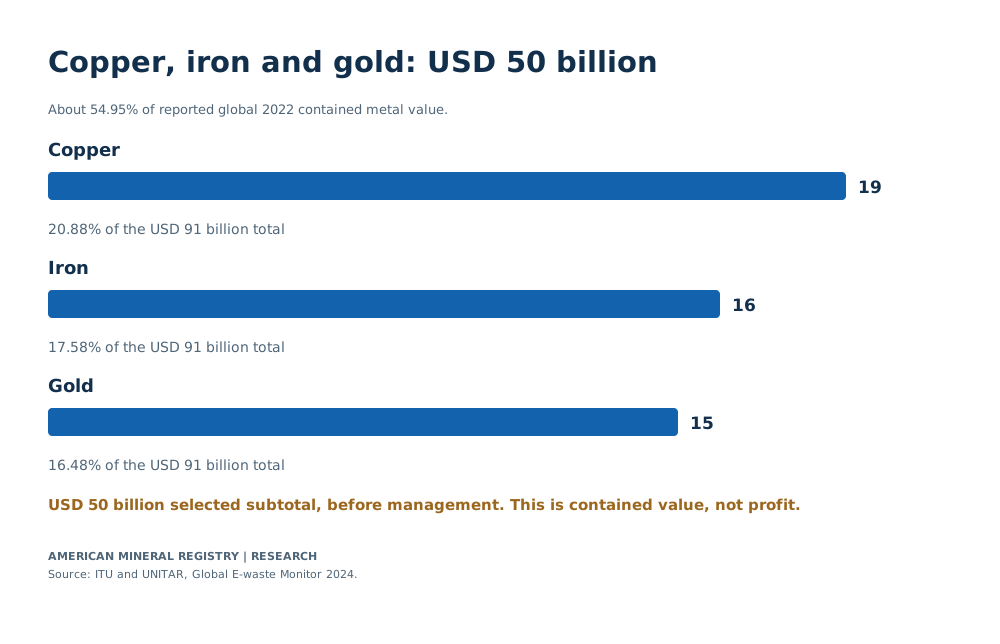
USD 91 billion is the estimated gross commodity value of metals contained in global e-waste generated in 2022, before management. Copper, iron and gold contribute reported values of USD 19 billion, USD 16 billion and USD 15 billion respectively. AMR sums them to USD 50 billion, about 54.95% of the rounded total. Global E-waste Monitor 2024, page 54.

View chart data
About 54.95% of reported global 2022 contained metal value.
| Metal | Contained value (USD billion) | AMR share of USD 91 billion (%) |
|---|---|---|
| Copper | 19 | 20.8791 |
| Iron | 16 | 17.5824 |
| Gold | 15 | 16.4835 |
Source estimates are rounded. AMR calculations preserve their stated denominators.
All essential figures appear in the article HTML tables.
ITU and UNITAR, Global E-waste Monitor 2024, page 54, Figure 22 and accompanying discussion Global E-waste Monitor 2024, second edition; Printed page 54, Figure 22 and prose
| Selected metal | Contained metal value in 2022 (USD billion) | AMR share of reported USD 91 billion total (%) | Value boundary |
|---|---|---|---|
| Copper | 19 | 20.8791 | Gross contained metal value before management |
| Iron | 16 | 17.5824 | Gross contained metal value before management |
| Gold | 15 | 16.4835 | Gross contained metal value before management |
The contribution here is deliberately bounded. It compares three explicitly named metal values with the report’s aggregate and provides the calculation. It does not reconstruct the entire source chart or invent values for omitted metals. The combined share is (19 + 16 + 15) / 91 × 100 = 54.9451%, using the displayed source values. Extra decimal places make the calculation reproducible; they do not make the underlying estimates more precise.
The valuation method matters as much as the number. Annex 1 says the assessment multiplies metal quantities by commodity prices obtained from the World Bank commodity-price database and multiple online sources. The economic assessment also includes currency conversion and inflation assumptions for its wider calculations. This reference retains the report’s 2022 assessment boundary. It does not reprice the material at November 2026 spot prices or claim that every metal uses an independently verified common daily quotation. Global E-waste Monitor 2024, Annex 1, pages 111 and 115.
Gross contained value sits early in the chain. Equipment must be collected, relevant components separated, materials processed and resulting fractions brought to a usable product specification. Some material is lost; some recovery is technically or economically unviable under the conditions assessed. A contained-metal valuation therefore answers what the metal represents on the source’s commodity basis. It does not specify the amount that a collector could invoice for mixed equipment or the margin that an operator could retain.
The same distinction prevents a misleading “profit lost” calculation. Subtracting recovered metal value from contained value can describe the gap between those two modeled gross values. Treating that gap as available profit assumes that all remaining metal could be collected and recovered without additional costs or losses. The report supplies neither such an assumption nor a business plan establishing it. Its own assessment includes treatment expenses and wider environmental costs.
Nor should a historical dollar comparison automatically become a material-volume comparison. Commodity prices can change alongside waste quantities and composition. The source itself explains that changes in prices and e-waste generation contribute to the change from its earlier valuation. A larger dollar figure alone cannot establish that the same percentage more metal was discarded. Use the mass table for a material-quantity question and the valuation table for the assessed economic content. Global E-waste Monitor 2024, page 54, footnote vii.
How much metal is recovered, by mass and by value?
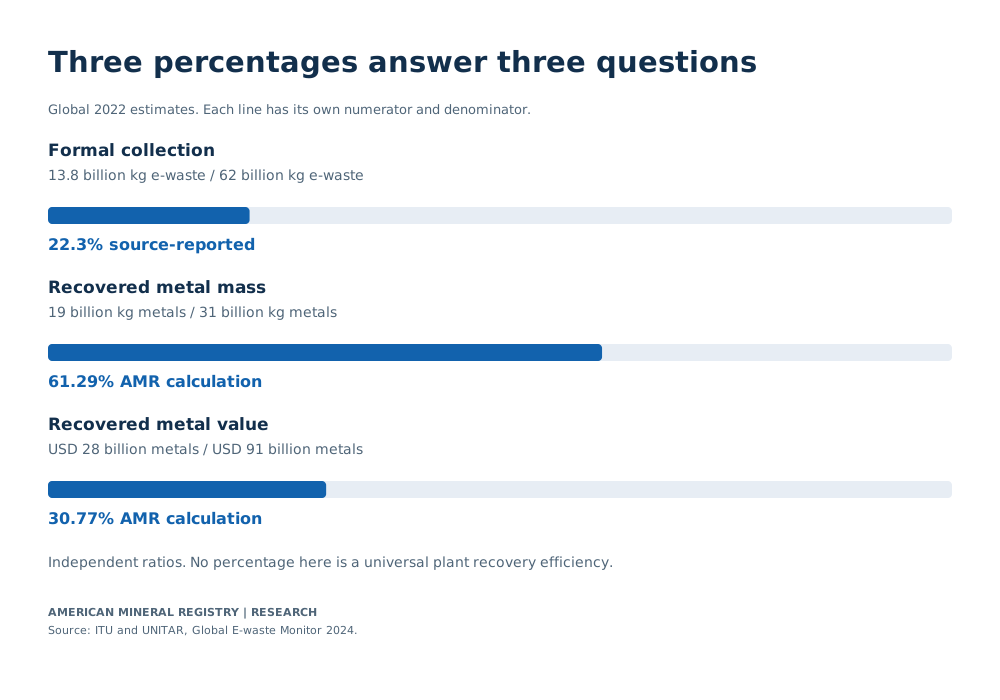
The source estimates 19 billion kg of viable recovered metals and USD 28 billion of viable recovered metal value across all global management routes in 2022. AMR calculates those as about 61.29% of contained metal mass and 30.77% of contained metal value. Both ratios use different denominators from the published 22.3% formal collection indicator. Global E-waste Monitor 2024, pages 27, 46 and 55.

View chart data
Global 2022 estimates. Each line has its own numerator and denominator.
| Indicator | Numerator | Denominator | Percent and basis |
|---|---|---|---|
| Formal collection | 13.8 billion kg e-waste | 62 billion kg e-waste | 22.3% source-reported |
| Recovered metal mass | 19 billion kg metals | 31 billion kg metals | 61.29% AMR calculation |
| Recovered metal value | USD 28 billion metals | USD 91 billion metals | 30.77% AMR calculation |
Source estimates are rounded. AMR calculations preserve their stated denominators.
All essential figures appear in the article HTML tables.
ITU and UNITAR, Global E-waste Monitor 2024, pages 12, 30, 46, 54 and 55 Global E-waste Monitor 2024, second edition; Printed pages 12, 30, 46, 54 and 55
| Indicator | Numerator | Denominator | AMR calculation from rounded inputs (%) | Reported rate or total | Scope and limit |
|---|---|---|---|---|---|
| Documented formal e-waste collection and recycling | 13.8 billion kg e-waste input | 62 billion kg e-waste generated | 22.2581 | 22.3% published rate | Equipment mass; use published 22.3% for the source indicator |
| Viable metal recovery by mass | 19 billion kg recovered metals | 31 billion kg contained metals | 61.2903 | 19 billion kg recovered metals | All management routes; global modeled aggregate, not an individual metal or plant efficiency |
| Viable metal recovery by value | USD 28 billion recovered metals | USD 91 billion contained metals | 30.7692 | USD 28 billion recovered metal value | All management routes; source valuation basis, not business profit |
“Viable recovery” has a specific source meaning. The report defines it as resources currently recovered as secondary resources. Its model separates that outcome from resources lost during e-waste management. Annex 1 describes recovery-effectiveness inputs from literature, stakeholder information and expert judgment across equipment categories, components and management routes. These are global modeled estimates, rather than direct measurements of every facility. Global E-waste Monitor 2024, page 27 and Annex 1, pages 111 and 113.
A larger mass share than value share is consistent with the report’s description of metal composition and recovery. Iron and steel dominate the mass, while much smaller quantities of precious metals contribute substantial value. A mass-weighted aggregate and a price-weighted aggregate therefore need not move together. This comparison establishes the difference between the metrics; it does not identify the recovery rate of gold, copper or any other individual metal. The aggregate inputs cannot be used to fill missing element-specific observations.
The formal collection indicator has another purpose. It divides e-waste formally collected and managed by e-waste generated. AMR’s calculation from the displayed 13.8 and 62 billion kg inputs gives 22.2581%; the source publishes 22.3%. The minor difference follows from rounding. Quote the source’s 22.3% for that indicator and retain AMR’s recomputation only as an audit of the displayed numbers. Replacing the published rate with a more precise-looking ratio would overstate what the displayed inputs support. Global E-waste Monitor 2024, page 30 and Annex 1, page 110.
The dollar recovery total also extends beyond the formal route. The source assigns approximately USD 9 billion to documented formal schemes, USD 12 billion to the informal sector in low-income and lower-middle-income countries, USD 7 billion to recovery outside compliant schemes in high-income and upper-middle-income countries, and around USD 0.5 billion to residual-waste recovery. Those displayed estimates add to USD 28.5 billion; the report publishes an all-route total of USD 28 billion. The following table retains that discrepancy transparently as source rounding. Global E-waste Monitor 2024, page 55.
| Recovery route | Recovered metal value in 2022 (USD billion) | Qualification |
|---|---|---|
| Documented formal schemes | 9 | Source-rounded estimate |
| Informal sector in low-income and lower-middle-income countries | 12 | Source-rounded estimate; material recovery does not establish safe treatment |
| Outside compliant schemes in high-income and upper-middle-income countries | 7 | Source-rounded estimate |
| Residual waste in high-income and upper-middle-income countries | 0.5 | Approximate; selected metals recovered from incinerator bottom ash |
| Published all-route total | 28 | Use published total; displayed route estimates sum to 28.5 due to rounding |
A high recovery percentage achieved at a suitable final treatment facility would answer a narrower engineering question. The report describes the importance of separate pretreatment and suitable smelter feed. Global recovery also depends on whether equipment reaches that process and which components are separated beforehand. A process result cannot substitute for the global collection indicator, and a global average cannot establish the efficiency of a specific process. Global E-waste Monitor 2024, page 47.
Why does recovered metal value coexist with a net economic cost?
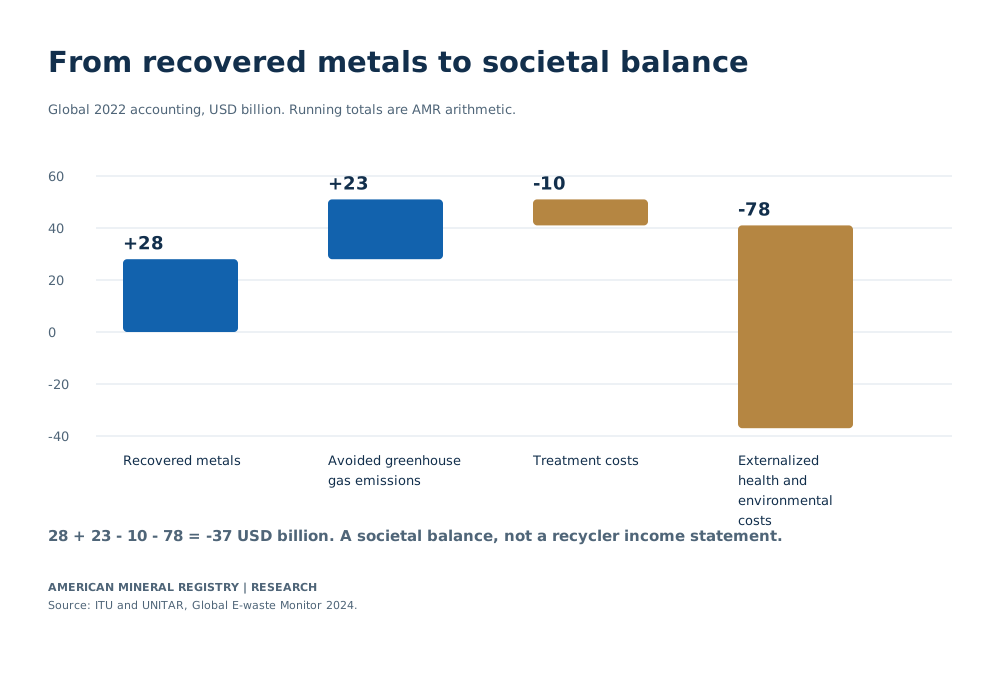
The report’s 2022 societal accounting combines USD 28 billion of recovered-metal benefits and USD 23 billion of avoided-emissions benefits with USD 10 billion of treatment costs and USD 78 billion of externalized costs. AMR reproduces the displayed arithmetic: 28 + 23 − 10 − 78 = −37 billion US dollars. Global E-waste Monitor 2024, pages 55 to 56.

View chart data
Global 2022 accounting, USD billion. Running totals are AMR arithmetic.
| Component | Signed value (USD billion) | Running balance (USD billion) |
|---|---|---|
| Recovered metals | 28 | 28 |
| Avoided greenhouse gas emissions | 23 | 51 |
| Treatment costs | -10 | 41 |
| Externalized health and environmental costs | -78 | -37 |
Source estimates are rounded. AMR calculations preserve their stated denominators.
All essential figures appear in the article HTML tables.
ITU and UNITAR, Global E-waste Monitor 2024, pages 55 to 56 Global E-waste Monitor 2024, second edition; Printed pages 55 and 56
| Accounting component | 2022 signed value (USD billion) | AMR running balance (USD billion) | Interpretation |
|---|---|---|---|
| Recovered metals | 28 | 28 | Economic benefit; not profit |
| Avoided greenhouse gas emissions | 23 | 51 | Monetized societal benefit; not sale revenue |
| Treatment costs | -10 | 41 | Estimated assessed treatment costs; some collection costs excluded |
| Externalized health and environmental costs | -78 | -37 | Estimated societal costs, not all paid by a recycler |
This accounting uses a wider boundary than metal sales. The avoided-emissions component monetizes modeled environmental benefits. Externalized costs represent harm that arises outside the usual treatment price, including consequences for health and the environment. Combining those categories with recovered-metal value produces a societal assessment. An operator’s revenue, expenses, financing and profit would require its own financial records and commercial assumptions. The two exercises can be related without being interchangeable.
The externalized-cost assessment includes greenhouse gases, mercury, plastic releases and lead. The report explains that other effects, including some hazardous materials and informal treatment techniques, could not be quantified. Its aggregate is therefore an assessment of the specified effects under its method, rather than a complete measurement of every possible consequence. The values also vary by region. A global total provides context; it does not establish the damage attributable to a named facility or an individual consignment. Global E-waste Monitor 2024, page 55.
Cost coverage is similarly important. The source’s treatment-cost total excludes some separate collection costs at municipalities or retailers. Annex 1 describes heterogeneous cost evidence, including studies from particular regions and internal datasets. That is adequate reason to preserve the source’s assessed boundary and qualifications. It is not a basis for presenting a universal treatment tariff, a fully loaded price per device or a margin that any operator should expect. Global E-waste Monitor 2024, page 56, footnote viii, and Annex 1, page 115.
The waterfall deliberately begins with recovered metals rather than gross contained value. Adding the USD 91 billion contained total to the USD 28 billion recovered value would count material content and an outcome of managing that content as if they were independent benefits. The report’s societal equation instead uses viable recovered value. AMR follows that boundary and keeps the gross contained-metal comparison in its own table.
For a writer, the practical choice follows the question. Use contained value when describing the economic content assessed in discarded equipment. Use recovered value when describing the modeled secondary-material output. Use the societal balance when discussing the assessed combination of material recovery, environmental benefits, treatment and external effects. Keep the accounting boundary in the sentence so that a reader does not need to infer which meaning of “value” was intended.
Is e-waste generation growing faster than formal collection?
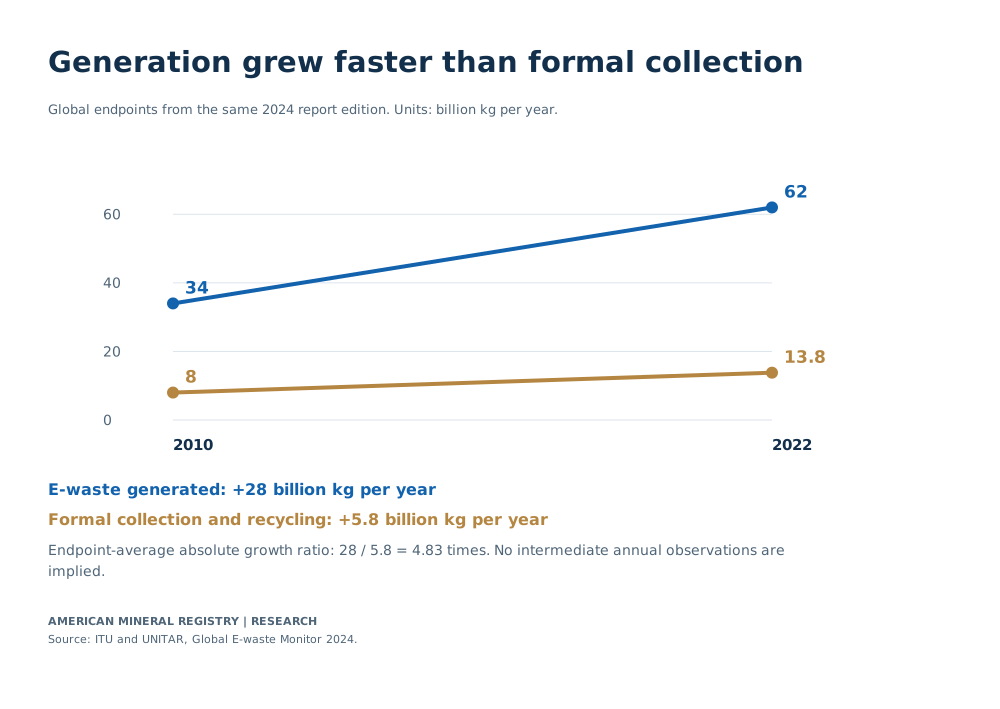
Within the same 2024 report edition, global annual e-waste generation increased from 34 billion kg in 2010 to 62 billion kg in 2022, while documented formal collection and recycling increased from 8 billion kg to 13.8 billion kg. AMR calculates absolute endpoint increases of 28 and 5.8 billion kg per year respectively, a growth-in-increments ratio of about 4.83. Global E-waste Monitor 2024, pages 12 and 28.

View chart data
Global endpoints from the same 2024 report edition. Units: billion kg per year.
| Measure | 2010 | 2022 | AMR increase |
|---|---|---|---|
| E-waste generated | 34 | 62 | 28 |
| Formal collection and recycling | 8 | 13.8 | 5.8 |
Source estimates are rounded. AMR calculations preserve their stated denominators.
All essential figures appear in the article HTML tables.
ITU and UNITAR, Global E-waste Monitor 2024, pages 12 and 28 Global E-waste Monitor 2024, second edition; Printed pages 12 and 28
| Year | E-waste generated (billion kg per year) | Documented formal collection and recycling (billion kg per year) | Source edition |
|---|---|---|---|
| 2010 | 34 | 8 | Global E-waste Monitor 2024 second edition |
| 2022 | 62 | 13.8 | Global E-waste Monitor 2024 second edition |
| Measure | 2010 input | 2022 input | AMR absolute increase (billion kg per year) | Elapsed years | AMR annual average increase (billion kg per year added each year) |
|---|---|---|---|---|---|
| E-waste generated | 34 | 62 | 28 | 12 | 2.333333 |
| Documented formal collection and recycling | 8 | 13.8 | 5.8 | 12 | 0.483333 |
The word “faster” needs a defined calculation. Here AMR compares the additions to annual quantities over the same elapsed period: (62 − 34) / (13.8 − 8) = 28 / 5.8 = 4.8276. Dividing each addition by the same 12 years gives average annual increases of approximately 2.3333 and 0.4833 billion kg per year added each year. Their ratio is unchanged. This is an endpoint-average comparison, not a compound annual growth-rate ratio and not an assertion that every individual year followed the same path.
The distinction between an annual flow and its change also matters. The 2022 generation figure is the amount generated during that year. The 28 billion kg increase compares the size of that annual flow with its 2010 counterpart. It is not a cumulative stock of e-waste discarded over the full period. Summing the two endpoints would not calculate the period’s total discarded equipment either; that would require the complete annual series.
Source vintage is another condition of a sound trend. The report notes that previous time series were reconstructed using new country data and revisions. It explicitly warns that collection rates in earlier monitor editions are not directly comparable with this edition’s series. AMR therefore uses the same second edition for both endpoints. A later refresh should first inspect whether a new publication revised the historical series before joining old and new figures into a trend. Global E-waste Monitor 2024, page 28, footnote ii.
The estimates are also built from more than a single waste weigh-in. Annex 1 describes apparent-consumption data and product-lifespan modeling for generation. Formal collection uses official and other available reporting, with extrapolation for unavailable years where country data exist. Outside-formal management routes also contain modeled allocations. Those methods make global comparisons possible, while defining what the results can establish. They should be described as the report’s estimates, rather than a complete direct inventory of every discarded item. Global E-waste Monitor 2024, Annex 1, pages 112 to 113.
How should these statistics be quoted?
A useful sentence names the producer, year, geography, measure and essential qualification together. For example: “ITU and UNITAR estimate that global e-waste generated in 2022 contained USD 91 billion of metals, valued before management; AMR’s compilation distinguishes that from the USD 28 billion recovered-metal value.” The finding controls below provide permanent fragments and the matching CSV for narrower calculations.
| Question | Usable measure | Necessary qualification | Unsupported substitution |
|---|---|---|---|
| How much valuable metal is in e-waste? | USD 91 billion gross contained metal value | Global 2022 estimate using source commodity-price valuation | Profit or immediately collectible recycler revenue |
| How much e-waste is formally collected and recycled? | 22.3% of e-waste generated | Global 2022 equipment-mass indicator | Fraction of every metal recovered |
| How much metal is recovered? | 19 billion kg viable recovered metals | Global 2022 model across all management routes | Documented formal collection alone |
| How much metal value is recovered? | USD 28 billion viable recovered metal value | Global 2022 model across all management routes | Net earnings after costs |
| Where does the undocumented remainder go? | Separate residual-waste and outside-formal-system routes | Source-modeled routes; input estimates are rounded | All undocumented e-waste is landfilled |
| What is the economic balance? | USD 37 billion net societal cost | Assessed benefits less treatment and externalized costs in 2022 | A cash loss on recycler financial accounts |
Frequently asked questions
Does e-waste mean only phones and computers?
The report includes a broader range of electrical and electronic equipment, including household appliances, temperature-exchange equipment, screens, lamps, small equipment and photovoltaic panels. Phone-only claims need phone-specific evidence. The global totals here should retain their full equipment boundary. Global E-waste Monitor 2024, pages 20 to 22 and 29.
Is the global metal share a grade for my recycling batch?
No. The share is a calculation from modeled global aggregates covering different equipment categories. A batch-specific claim requires evidence about the actual equipment, components, sampling and processing boundary. The material table can explain a global waste stream without establishing a commercial assay.
Does 22.3% measure how efficiently a plant recovers copper?
It measures documented formal e-waste collection and management relative to equipment generated. A plant’s copper recovery rate requires copper entering and copper leaving a defined process. The denominator dictionary above keeps these questions separate. Global E-waste Monitor 2024, Annex 1, pages 110 to 111.
Is the recovered value all generated by formal recyclers?
The USD 28 billion total covers all management routes in the report’s model. Its route discussion includes formal schemes, recovery outside compliant schemes, informal management and limited residual-waste recovery. Retain that all-route qualification when quoting the total. Global E-waste Monitor 2024, page 55.
Can the USD 91 billion figure be updated using today’s copper price?
Updating a multi-metal aggregate requires compatible quantities and prices for the included metals, with a clear valuation date and method. Changing one metal price alone would create a partial sensitivity exercise. This reference preserves the source valuation and does not present a new current-price estimate.
Why do component totals sometimes differ from an aggregate?
The source displays rounded inputs, outputs and value estimates. AMR retains those numbers rather than adjusting them to an artificial exact balance. Calculations are reproducible from displayed inputs; the additional arithmetic precision does not remove source uncertainty.
Does recovery establish environmentally sound treatment?
Recovered material is one outcome. The report separately considers depollution, releases, treatment standards and externalized effects. Its outside-formal routes can yield secondary metal while also creating environmental and health costs. Recovery and environmental management should remain separately stated. Global E-waste Monitor 2024, pages 31, 36 to 37 and 55.
Methodology and Sources
AMR inspected the November 2024 second-edition Global E-waste Monitor PDF, produced by ITU and UNITAR, and used the report’s global 2022 assessment as the common reference. The historical comparison uses 2010 and 2022 endpoints from that same edition. No 2026 e-waste generation or metal-recovery observation is inferred from the date of this page.
Source values were transcribed with their units and printed-page locations. The downloadable source-cell ledger records each table cell, its primary source and the relevant qualification. AMR calculations use the displayed rounded inputs: material shares, the selected-metal value subtotal, recovery ratios, the signed societal-accounting bridge and absolute endpoint changes. Percentages are retained to four decimal places in audit tables and described with appropriate rounding in prose. The supplied reproduction program reads the matching CSV inputs and checks those calculations.
The equipment-generation and formal-collection indicators follow the source’s definitions on pages 27 and 110. The mass and value recovery comparisons follow pages 46 and 54 to 55, with the recovery model described on pages 111 and 113. The societal-accounting boundary and exclusions follow pages 55 to 56 and 115. AMR reports source-modeled estimates; it does not independently reproduce the source’s internal modeling inputs, expert judgments or complete price series.
Several safeguards are deliberate. Equipment inputs and metal outputs remain separate columns. Selected metal tables do not claim complete elemental coverage. Reported totals retain their original rounding even where displayed components differ. The 22.3% published formal indicator is preserved alongside its recomputation from rounded inputs. The societal assessment is kept separate from both gross contained value and business profit. The analysis makes no estimate of the value, safety or profitability of an individual device or recycling operation.
Glossary
- E-waste generated. Electrical and electronic products discarded during the reporting year, before collection, reuse, treatment or export under the source’s statistical framework.
- Documented formal collection and recycling. Equipment documented as separately collected and managed through formal systems, divided by generated e-waste for the corresponding rate.
- Contained metal. Metal present in the equipment before the management outcomes considered here.
- Viable recovered metal. Material currently recovered as secondary resources under the report’s model and definitions.
- Contained metal value. A gross commodity-based valuation of the metals present before management.
- Recovered metal value. The assessed value of metals recovered as secondary resources across the stated routes.
- Externalized cost. A modeled cost to health or the environment outside the usual treatment-pricing mechanism.
- Societal balance. The assessment’s recovered-metal and avoided-emissions benefits minus treatment and externalized costs.
- Source vintage. The edition and publication version supplying an estimate, including any revisions to historical observations.
Sources
- Baldé and colleagues, ITU and UNITAR, Global E-waste Monitor 2024, second edition. Primary source for global 2022 mass, management, metal value, recovery, societal accounting and same-edition historical endpoints. Main locations: pages 12 to 13, 27 to 31, 35 to 37, 46 to 47, 54 to 56 and 110 to 115.
- IEA, Recycling of Critical Minerals, executive summary. Context for the distinction between e-waste collection, material recovery and mineral supply. The numerical tables on this page use the monitor directly rather than replacing its values with the IEA’s rounded summary.