AMR's reproducible five-material crosswalk connects those measures to complete reported origin shares, mine production, processing stages and five-year reliance history. It preserves exact material forms, source windows and historical bounds. This is a fixed comparison, rather than a complete critical-minerals census or risk ranking. Every chart has matching HTML evidence, finding links and reusable downloads.
Key Takeaways
- Natural graphite has 100% net import reliance in all five published years,2021 through 2025. (USGS; AMR calculations, May 2026).
- Cobalt’s 2025 net import reliance is 79% under the chapter’s apparent-consumption definition. (USGS; AMR calculations, May 2026).
- Rare-earth compounds and metals have 67% net import reliance in 2025; concentrates are separately net-exported. (USGS; AMR calculations, May 2026).
- Copper’s 2025 net import reliance is 57%, up 13 percentage points from 2021. (USGS; AMR calculations, May 2026).
- Nickel’s headline 2025 reliance is 41% including scrap; USGS says excluding scrap it would be nearly 100%. (USGS; AMR calculations, May 2026).
- Chile supplies 68% of the reported 2021 to 2024 U.S. refined-copper import distribution. (USGS; AMR calculations, May 2026).
- China including Hong Kong supplies 71% of the reported 2021 to 2024 rare-earth compounds and metals import distribution. (USGS; AMR calculations, May 2026).
- Norway is the largest named source of cobalt metal, oxide and salts imports at 26%,2021 to 2024. (USGS; AMR calculations, May 2026).
- Canada supplies 44% of the reported primary-nickel import distribution,2021 to 2024. (USGS; AMR calculations, May 2026).
- AMR sums the three largest named refined-copper import origins at 91% of the reported distribution. (USGS; AMR calculations, May 2026).
- The U.S. share of the report’s rounded 2025 world rare-earth mine total is about 13.08%. (USGS; AMR calculations, May 2026).
- U.S. natural graphite mine output is explicitly reported as zero for 2025. (USGS; AMR calculations, May 2026).
- China’s copper share is about 7.8% of mine output and 48.3% of refinery output using separate rounded 2025 world totals. (USGS; AMR calculations, May 2026).
- Rare-earth compounds and metals reliance rises from 53% in 2024 to 67% in 2025, a 14 percentage-point change. (USGS; AMR calculations, May 2026).
Rare earths: from mining to magnets
Return to the complete five-material comparison · Download the rare-earth expansion
This expanded reference follows rare earths from mine production through compounds, metals and magnet-related project estimates. It keeps the US product basket, immediate import origins, global mining shares and a 2035 IEA scenario separate. AMR calculates source-aligned concentration and growth measures, explains which comparisons cannot establish a processing yield, and preserves the complete existing five-material mineral-import crosswalk below. The purpose is a usable stage map, not an unsupported claim that one mine solves a supply chain.
Key Takeaways
- 51,000 tons REO equivalent was estimated US concentrate output in 2025. (USGS 2026; accessed, Nov 2026).
- 8,900 tons REO equivalent was estimated US compounds and metals production in 2025. (USGS 2026; accessed, Nov 2026).
- 67% net import reliance applies to compounds and metals, not concentrate or finished magnets. (USGS 2026; accessed, Nov 2026).
- The US was a net concentrate exporter across the five years shown in the source. (USGS 2026; accessed, Nov 2026).
- USGS reports 390,000 tons REO equivalent as the rounded world mine total for 2025. (USGS 2026; accessed, Nov 2026).
- China and the US account for about 82.31% of that rounded mine total by AMR calculation. (USGS 2026; accessed, Nov 2026).
- US compounds/metals output more than doubled from 4,300 to 8,900 tons between the 2024 and 2025 source values. (USGS 2026; accessed, Nov 2026).
- Import reliance rose 14 percentage points, from 53% to 67%, over the same source years. (USGS 2026; accessed, Nov 2026).
- China including Hong Kong supplied 71% of reported US compounds/metals imports over 2021 to 2024. (USGS 2026; accessed, Nov 2026).
- Malaysia, Japan and Estonia are trade-source locations, not proof of the original ore’s geographic origin. (USGS 2026; accessed, Nov 2026).
- Nearly 50, under 40 and about 18 kt are different stage estimates in IEA’s 2035 outside-top-refiners base case. (IEA 2026; accessed, Nov 2026).
- Magnet rare earths are a narrower basket than the USGS mine and compounds/metals totals. (IEA 2026, chart notes; accessed, Nov 2026).
Where does rare-earth mine supply come from?
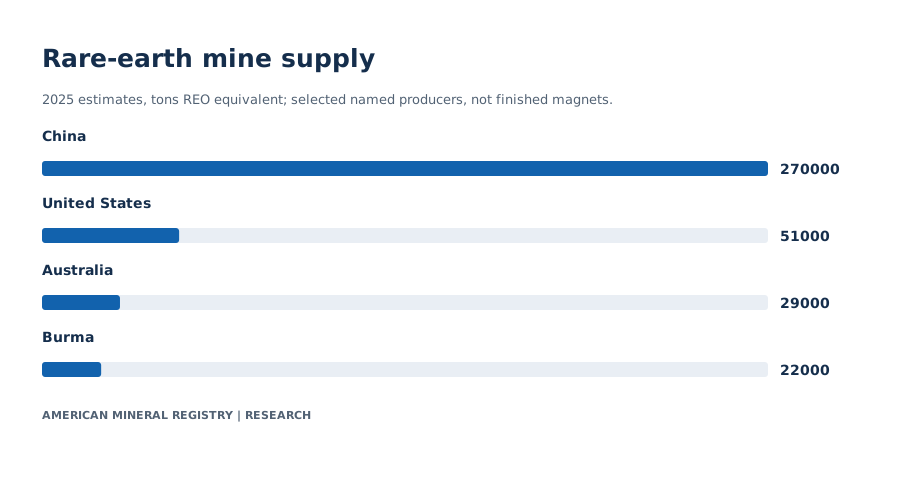
China leads the named producer comparison with 270,000 tons REO equivalent in the USGS 2025 estimates, followed by the United States at 51,000, Australia at 29,000 and Burma at 22,000. AMR retains the other named producers, the residual category and the rounded world total rather than treating a short list as the whole market. (USGS 2026, world table; accessed, Nov 2026).

View chart data
2025 estimates, tons REO equivalent; selected named producers, not finished magnets.
| Country | Tons REO equivalent |
|---|---|
| China | 270000 |
| United States | 51000 |
| Australia | 29000 |
| Burma | 22000 |
Values and definitions are also readable in HTML. Source precision and scope apply.
| Named producer | 2025 rank | 2025 output (tons REO equivalent) | Share of rounded world total (%) |
|---|---|---|---|
| China | 1 | 270000 | 69.2308 |
| United States | 2 | 51000 | 13.0769 |
| Australia | 3 | 29000 | 7.4359 |
| Burma | 4 | 22000 | 5.641 |
| Thailand | 5 | 4800 | 1.2308 |
| India | 6 | 2900 | 0.7436 |
| Madagascar | 7 | 2700 | 0.6923 |
| Russia | 8 | 2600 | 0.6667 |
| Brazil | 9 | 2000 | 0.5128 |
| Nigeria | 10 | 1500 | 0.3846 |
| Vietnam | 11 | 150 | 0.0385 |
| Malaysia | 12 | 110 | 0.0282 |
What does the unit represent?
REO equivalent expresses the rare-earth content on a rare-earth-oxide basis. It is not raw ore tonnage, elemental-metal tonnage or the gross mass of a magnet. The chapter’s coverage includes lanthanides and yttrium and excludes most scandium. The US concentrate row excludes monazite concentrates under its footnote. These scope details matter when a different source reports only neodymium, praseodymium, dysprosium and terbium.
| Geography | 2024 source value (metric tons REO equivalent) | 2025 estimate (metric tons REO equivalent) |
|---|---|---|
| United States | 45500 | 51000 |
| Australia | 29000 | 29000 |
| Brazil | 560 | 2000 |
| Burma | 27000 | 22000 |
| Canada | 0 | 0 |
| China | 270000 | 270000 |
| Greenland | 0 | 0 |
| India | 2900 | 2900 |
| Madagascar | 1400 | 2700 |
| Malaysia | 140 | 110 |
| Nigeria | 1500 | 1500 |
| Russia | 2600 | 2600 |
| South Africa | 0 | 0 |
| Tanzania | 0 | 0 |
| Thailand | 2100 | 4800 |
| Vietnam | 300 | 150 |
| Other | 1000 | 550 |
| World total (rounded) | 380000 | 390000 |
How are the concentration shares calculated?
AMR divides each named producer by the same rounded 390,000-ton world total. China’s share is about 69.2308%, the US share about 13.0769%, and their combined share about 82.3077%. The inputs are source-rounded estimates. Extra decimals make the calculation reproducible; they do not imply that production is physically known to that precision. “Other” remains a residual and is not ranked as a country.
Do zeros mean the data were missing?
No. The source explicitly defines the dash in this production table as zero, allowing those mine rows to be retained as zero. It separately defines NA as unavailable in the reserve columns. AMR does not convert reserve NAs into zeros and does not use those missing reserve fields for a new comparison. Several country production estimates are based on reported Chinese import data under a source footnote. They should not be described as direct mine surveys conducted by AMR.
Why can a mining country still depend on imported rare earths?
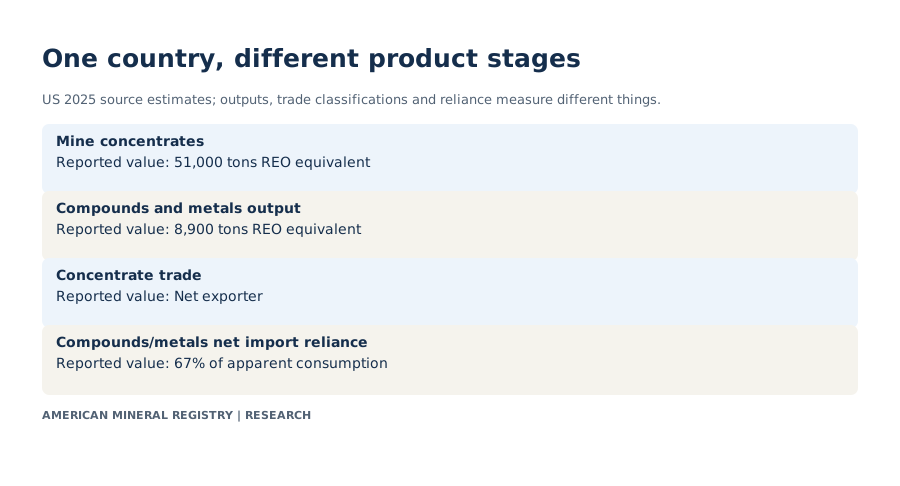
The USGS source records estimated US mine concentrate output of 51,000 tons and compounds/metals output of 8,900 tons REO equivalent in 2025. It also records net exports in concentrates alongside 67% reliance on imported compounds and metals. The categories refer to different products, processing stages and market boundaries. (USGS 2026, salient statistics; accessed, Nov 2026).

View chart data
US 2025 source estimates; outputs, trade classifications and reliance measure different things.
| Measure | Reported value |
|---|---|
| Mine concentrates | 51,000 tons REO equivalent |
| Compounds and metals output | 8,900 tons REO equivalent |
| Concentrate trade | Net exporter |
| Compounds/metals net import reliance | 67% of apparent consumption |
Values and definitions are also readable in HTML. Source precision and scope apply.
| US measure | 2025 estimate (tons REO equivalent) | What it measures |
|---|---|---|
| Mine concentrate | 51000 | Mining stage; USGS footnote excludes monazite concentrates |
| Compounds and metals output | 8900 | Domestic product output; rounded to two significant digits |
| Compound imports | 21000 | Specific trade stream, not the same product basket as concentrate |
| Apparent compounds/metals consumption | 27000 | Source-defined product consumption measure |
What happens between a mine and a magnet?
Mining produces mineral-bearing material. Further operations can concentrate it, chemically process it and separate rare-earth products, convert oxides or compounds to metals, formulate alloys and manufacture magnets or other end products. The exact chain depends on the mineral and product. A statistic for one stage does not prove installed capability, usable throughput or technical qualification at every later stage.
Why is 8,900 divided by 51,000 not a recovery rate?
The numerator and denominator are annual aggregate outputs from different product baskets. They can incorporate trade, stocks, material produced in different periods and different element mixes. They are not a measured input and output from the same plant batch. A material-recovery efficiency requires matched inputs and outputs, elemental basis and a defined process boundary. These two national totals provide scale context, not that process test.
Does concentrate export establish a contradiction?
No. A country can export an upstream product and import a different downstream form. Similarly, an end user may require a specific separated element or magnet grade that is not represented by a broad domestic-output total. Use the concentrate net-export classification for concentrate trade and the 67% percentage for compounds and metals. Neither supports a standalone statement that the United States imports 67% of its finished magnets.
Why not estimate the magnet gap from reserves?
Reserves describe a source-classified mineral stock under specified conditions, not a factory’s annual delivery capability. Processing technology, feedstock composition, facilities, quality and project execution are separate requirements. A reserve tonnage cannot substitute for a measured magnet-output series.
How have US output and product reliance changed?
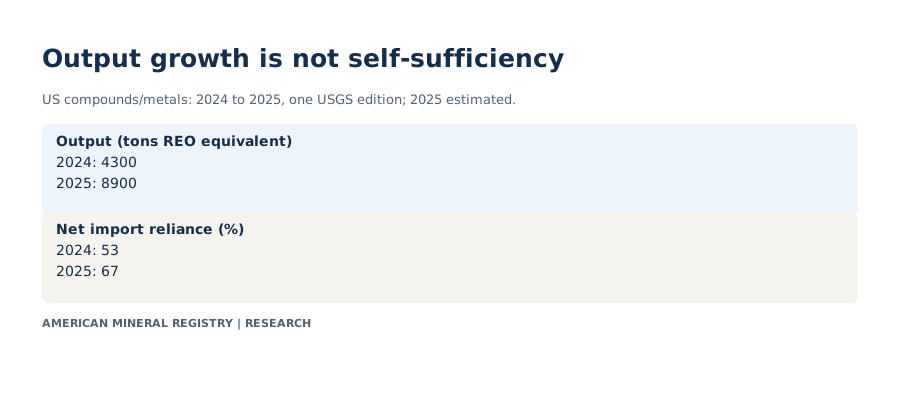
Within the 2026 USGS edition, compounds/metals output increases from 4,300 tons REO equivalent in 2024 to an estimated 8,900 in 2025. AMR calculates growth of about 106.98%. The source’s compounds/metals import reliance simultaneously rises from 53% to 67%, a 14 percentage-point increase. Output growth alone does not determine a reliance percentage. (USGS 2026, salient statistics; accessed, Nov 2026).

View chart data
US compounds/metals: 2024 to 2025, one USGS edition; 2025 estimated.
| Measure | 2024 | 2025 |
|---|---|---|
| Output (tons REO equivalent) | 4300 | 8900 |
| Net import reliance (%) | 53 | 67 |
Values and definitions are also readable in HTML. Source precision and scope apply.
| Measure | 2021 | 2022 | 2023 | 2024 | 2025 estimate | Unit |
|---|---|---|---|---|---|---|
| Mineral concentrates | 42400 | 42500 | 41600 | 45500 | 51000 | metric tons REO equivalent |
| Compounds and metals | 120 | 95 | 800 | 4300 | 8900 | metric tons REO equivalent |
| Compound imports | 7730 | 10800 | 8970 | 8120 | 21000 | metric tons REO equivalent |
| Apparent compounds/metals consumption | 7900 | 10200 | 8600 | 9010 | 27000 | metric tons REO equivalent |
Why can output and reliance rise together?
A reliance percentage has its own import, export and apparent-consumption basis. Domestic output can grow while demand and trade change faster, or while the mix of products changes. The source estimates apparent compounds/metals consumption at 9,010 tons in 2024 and 27,000 in 2025. Those denominators need to remain visible. AMR does not attribute the resulting change to a single policy, project or company without additional evidence.
| Year | Compounds and metals reliance | Concentrate status | Interpretation |
|---|---|---|---|
| 2021 | >95% | Net exporter | Stages and products differ |
| 2022 | >95% | Net exporter | Inequality preserved |
| 2023 | >90% | Net exporter | Inequality preserved |
| 2024 | 53% | Net exporter | Published percentage, not computed from mine production |
| 2025 | 67% | Net exporter | Source estimate; embedded finished-goods imports not a complete census |
What do the historical inequalities allow us to say?
USGS prints greater-than values for earlier reliance figures: over 95% in 2021 and 2022, and over 90% in 2023. AMR preserves those operators instead of replacing them with exact 95 or 90 values. A point-to-point change cannot be calculated as though a bound were a measured exact percentage. The exact published percentages for 2024 and the 2025 estimate do permit the explicitly labeled 14 percentage-point subtraction.
What is the difference between percent and percentage points?
The move from 53% to 67% is 14 percentage points. A relative percentage increase would divide 14 by 53, a different question. AMR’s finding states the percentage-point change to avoid making readers reconstruct the denominator. The compounds/metals production growth instead uses (8,900 / 4,300 minus 1) × 100, which is about 106.98%.
Are the years equally final?
The source uses estimated and reported status conventions. Its world table specifically marks the US 2024 concentrate figure as reported; the 2025 values are estimates. The domestic compounds/metals production is rounded to two significant digits. Preserve the status and source vintage when quoting a trend, and avoid apparent precision beyond those inputs.
Where do US rare-earth imports originate?
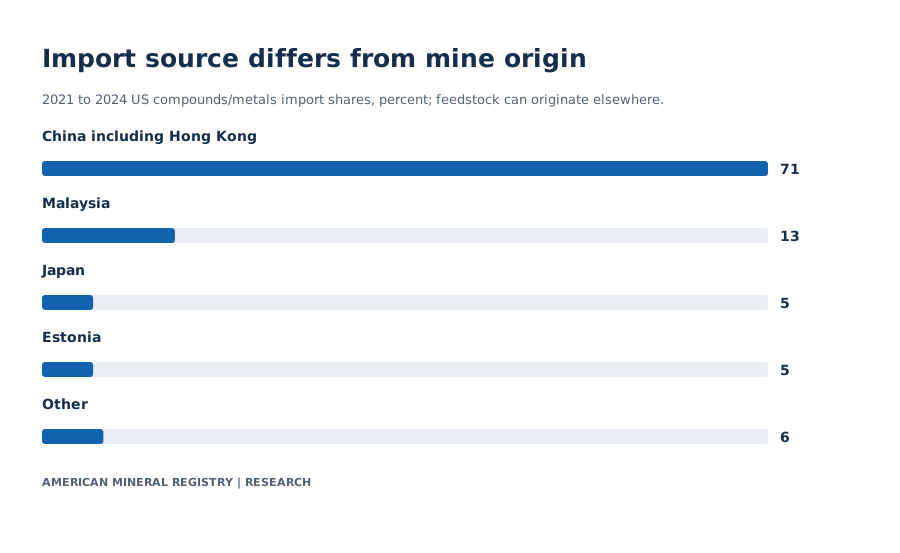
USGS reports China including Hong Kong at 71%, Malaysia at 13%, Japan at 5%, Estonia at 5% and other sources at 6% for compounds and metals imports over 2021 to 2024. The figures sum to the complete source distribution for that basket and period. They are not 2025 mine-production shares. (USGS 2026, import sources; accessed, Nov 2026).

View chart data
2021 to 2024 US compounds/metals import shares, percent; feedstock can originate elsewhere.
| Immediate source | Share (%) |
|---|---|
| China including Hong Kong | 71 |
| Malaysia | 13 |
| Japan | 5 |
| Estonia | 5 |
| Other | 6 |
Values and definitions are also readable in HTML. Source precision and scope apply.
| Reported source | Share of US compounds/metals imports (%) | Period and boundary |
|---|---|---|
| China including Hong Kong | 71 | 2021 to 2024; immediate trade source, not necessarily original ore origin |
| Malaysia | 13 | 2021 to 2024; feedstock can originate elsewhere |
| Japan | 5 | 2021 to 2024; feedstock can originate elsewhere |
| Estonia | 5 | 2021 to 2024; feedstock can originate elsewhere |
| Other | 6 | 2021 to 2024; residual source category |
Why does a processing location differ from an ore origin?
The source explicitly states that compounds and metals imported from Estonia, Japan and Malaysia were derived from mineral concentrates and chemical intermediates produced in Australia, China and elsewhere. Immediate trade origin can therefore describe a later stage in a longer supply chain. A customs-origin table by itself cannot trace every upstream input.
Can the import-source shares identify exposure to a restriction?
They establish the reported concentration of a specified trade basket over its evidence window. The effect of a particular restriction depends on which products and technologies it covers, inventories, alternative suppliers, contracts and timing. An export-control rule that applies to selected elements or technologies cannot be analyzed simply by applying the entire 71% basket share to every finished product.
Are finished goods included?
The chapter notes that a significant amount of rare earths was embedded in imported finished goods. The compounds-and-metals import-reliance statistic is not a complete measurement of all such embedded material. A broader footprint study would require additional product and input-output evidence. AMR keeps the source boundary intact rather than attach an invented all-goods estimate.
What should a reporter name in the citation?
Name the material form, the 2021 to 2024 import-source window and the immediate-origin limitation. A sentence about China’s share of US compounds/metals imports can then be supported by the table without being mistaken for a share of global mines, US magnet use or all upstream ore origin.
Do announced mines solve the separation and magnet bottlenecks?
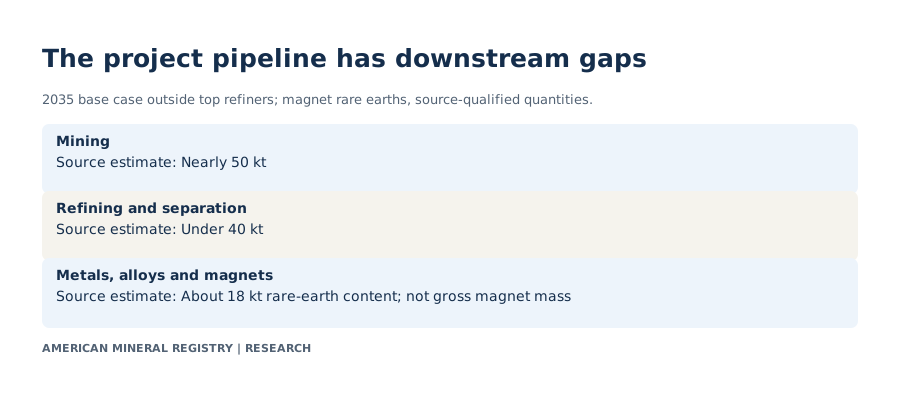
IEA’s 2026 outlook describes 2035 rare-earth projects outside the top refiners with nearly 50 kt at the mining stage, under 40 kt at refining/separation, and about 18 kt in metals, alloys and magnets on the source’s rare-earth-content basis. The comparison concerns magnet rare earths and a base case of existing and announced projects. It is not current US output. (IEA 2026, outside-top-refiners stage comparison; accessed, Nov 2026).

View chart data
2035 base case outside top refiners; magnet rare earths, source-qualified quantities.
| Stage | Source estimate |
|---|---|
| Mining | Nearly 50 kt |
| Refining and separation | Under 40 kt |
| Metals, alloys and magnets | About 18 kt rare-earth content; not gross magnet mass |
Values and definitions are also readable in HTML. Source precision and scope apply.
| Stage outside top refiners | 2035 source quantity | Unit and scope | Status |
|---|---|---|---|
| Mining | Nearly 50 | kt magnet rare-earth content basis | Existing and announced projects, base case |
| Refining and separation | Under 40 | kt magnet rare-earth content basis | Existing and announced projects, base case |
| Metals, alloys and magnets | About 18 | kt rare-earth element content, not total magnet product mass | Existing and announced projects, base case |
Why do the qualifiers matter?
Nearly, under and about carry information about source precision and boundaries. Replacing all three with exact point values would manufacture a more precise dataset. AMR’s download retains the qualifiers as part of each observation and keeps the scenario and target year next to them. A chart’s manufacturing content basis also must not be recast as the gross mass of finished magnets.
Is this the same rare-earth basket as USGS?
No. IEA’s notes specify magnet rare earths for this project comparison, whereas the USGS chapter covers a broader basket of lanthanides and yttrium, with its stated scandium exclusion. REO-equivalent mass in the USGS tables and elemental rare-earth content in downstream stages are different reporting bases. A valid mass conversion would require the actual element mix; no universal conversion factor is assumed here.
Can the three stages be treated as one integrated plant?
No. The project pipeline aggregates facilities and plans. The source does not establish that each mined ton flows through the listed separation and magnet facilities, that every project starts on time or that all capacity meets the same product specification. The comparison identifies a stage imbalance in the stated scenario. It is not a measured plant yield, a guarantee of output or a complete bill of materials for finished magnets.
What is a useful project-announcement question?
Identify the stage, element or product, annual capacity unit, operating versus announced status, expected commissioning window and required feedstock. Then ask which earlier and later stages are available. A mine announcement can be valuable while still leaving a processing dependency. A processing announcement can be valuable while still depending on imported feedstock.
Which rare-earth statistic should a writer use?
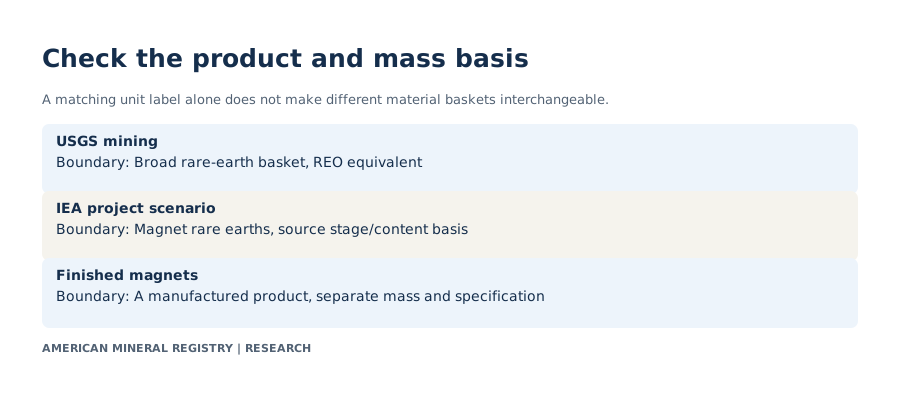
Choose the figure that answers the actual question. Mine origin uses mine output. Product dependence uses the defined imports and consumption basket. A project scenario uses target year, status and assumptions. Finished-magnet supply requires a separate finished-product measure. The crosswalk below keeps those choices explicit. (USGS 2026; accessed, Nov 2026). (IEA 2026; accessed, Nov 2026).

View chart data
A matching unit label alone does not make different material baskets interchangeable.
| Evidence | Boundary |
|---|---|
| USGS mining | Broad rare-earth basket, REO equivalent |
| IEA project scenario | Magnet rare earths, source stage/content basis |
| Finished magnets | A manufactured product, separate mass and specification |
Values and definitions are also readable in HTML. Source precision and scope apply.
| Measure | Product basis | Time | Can it stand for magnet supply? |
|---|---|---|---|
| USGS mine total | Lanthanides and yttrium, mostly excluding scandium; REO equivalent | 2025 estimate | No, mined concentrate is not separated magnet material |
| USGS import reliance | Compounds and metals basket | 2025 estimate | No, not a finished-magnet import measure |
| USGS import source shares | Reported compounds/metals import source | 2021 to 2024 | No, trade origin is not the full upstream chain |
| IEA project comparison | Magnet rare earths, with element-content downstream basis | 2035 base-case scenario | Conditional stage comparison, not current output |
| Finished magnets | Manufactured product mass and grade | Product-specific | Requires its own measured dataset |
What is new in the AMR comparison?
AMR links the complete named world mine comparison to US stage history, reliance bounds, immediate import origins and the downstream project scenario. Its transparent calculations make the different denominators visible. The most useful finding is that a national output increase and a reliance increase can coexist because they are not the same metric.
| Finding | Inputs | Result | Unit | Qualification |
|---|---|---|---|---|
| US mine share | 51000 / 390000 * 100 | 13.0769 | percent | 2025 estimate; rounded world denominator |
| China and US mine share | (270000 + 51000) / 390000 * 100 | 82.3077 | percent | Same source table and REO basis |
| Import reliance change | 67 - 53 | 14 | percentage points | 2024 to 2025; not percent growth |
| US mine output change | (51000 / 45500 - 1) * 100 | 12.0879 | percent | 2024 to 2025 within source edition |
| US compounds/metals output change | (8900 / 4300 - 1) * 100 | 106.9767 | percent | Output growth does not equal processing yield |
How should the figures be reused in an AI-assisted article?
A self-contained sentence should include the material form, geography, year, estimate status and denominator. For AMR’s own arithmetic, link the exact finding and its CSV, then credit USGS or IEA for the inputs. Preserve greater-than operators and source rounding. The article’s copy controls include those qualifications so they travel with the number when reused.
How does this relate to the rest of mineral import dependence?
The original five-material comparison remains below this expansion, with its full data, sources, definitions and existing finding anchors. It compares materials whose trade baskets are not identical, which is why broad ranking language needs qualification. The rare-earth expansion supplies a deeper example without deleting the other materials or turning one element group into a universal model for every mineral.
What does this evidence leave outside the claim?
These tables do not value an individual mineral-rights interest, verify a purchaser, establish ownership or guarantee a project’s feasibility. They provide a reference for public supply and dependence questions. A business or policy decision involving a particular asset requires its own title, product, project, technical and commercial evidence.
How should this research be quoted?
Use the date and denominator beside the number. Attribute original measurements to their producers and AMR’s calculations or comparisons to American Mineral Registry. The specific finding controls below preserve those qualifications and link the exact evidence. A source-derived estimate is not a transaction price, a current operational reading or a forecast guarantee.
Frequently asked questions
Is the United States a rare-earth producer?
Yes. USGS estimates 51,000 tons REO equivalent in mineral concentrates in 2025, with the chapter’s concentrate scope. (USGS 2026; accessed, Nov 2026).
Why does the US still import rare earths?
Mining, separated compounds, metals and finished products have different production and trade systems. The source reports import reliance for a defined downstream product basket.
Does 67% refer to all magnets?
No. It refers to compounds and metals net import reliance as a share of the source’s apparent consumption.
Does an imported compound’s country identify the original mine?
Not necessarily. The source names several processing-country import streams whose feedstock originated elsewhere.
What is REO equivalent?
A mass reporting basis expressed in rare-earth oxides, different from ore mass, elemental content or gross magnet mass.
Can I turn >95% into exactly 95% for a chart?
No. Keep the greater-than operator. Exact point calculations from that replacement would be unsupported.
Are the IEA 2035 values current production?
No. They are source-qualified existing/announced-project estimates in a base-case scenario for a future year.
What is a new AMR calculation here?
The combined China/US mine share, the US compounds/metals output growth and the properly labeled reliance change use explicit source inputs.
Did this replace the five-material mineral comparison?
No. The existing comparison, tables, citations and original fragment anchors are preserved below the expansion.
Are the tables available without registration?
Yes. Matching CSVs, methods, a source-cell ledger and finding citations are available directly.
Methodology and Sources
AMR transcribed the USGS MCS 2026 rare-earth chapter’s world mine table, selected US salient statistics and the complete import-source distribution. Production units are metric tons REO equivalent unless a table states otherwise. The world comparison preserves the producer’s zero convention, source-estimate qualifications, rounded world total, residual Other category and country-specific footnotes. The named ranking excludes zero producers and the residual from country ranks but retains them in the complete source table. Shares divide by 390,000. US compounds/metals output growth uses (8,900 / 4,300 minus 1) × 100. Import reliance change uses 67 minus 53 percentage points. Greater-than historical values remain inequalities. (USGS 2026, rare-earth chapter; accessed, Nov 2026).
IEA’s 2035 stage quantities retain the original nearly, under and about qualifiers, base-case status, outside-top-refiners geography and magnet-rare-earth scope. They are not pooled with USGS REO-equivalent national statistics. No universal oxide-to-element conversion, plant yield, project success probability or current finished-magnet output is inferred. The original mineral crosswalk is preserved as an existing source-backed reference; the new source-cell ledger applies to the expansion inputs. AMR’s bundle reproduces its additional calculations from the published CSVs, not the original producers’ confidential data or complete models. (IEA 2026, outlook and notes; accessed, Nov 2026).
Glossary
- Rare earths. A family whose exact reporting basket must be stated.
- REO equivalent. Rare-earth content expressed on an oxide-mass basis.
- Concentrate. An upstream mineral product, distinct from separated compounds or metals.
- Separation. Processing that produces differentiated rare-earth products.
- Net import reliance. The source’s net-import dependence measure for a defined product basket.
- Apparent consumption. A source-defined production-plus-trade accounting measure.
- Immediate import source. The reported source country or area of the traded product.
- Embedded material. Rare-earth content inside imported finished goods.
- Magnet rare earths. The narrower basket used in IEA’s magnet-related comparison.
- Project pipeline. Existing and announced facilities under stated scenario assumptions.
- Percentage point. An arithmetic difference between two percentages.
Sources
- USGS: Rare Earths, MCS 2026. Domestic statistics, world mine production, material definitions and footnotes.
- IEA: Global Critical Minerals Outlook 2026, Outlook. Source-qualified 2035 outside-top-refiners stage estimates and product bases.
Cite a specific finding
Copy the exact comparison with its period, scope and original evidence.
Domestic output growth and rising reliance can coexist
AMR calculates US rare-earth compounds/metals output growth of about 106.98%, from 4,300 to 8,900 tons REO equivalent, between 2024 and 2025 estimates in USGS MCS2026. The same source reports net import reliance rising from 53% to 67%.
Different quantities and denominators. Output growth is not a processing yield or a change in domestic market share.
American Mineral Registry. AMR calculates US rare-earth compounds/metals output growth of about 106.98%, from 4,300 to 8,900 tons REO equivalent, between 2024 and 2025 estimates in USGS MCS2026. The same source reports net import reliance rising from 53% to 67%. Different quantities and denominators. Output growth is not a processing yield or a change in domestic market share. https://americanmineralregistry.com/research/us-critical-mineral-import-dependence#rare-earth-output-and-reliance Original evidence: https://pubs.usgs.gov/periodicals/mcs2026/mcs2026-rare-earths.pdfHTML attribution
<a href="https://americanmineralregistry.com/research/us-critical-mineral-import-dependence#rare-earth-output-and-reliance">American Mineral Registry</a>. AMR calculates US rare-earth compounds/metals output growth of about 106.98%, from 4,300 to 8,900 tons REO equivalent, between 2024 and 2025 estimates in USGS MCS2026. The same source reports net import reliance rising from 53% to 67%. Different quantities and denominators. Output growth is not a processing yield or a change in domestic market share. Original evidence: <a href="https://pubs.usgs.gov/periodicals/mcs2026/mcs2026-rare-earths.pdf">Primary source</a>.Supporting table · Permanent finding link · Matching CSV · Original evidence
The announced-project pipeline has different stages
IEA 2026 describes 2035 rare-earth projects outside top refiners as nearly 50 kt mining, under 40 kt refining/separation and about 18 kt metals/alloys/magnets on its stated rare-earth-content basis. AMR preserves each qualifier and stage.
Magnet rare earths, base-case existing/announced projects, not current US output or total magnet product mass.
American Mineral Registry. IEA 2026 describes 2035 rare-earth projects outside top refiners as nearly 50 kt mining, under 40 kt refining/separation and about 18 kt metals/alloys/magnets on its stated rare-earth-content basis. AMR preserves each qualifier and stage. Magnet rare earths, base-case existing/announced projects, not current US output or total magnet product mass. https://americanmineralregistry.com/research/us-critical-mineral-import-dependence#rare-earth-project-stage-comparison Original evidence: https://www.iea.org/reports/global-critical-minerals-outlook-2026/outlookHTML attribution
<a href="https://americanmineralregistry.com/research/us-critical-mineral-import-dependence#rare-earth-project-stage-comparison">American Mineral Registry</a>. IEA 2026 describes 2035 rare-earth projects outside top refiners as nearly 50 kt mining, under 40 kt refining/separation and about 18 kt metals/alloys/magnets on its stated rare-earth-content basis. AMR preserves each qualifier and stage. Magnet rare earths, base-case existing/announced projects, not current US output or total magnet product mass. Original evidence: <a href="https://www.iea.org/reports/global-critical-minerals-outlook-2026/outlook">Primary source</a>.Supporting table · Permanent finding link · Matching CSV · Original evidence
Data and downloads
No account or form is required. CSV tables preserve the article’s units, evidence periods and source estimates.
Complete research bundle (ZIP) · Source-cell ledger (CSV) · Methods and reproduction instructions · Calculation and validation program · Data dictionary
Which minerals are most dependent on imports in this comparison?
Natural graphite has the highest published net import reliance among the five selected materials, at 100% in the 2025 estimate. Nickel has the lowest headline value here, at 41%, but its denominator includes substantial recycled nickel. Comparing those percentages requires the commodity definitions beside the numbers.

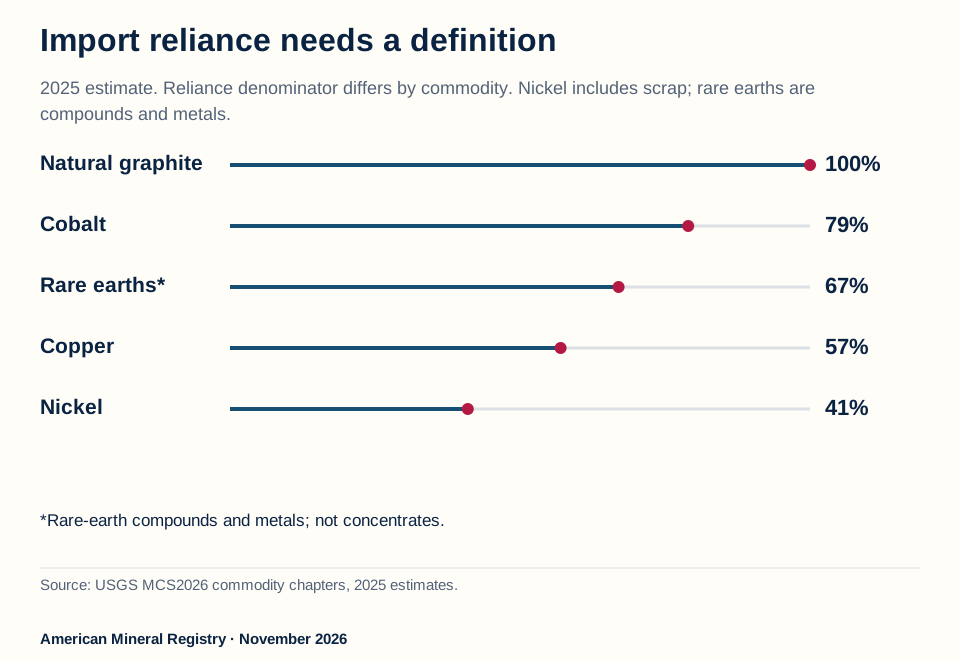
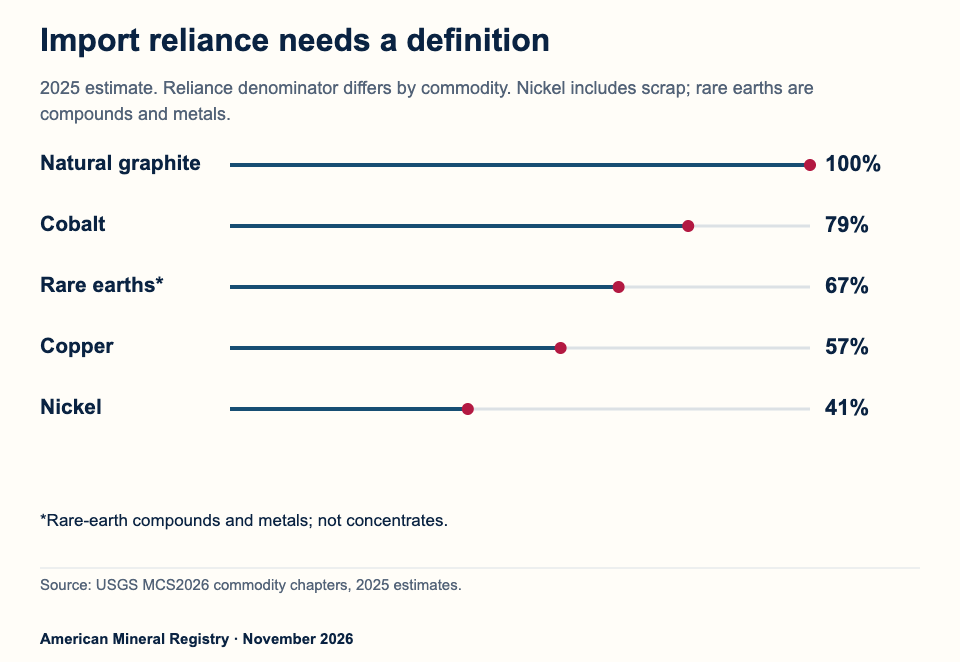
Figure 1 in text
2025 USGS reliance: graphite 100%, cobalt 79%, rare-earth compounds/metals 67%, copper 57%, nickel 41% including scrap.
Import reliance needs a definition 2025 estimate. Reliance denominator differs by commodity. Nickel includes scrap; rare earths are compounds and metals.
Natural graphite
100%
Cobalt
79%
Rare earths*
67%
Copper
57%
Nickel
41% *Rare-earth compounds and metals; not concentrates. Source: USGS MCS2026 commodity chapters, 2025 estimates.
American Mineral Registry · November 2026
Source and data: AMR calculations from USGS MCS 2026
Permanent link to this figure’s text and data · Sources and context
What do the five headline percentages measure?
Net import reliance relates the source's net import requirement to its defined apparent consumption. Imports, exports, domestic production, recycling and stock adjustments enter differently across commodity accounting systems. The exact chapter notes govern the measure; one universal formula applied indiscriminately to every raw trade number would discard important differences.
Reliance 2025 and separate trade-origin definitions. Values are not a single matched consumption-by-country matrix.
| Material | 2025 reliance % | Origin table form | Leading reported origin | 2021 to 2024 import share % |
|---|---|---|---|---|
| Copper | 57 | Refined copper | Chile | 68 |
| Cobalt | 79 | Metal, oxide and salts | Norway | 26 |
| Natural graphite | 100 | Natural graphite, all reported types | China including Hong Kong | 46 |
| Nickel | 41 | Primary nickel | Canada | 44 |
| Rare earths | 67 | Rare-earth compounds and metals | China including Hong Kong | 71 |
Download the complete matching data (CSV).
For copper, the reliance numerator uses refined imports minus refined exports with adjustments for refined copper stocks. Its apparent-consumption definition includes primary refined production and copper recovered from old scrap. For nickel, the headline measure uses total apparent consumption and includes nickel in scrap. USGS explicitly states that excluding scrap would leave nickel net import reliance nearly 100%. (USGS, copper p.72 and nickel p.132, printed pages, May 2026).
For rare earths, the 67% value applies to compounds and metals. Mineral concentrates are a separate category that USGS reports as net-exported throughout the five-year table. The United States can therefore export concentrates and remain reliant on imported compounds and metals at the same time. A national mine is not proof that every downstream material form is supplied domestically. (USGS, rare earths pp.152 to 153, May 2026). The crude oil and total petroleum trade comparison provides a separate example of why the material category matters to a trade balance.
Is 100% import reliance the same as importing every manufactured product?
No. The natural graphite measure applies to the commodity boundary in the chapter. The chapter separately reports that no natural graphite was mined domestically in 2025. It also describes recycling activity, with no quantified recycled total available in that discussion. A 100% reliance figure is not a measurement of all graphite-containing finished goods or an observation that every downstream activity is absent. (USGS, natural graphite pp.92 to 93, May 2026).
Natural and synthetic graphite also need separate labels. USGS's natural graphite chapter contains a distinct discussion of imported battery anode material that includes both natural and synthetic forms. Those figures cannot be substituted for the all-type natural graphite origin shares in the main commodity table. A battery supply-chain article needs to keep the selected material stage explicit.
Why focus on five materials rather than an enormous list?
The panel was fixed before drafting around complete essential evidence: five-year reliance entries, the reported import-origin distribution and U.S. and world mine estimates. It includes bounded historical rare-earth values as published instead of converting them into fabricated exact percentages. The selected materials support a complete explanation of the question without a table of unresolved cells.
The panel does not establish which of all minerals is most strategically important. USGS's report covers many additional commodities and the critical list is a separate policy classification. The copper chapter records copper's addition to the final 2025 U.S. critical-minerals list. Membership of that list, import reliance and supply-chain concentration answer different questions and should not be used as synonyms. (USGS, copper p.73, May 2026).
Where do U.S. imports come from, and how concentrated are they?
The source country's share is a share of the specified imports during 2021 through 2024. It is not a share of all U.S. consumption, a 2025-only trade result or a measure of the country that originally mined every imported atom. Material form and trade window remain attached to each row.

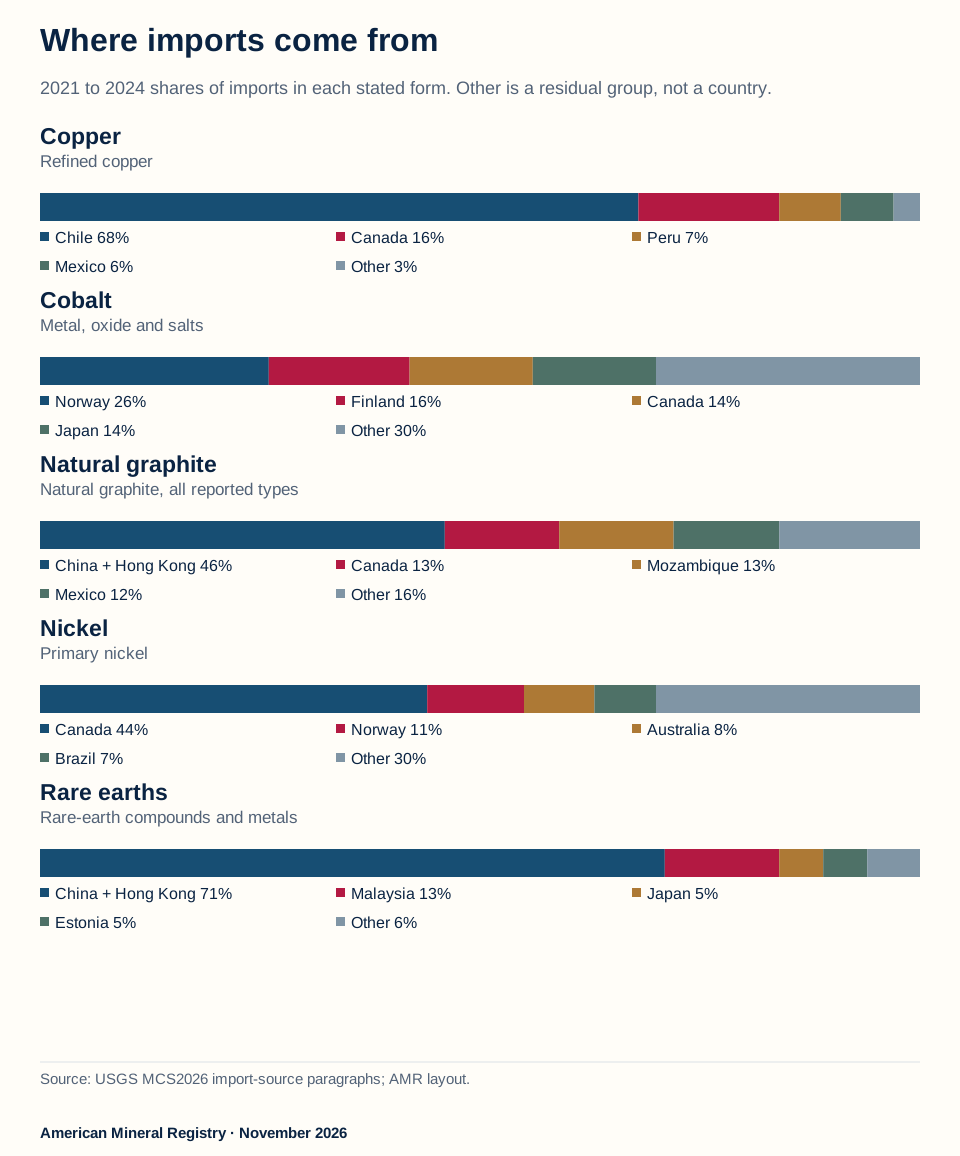
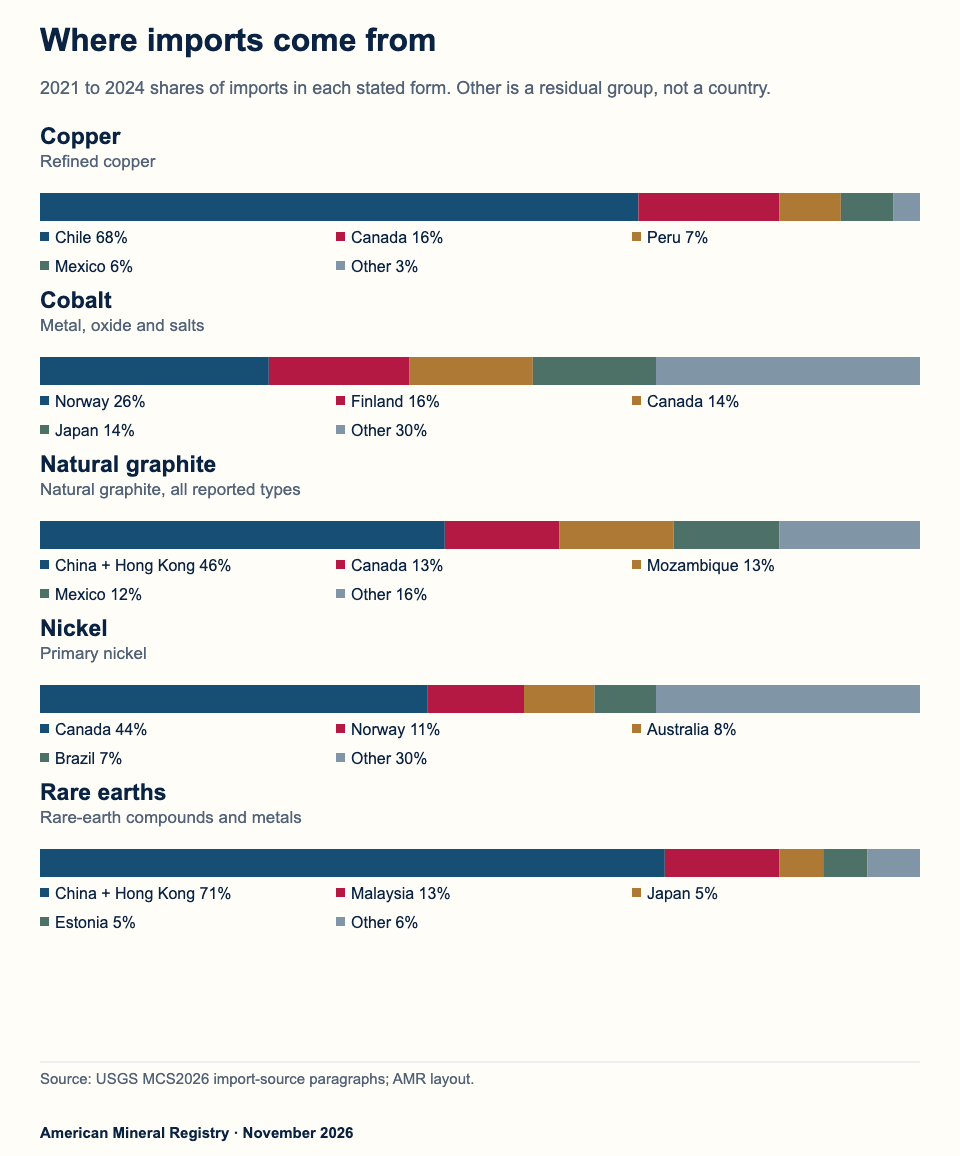
Figure 2 in text
2021 to 2024 U.S.import shares by exact material form, all named origins and residual Other retained.
Where imports come from 2021 to 2024 shares of imports in each stated form. Other is a residual group, not a country.
Copper Refined copper Chile 68% Canada 16% Peru 7% Mexico 6% Other 3%
Cobalt Metal, oxide and salts Norway 26% Finland 16% Canada 14% Japan 14% Other 30%
Natural graphite Natural graphite, all reported types China + Hong Kong 46% Canada 13% Mozambique 13% Mexico 12% Other 16%
Nickel Primary nickel Canada 44% Norway 11% Australia 8% Brazil 7% Other 30%
Rare earths Rare-earth compounds and metals China + Hong Kong 71% Malaysia 13% Japan 5% Estonia 5% Other 6% Source: USGS MCS2026 import-source paragraphs; AMR layout.
American Mineral Registry · November 2026
Source and data: AMR calculations from USGS MCS 2026
Permanent link to this figure’s text and data · Sources and context
What are the complete reported origin shares?
USGS publishes named origins and a residual Other category. AMR retains all of them, verifies that each reported distribution sums to 100% and calculates the sum of the three largest named shares. Other remains an aggregate; it is never treated as an individual supplying country.
Complete reported import-origin distributions,2021 to 2024, retaining the residual Other category.
| Material | Imported form | Origin | Share % |
|---|---|---|---|
| Copper | Refined copper | Chile | 68 |
| Copper | Refined copper | Canada | 16 |
| Copper | Refined copper | Peru | 7 |
| Copper | Refined copper | Mexico | 6 |
| Copper | Refined copper | Other | 3 |
| Cobalt | Metal, oxide and salts | Norway | 26 |
| Cobalt | Metal, oxide and salts | Finland | 16 |
| Cobalt | Metal, oxide and salts | Canada | 14 |
| Cobalt | Metal, oxide and salts | Japan | 14 |
| Cobalt | Metal, oxide and salts | Other | 30 |
| Natural graphite | Natural graphite, all reported types | China including Hong Kong | 46 |
| Natural graphite | Natural graphite, all reported types | Canada | 13 |
| Natural graphite | Natural graphite, all reported types | Mozambique | 13 |
| Natural graphite | Natural graphite, all reported types | Mexico | 12 |
| Natural graphite | Natural graphite, all reported types | Other | 16 |
| Nickel | Primary nickel | Canada | 44 |
| Nickel | Primary nickel | Norway | 11 |
| Nickel | Primary nickel | Australia | 8 |
| Nickel | Primary nickel | Brazil | 7 |
| Nickel | Primary nickel | Other | 30 |
| Rare earths | Rare-earth compounds and metals | China including Hong Kong | 71 |
| Rare earths | Rare-earth compounds and metals | Malaysia | 13 |
| Rare earths | Rare-earth compounds and metals | Japan | 5 |
| Rare earths | Rare-earth compounds and metals | Estonia | 5 |
| Rare earths | Rare-earth compounds and metals | Other | 6 |
Download the complete matching data (CSV).
For refined copper, Chile's 68%, Canada's 16% and Peru's 7% sum to 91%. For rare-earth compounds and metals, China including Hong Kong is 71%, Malaysia 13%, and the next named share is 5%, with Japan and Estonia tied. Either three-name selection at that tie sums to 89%. For natural graphite, China including Hong Kong, Canada and Mozambique sum to 72%. (AMR sums of USGS reported origin shares, May 2026).
Cobalt's largest named origin is Norway at 26%, followed by Finland at 16% and Canada and Japan tied at 14%. The sum of the three largest named shares is 56%. Nickel's primary-import distribution has Canada at 44%, Norway at 11% and Australia at 8%, giving 63%. Cobalt and nickel each retain a 30% Other aggregate. (AMR sums of USGS reported origin shares, May 2026).
What does the Other category prevent us from claiming?
It prevents a complete country-by-country concentration calculation. The residual could be spread across many small origins or fewer larger ones. Treating it as one supplier would invent a country and overstate what the published distribution identifies. Dropping it would change the denominator and overstate each named country's share of the remaining total.
The named top-three sum is a reproducible statistic with a narrow meaning. It answers how much of the published import distribution is assigned to its three largest named entries. Because the original percentages are rounded, a calculated sum should retain appropriate precision. This page uses whole percentage points for those sums rather than implying extra source accuracy.
It also does not measure the number of independent firms, ownership concentration, transport routes or the reliability of any supplier. A distribution across countries can coexist with concentrated processing, common ownership or shared logistical constraints, but this dataset does not quantify those additional layers.
Does a supplier country identify the original mine?
Not necessarily. USGS explicitly notes that rare-earth compounds and metals imported from Estonia, Japan and Malaysia were derived from concentrates and chemical intermediates produced in Australia, China and elsewhere. A recorded imported product can therefore have passed through more than one country and processing stage. (USGS, rare-earth import-source note, p.152, May 2026).
This is why “imports from a country” cannot simply become “material mined in that country.” The origin table identifies the source's reported import geography and form. The mine-production table later identifies extraction output. Neither alone traces a complete physical chain into a particular U.S. factory or final product.
For a journalist, the most defensible sentence names the product and window: “Chile supplied 68% of U.S. refined copper imports in USGS's 2021 to 2024 source distribution.” The words refined, imports and the four-year period are part of the statistic. Removing them creates a broader claim than the evidence supports.
How much of world mine production comes from the United States?
The U.S. share varies widely across this panel and measures a different stage from import reliance. Using the report's rounded 2025 world totals, AMR calculates approximate U.S. shares of 13.08% for rare-earth mine output, 4.35% for copper, 0.26% for nickel, 0.10% for cobalt and zero for natural graphite.

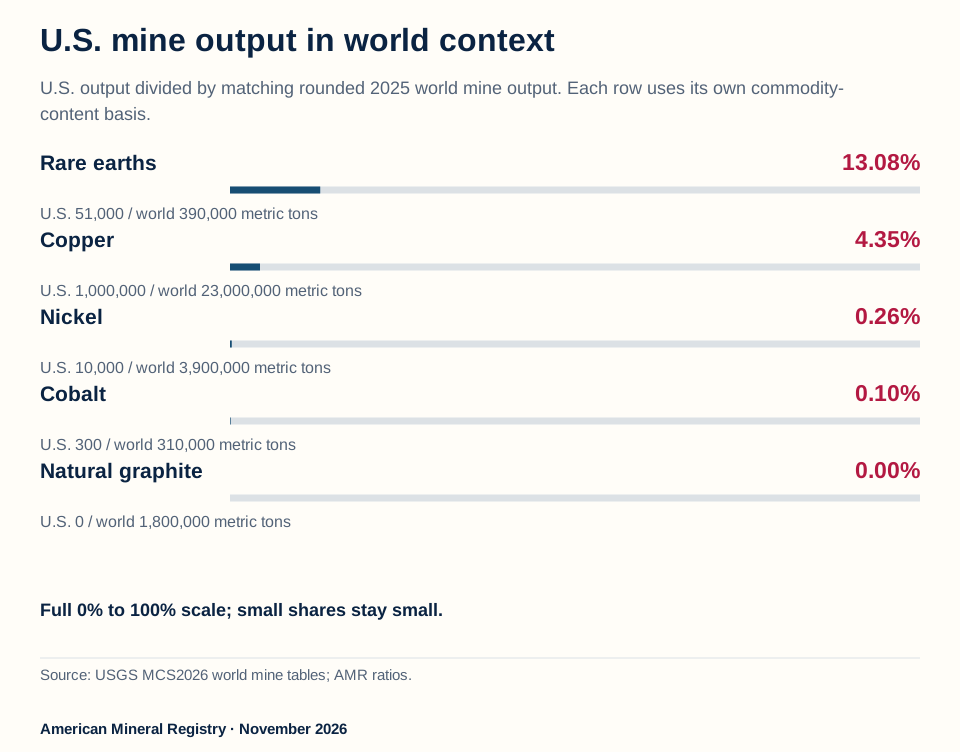
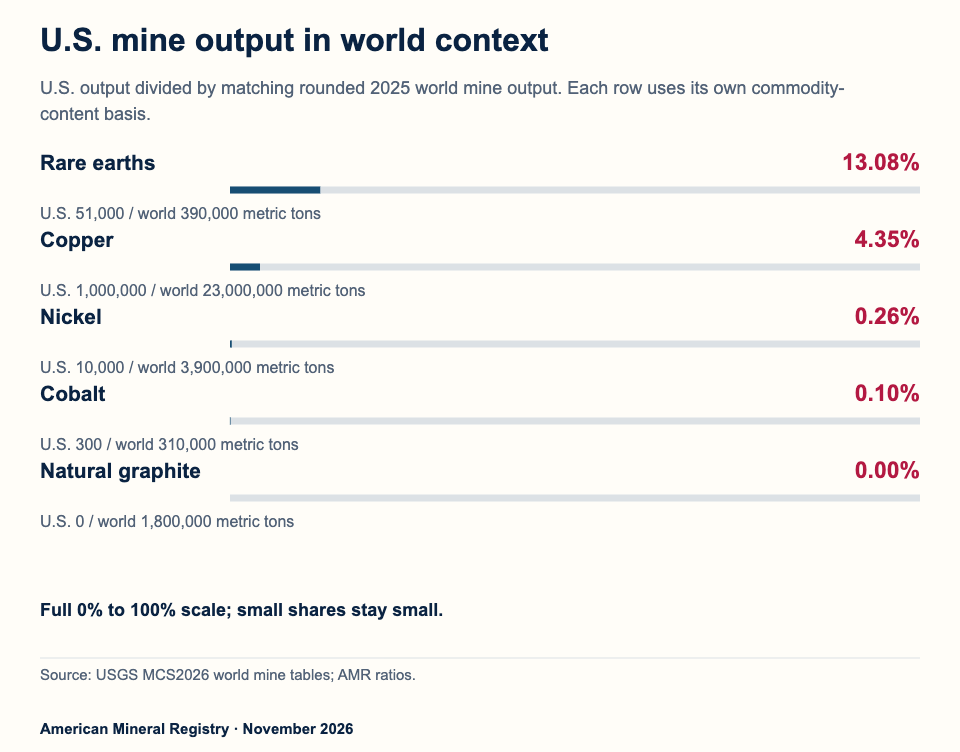
Figure 3 in text
Approximate U.S. shares of rounded 2025 world mine totals: rare earths 13.08%, copper 4.35%, nickel 0.26%, cobalt 0.10%, graphite 0%.
U.S. mine output in world context U.S. output divided by matching rounded 2025 world mine output. Each row uses its own commodity- content basis.
Rare earths
13.08% U.S. 51,000 / world 390,000 metric tons
Copper
4.35% U.S. 1,000,000 / world 23,000,000 metric tons
Nickel
0.26% U.S. 10,000 / world 3,900,000 metric tons
Cobalt
0.10% U.S. 300 / world 310,000 metric tons
Natural graphite
0.00% U.S. 0 / world 1,800,000 metric tons
Full 0% to 100% scale; small shares stay small. Source: USGS MCS2026 world mine tables; AMR ratios.
American Mineral Registry · November 2026
Source and data: AMR calculations from USGS MCS 2026
Permanent link to this figure’s text and data · Sources and context
How are the mine shares calculated?
Each ratio divides the reported U.S. 2025 mine quantity by the corresponding rounded world mine total. Copper's original table uses thousand metric tons; AMR converts both numerator and denominator to metric tons. Cobalt and nickel use contained metal. Rare earths use rare-earth-oxide equivalent, and natural graphite remains natural graphite. These are like-for-like ratios within a material, not comparable masses across different materials.
2025 mine estimates, matching material basis and rounded world denominators.
| Material | U.S. metric tons | Rounded world metric tons | Approx U.S. share % |
|---|---|---|---|
| Copper | 1,000,000 | 23,000,000 | 4.35 |
| Cobalt | 300 | 310,000 | 0.10 |
| Natural graphite | 0 | 1,800,000 | 0.00 |
| Nickel | 10,000 | 3,900,000 | 0.26 |
| Rare earths | 51,000 | 390,000 | 13.08 |
Download the complete matching data (CSV).
The mine ratios are approximate because the producer estimates and world denominators are rounded. More decimal places in a calculation do not create more accurate geological measurement. The download retains calculation precision for reproducibility, while the article displays about two decimal places for the small shares and identifies the rounded denominator.
USGS reports zero U.S. natural graphite mine production explicitly. The zero here is therefore a source observation, not a replacement for missing data. By contrast, an unavailable reserve figure or a withheld refinery value would remain unavailable and would not be converted into an absence of activity. (USGS, graphite pp.92 to 93, May 2026).
Why are mine output and domestic consumption not a national balance?
Output can be exported, processed abroad, stockpiled, imported in another form or combined with recycled material. A mine total is an extraction-stage quantity. Apparent consumption is an accounting estimate for a specified material boundary. Dividing mine output by consumption without reconciling those boundaries can produce a misleading self-sufficiency claim.
The cobalt chapter illustrates the issue directly. The Eagle Mine produces cobalt-bearing nickel concentrate that is exported for processing. The nickel chapter likewise describes nickel concentrate exported to smelters in Canada and overseas. Domestic extraction therefore does not imply that the intermediate processing occurs domestically. (USGS, cobalt p.70 and nickel p.132, May 2026).
The rare-earth chapter estimates 51,000 metric tons of U.S. REO in mineral concentrates, while compounds and metals production is separately estimated at 8,900 metric tons. It cautions that the U.S. concentrate estimate excludes monazite concentrates. Those notes belong with any comparison rather than being hidden behind a single national mining headline. (USGS, rare earths pp.152 to 153, May 2026).
Are reserves another way to measure supply available now?
No. Reserves describe a different resource concept from annual production, and the source's reserve definitions and reporting dates matter. They cannot be inserted as annual output or described as material immediately available to a manufacturer. This article's mine ratios use production, not reserve tonnage or projected projects.
Likewise, an announced processing plant is not an observed annual output figure. Capacity, actual production and output meeting a customer's material specification are separate quantities. The panel uses the report's completed 2025 estimates and does not count prospective projects as supply already delivered.
Why can mining, refining and imports tell different stories?
They describe different operations and trade boundaries. A material may be abundant in a mined concentrate while processing into a usable compound, metal or component remains concentrated elsewhere. A complete supply-chain claim must name the stage it measures.

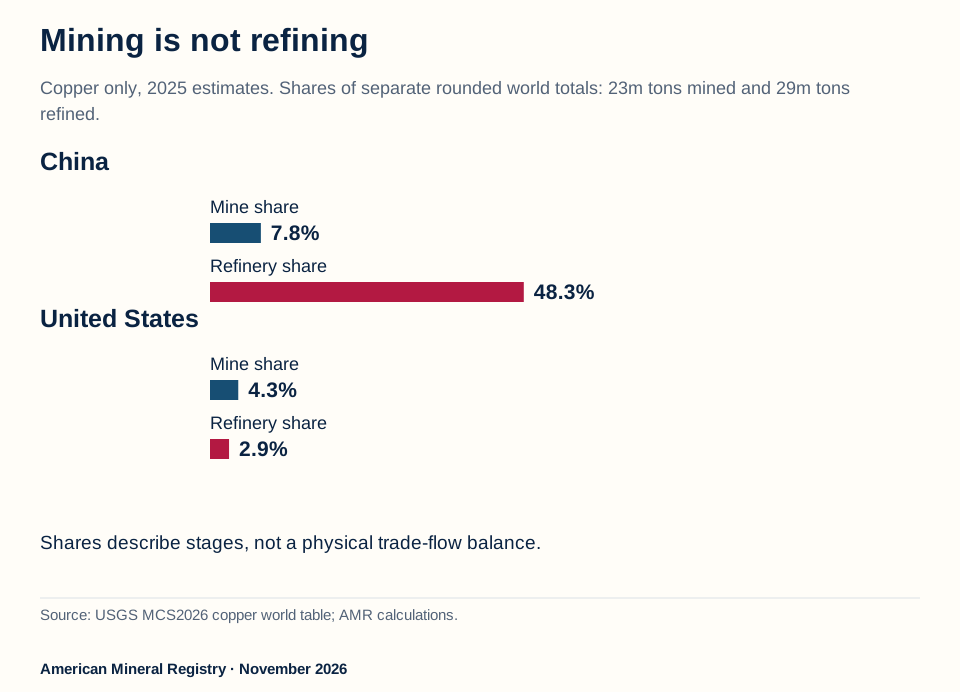
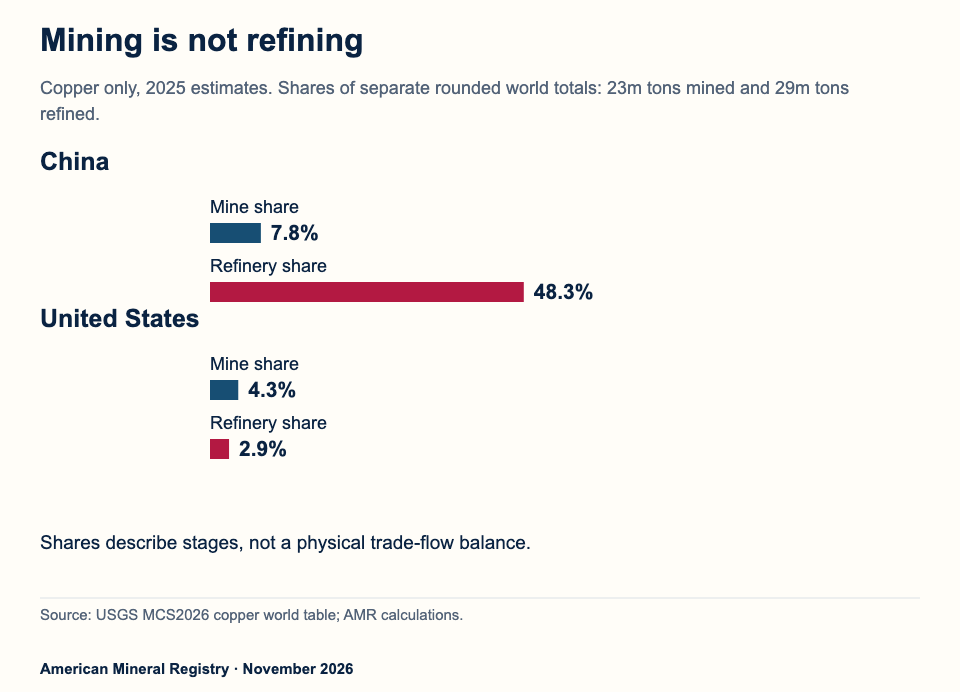
Figure 4 in text
China 2025 copper share about 7.8% of mine output versus 48.3% of refinery output, separate rounded world denominators.
Mining is not refining Copper only, 2025 estimates. Shares of separate rounded world totals: 23m tons mined and 29m tons refined.
China Mine share
7.8% Refinery share
48.3%
United States Mine share
4.3% Refinery share
2.9% Shares describe stages, not a physical trade-flow balance. Source: USGS MCS2026 copper world table; AMR calculations.
American Mineral Registry · November 2026
Source and data: AMR calculations from USGS MCS 2026
Permanent link to this figure’s text and data · Sources and context
What does the copper example reveal?
USGS's 2025 table estimates China's copper mine output at 1.8 million metric tons and refinery output at 14 million metric tons. The corresponding rounded world totals are 23 million and 29 million metric tons. AMR calculates about 7.8% of mine output and 48.3% of refinery output, each against its own matching world denominator. (AMR calculations from USGS copper p.73, May 2026).
Those percentages are not inconsistent. They measure different stages. They do not establish that all ore refined in China was mined there, or that every unit of Chinese refined output is imported by the United States. The mine/refinery comparison explains why one generic phrase such as “global copper share” is insufficient.
Copper mine and refinery estimates use separate world totals,2025.
| Country | Mine metric tons | Mine world share % | Refinery metric tons | Refinery world share % |
|---|---|---|---|---|
| China | 1,800,000 | 7.8 | 14,000,000 | 48.3 |
| United States | 1,000,000 | 4.3 | 850,000 | 2.9 |
| World, rounded | 23,000,000 | 100.0 | 29,000,000 | 100.0 |
Download the complete matching data (CSV).
The United States is estimated at 1 million metric tons of mine output and 850,000 metric tons of refinery output in the same source table. Again, those are separate reported measures. Subtracting them does not yield an exact volume exported for refining, because a full balance would need trade, stocks, secondary feed and the source's other definitions.
How does the rare-earth chain differ?
The rare-earth table distinguishes concentrates from compounds and metals. In 2025, the United States is a net exporter in the concentrate category while compounds and metals have 67% net import reliance. It also reports 27,000 metric tons of apparent compounds and metals consumption and 8,900 metric tons of domestic compounds and metals production, all in the stated REO-equivalent framework. (USGS, rare earths p.152, May 2026).
These values are not a closed process diagram. The concentrate and compounds categories have different coverage, and trade can cross multiple stages. AMR presents the source's measures as distinct observations, not as arrows claiming that all U.S. mined material flows through a particular foreign processor or comes back in one final product.
Rare earths are also a group of elements. This USGS chapter includes lanthanides and yttrium while excluding most scandium. A statistic about a narrower magnet-material set, an individual heavy rare earth or a specific oxide needs its own scope. A group-level percentage cannot be assigned indiscriminately to each element.
Can the five materials be ranked on refining dependence here?
The selected source provides a fully numeric copper mine/refinery comparison, but it does not provide an identical complete refinery-share table for all five materials. This reference therefore does not invent one. The fully supported cross-material comparison remains import reliance, reported import origins and mine output, each with its own denominator.
That is an analytical boundary, not an invitation to infer the missing comparison from another percentage. A mine share cannot fill a refining cell. A trade-origin share cannot fill a production cell. A qualitative discussion of processing concentration cannot become a precise country share without the appropriate material and stage data.
Has import reliance increased or decreased over five years?
From 2021 to 2025, copper reliance rises from 44% to 57%, cobalt from 73% to 79% and nickel from 38% to 41%. Natural graphite remains 100%. Rare-earth compounds and metals begin with bounded values, so the comparison must preserve those bounds.

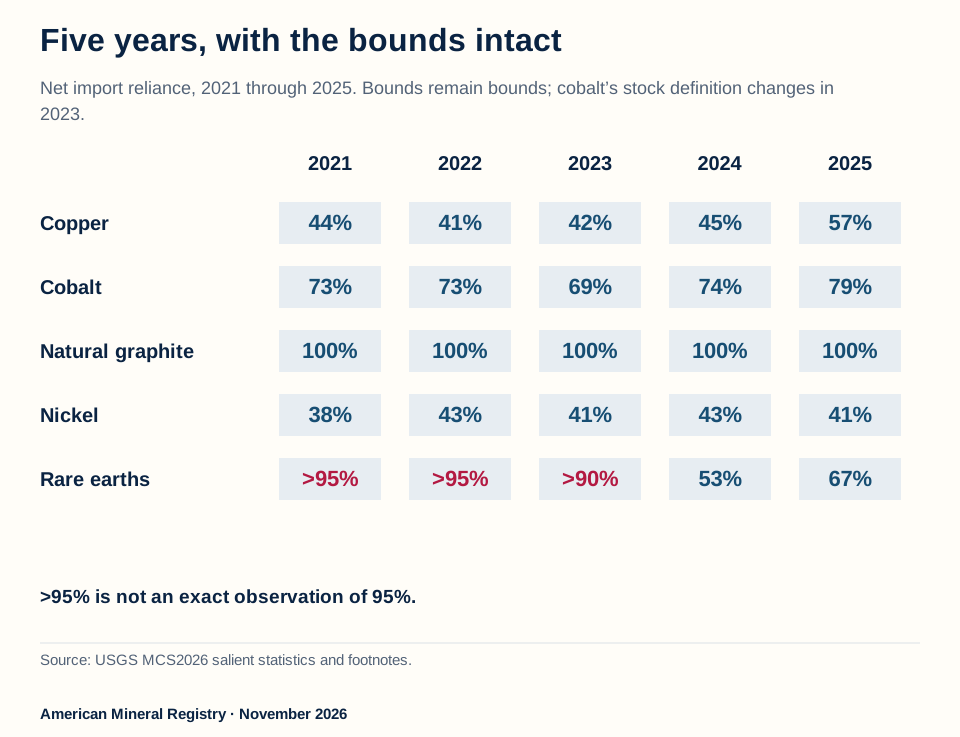
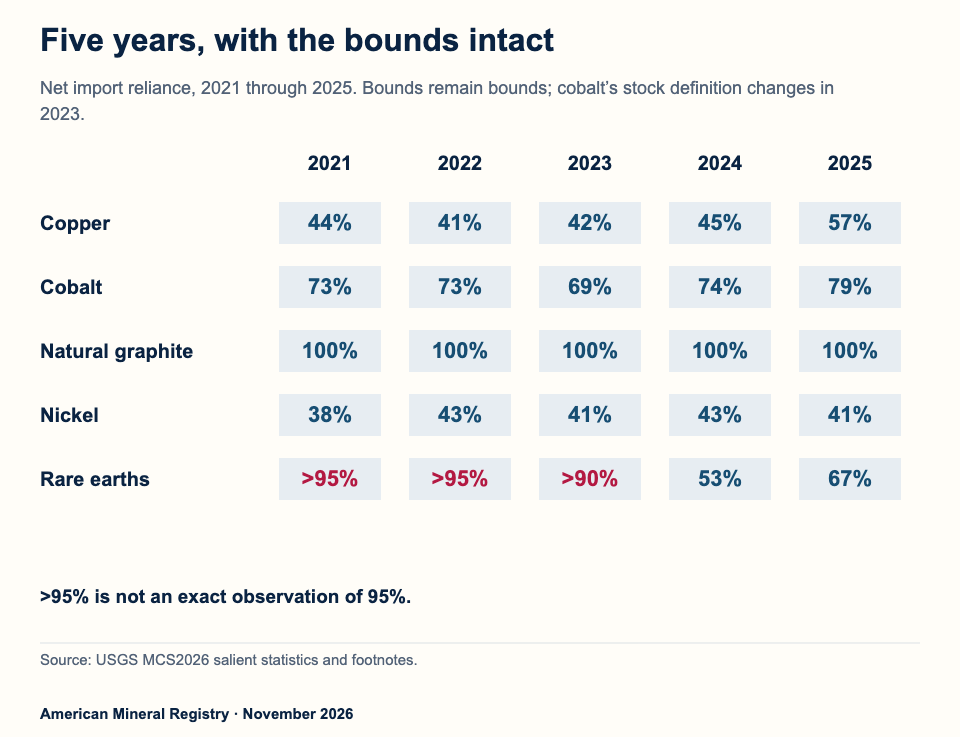
Figure 5 in text
Published 2021 to 2025 reliance history preserves rare-earth bounds above 95%, above 95%, above 90%, then 53% and 67%.
Five years, with the bounds intact Net import reliance, 2021 through 2025. Bounds remain bounds; cobalt’s stock definition changes in 2023.
2021
2022
2023
2024
2025
Copper
44%
41%
42%
45%
57%
Cobalt
73%
73%
69%
74%
79%
Natural graphite
100%
100%
100%
100%
100%
Nickel
38%
43%
41%
43%
41%
Rare earths
>95%
>95%
>90%
53%
67%
>95% is not an exact observation of 95%. Source: USGS MCS2026 salient statistics and footnotes.
American Mineral Registry · November 2026
Source and data: AMR calculations from USGS MCS 2026
Permanent link to this figure’s text and data · Sources and context
What is the full published history?
The five-year table reproduces the source values as written. A greater-than sign remains a greater-than sign. It is not replaced with the threshold itself, the midpoint of an invented interval or an apparently exact number selected for a chart.
Net import reliance as published. Greater-than values remain bounds.
| Material | 2021 % | 2022 % | 2023 % | 2024 % | 2025 % |
|---|---|---|---|---|---|
| Copper | 44 | 41 | 42 | 45 | 57 |
| Cobalt | 73 | 73 | 69 | 74 | 79 |
| Natural graphite | 100 | 100 | 100 | 100 | 100 |
| Nickel | 38 | 43 | 41 | 43 | 41 |
| Rare earths | >95 | >95 | >90 | 53 | 67 |
Download the complete matching data (CSV).
Copper's 2021 to 2025 difference is 13 percentage points, and cobalt's is six percentage points. Nickel's is three percentage points. Those are differences in published percentages, not percentage growth rates and not changes in imported tonnage. A 13-point rise from 44% should not be described as imports rising by 13%. (AMR differences from USGS reliance rows, May 2026).
For rare-earth compounds and metals, 2021 is greater than 95% and 2025 is 67%. Using those published values, the reduction exceeds 28 percentage points. The exact 2021 level is not supplied, so an exact point decline would be unsupported. The 2024 to 2025 comparison is fully numeric: 53% to 67%, a 14-point increase. (AMR comparison of USGS rare-earth reliance, May 2026).
Does a changing reliance percentage prove imports changed by the same amount?
No. A ratio can move because its numerator changes, its consumption denominator changes, stock adjustments change or several components move together. The underlying table is needed to identify those arithmetic changes. A reliance share alone is not enough to establish the direction of every gross import category.
The rare-earth chapter provides a particularly useful caution: it reports a large increase in imported compounds and metals quantities in 2025 while their estimated import value falls, reflecting a shift toward lower-value products. Mass, dollar value, material mix and reliance are different measures. A decline in import value is not by itself a decline in physical dependence. (USGS, rare-earth domestic discussion p.152, May 2026).
Are all five-year accounting definitions unchanged?
No. The cobalt chapter specifies that government-stock changes are included in its 2021 to 2022 definition but no longer included beginning in 2023. Nickel notes significant revisions to secondary-scrap estimates following a review of updated data. Those notes limit how confidently a historical movement can be interpreted as an otherwise identical economic change. (USGS, cobalt p.71 and nickel p.133 footnotes, May 2026).
The table is one report vintage. It is not a sequence of unrevised values copied from five different annual reports. A later USGS edition may revise history. Keeping the pinned PDF, exact page references and transcription in the bundle makes this edition's calculations reproducible even when later estimates change.
Which statistic should a researcher or journalist use?
Choose the statistic that matches the sentence's question. A question about how much consumption is met through net imports needs reliance. A question about where imported material comes from needs trade origins. A question about extraction needs mine output. A question about processing needs the appropriate processing-stage data.

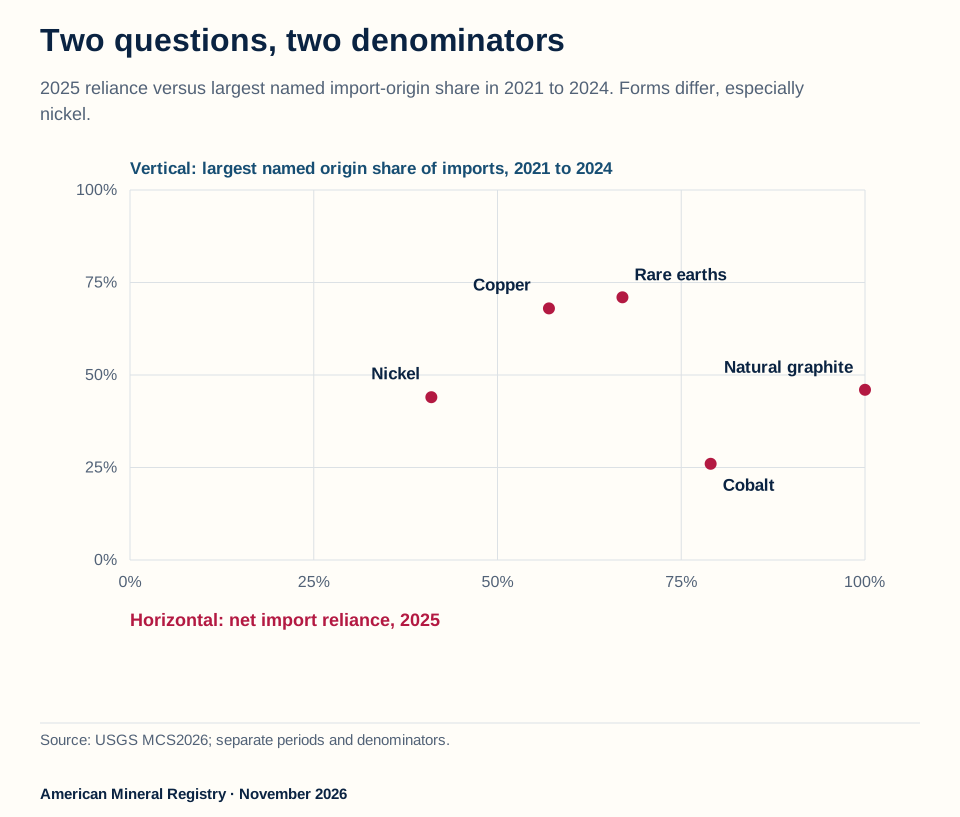
Figure 6 in text
2025 net import reliance versus 2021 to 2024 leading import origin shares for five materials; no composite risk score.
Two questions, two denominators 2025 reliance versus largest named import-origin share in 2021 to 2024. Forms differ, especially nickel. 0% 0% 25% 25% 50% 50% 75% 75% 100% 100%
Copper
Cobalt
Natural graphite
Nickel
Rare earths
Horizontal: net import reliance, 2025
Vertical: largest named origin share of imports, 2021 to 2024 Source: USGS MCS2026; separate periods and denominators.
American Mineral Registry · November 2026
Additional phone figure text: Reliance 2025: 57% · Import origin: Chile · 68% of stated imports, 2021 to 2024 · Reliance 2025: 79% · Import origin: Norway · 26% of stated imports, 2021 to 2024 · Reliance 2025: 100% · Import origin: China + Hong Kong · 46% of stated imports, 2021 to 2024 · Reliance 2025: 41% · Import origin: Canada · 44% of stated imports, 2021 to 2024 · Reliance 2025: 67% · 71% of stated imports, 2021 to 2024
Source and data: AMR calculations from USGS MCS 2026
Permanent link to this figure’s text and data · Sources and context
How do reliance and supplier concentration differ in practice?
Natural graphite has 100% reliance while its largest named origin supplies 46% of the reported imports. Rare-earth compounds and metals have 67% reliance while their largest named origin supplies 71% of that import distribution. Those two percentages have different denominators. Neither material can be assigned a single meaningful “dependence score” by simply averaging them.
Two different dimensions, with different periods and commodity boundaries.
| Material | 2025 net import reliance % | Leading import origin share 2021 to 2024 % | Three largest named origin shares % |
|---|---|---|---|
| Copper | 57 | 68 | 91 |
| Cobalt | 79 | 26 | 56 |
| Natural graphite | 100 | 46 | 72 |
| Nickel | 41 | 44 | 63 |
| Rare earths | 67 | 71 | 89 |
Download the complete matching data (CSV).
Nickel illustrates a further boundary: its 41% reliance includes scrap in total apparent consumption, while the origin distribution on this page describes primary nickel imports. Those are useful source-reported measures, but multiplying 41% by Canada's 44% would not establish Canada's share of total U.S. nickel use. The material scopes do not match, and the windows also differ.
The same caution applies to multiplying any 2025 reliance share by a 2021 to 2024 source share. Even when forms appear close, the time windows and stock treatment differ. This crosswalk places the observations beside one another so their scope is visible. It does not manufacture a current consumption-by-country matrix from mismatched inputs.
What belongs in a defensible citation?
A reliance citation needs the material form, year, percentage and the source's consumption qualification. A source-share citation needs the imported form, country, trade window and imports denominator. A mine-share citation needs the output basis, estimate year and both matching production quantities. The finding cards on this page preserve those details and link to the supporting table.
AMR's calculated top-three sums and mine ratios should be credited as calculations from USGS, rather than described as an independent AMR survey or a new observation of physical shipments. The underlying reported facts remain attributed to USGS. The reusable files separate the transcribed source values from the derived comparison, making that distinction inspectable.
Which claims would need additional evidence?
An assertion about the disruption probability of a supplier, the ability to replace a specific material, the lead time of a qualified processing plant or the exposure of a named manufacturer needs evidence beyond this panel. A country share is not a probability of interruption. A broad commodity total does not establish whether a particular grade meets an industrial specification.
Likewise, a high import share does not establish the commercial value of a particular U.S. mineral property. That would require evidence about the actual resource, title, extraction economics, processing, infrastructure and transaction terms. Public commodity statistics and private property valuations should keep their separate purposes.
For a wider public mineral-finance question, see federal mineral revenue disbursements. The AMR statistics library contains additional references. Each article addresses its own source-defined question; combining their numbers requires checking the denominator again.
Methodology and Sources
AMR pinned the revised May 2026 USGSMineral Commodity Summaries on November 14,2026. Five materials were selected before drafting for complete essential evidence. Reliance uses 2025 estimates and 2021 to 2025 history; origins use 2021 to 2024. Exact material forms, stock notes and historical greater-than bounds remain attached. Copper’s thousand-ton quantities are converted to metric tons. U.S. mine shares divide matching quantities by the rounded world total. Named top-three import shares preserve Other separately and retain source ties. The crosswalk does not infer a composite risk index, an unreported refinery matrix or current consumption by supplier country. Transcribed source entries, exact pages, calculations and full tables accompany the standard-library reproduction program. Display rounding follows calculation. The detailed source limits and reproduction steps are below.
How are source inconsistencies and rounding handled?
The natural graphite chapter's narrative says China produced 82% of world output in 2025, while its table lists 1.4 million metric tons for China and a rounded 1.8 million world total. Those table entries imply a different approximate ratio. This article does not repeat the narrative percentage as if it reconciled with that table. Its production calculations consistently use the displayed table quantities and identify the rounded denominator. The selected-country download is a comparison, not a complete country sum.
Reported origin shares are whole percentages and sum to 100 in each selected distribution. AMR adds them without introducing extra precision. Mine ratios and output shares remain approximate estimates. Other is not a country; no full supplier Herfindahl index is published from the incomplete disaggregation. Historical inequalities remain categorical rather than being plotted as exact point values.
Reproduce and extend the panel
The bundle includes the pinned USGS PDF, a source transcription with page references, the complete crosswalk, origin rows, reliance history and selected mine comparisons. Run the standard-library analysis program to regenerate the CSVs. The figure program generates the same SVG exports from those output tables. The source hash identifies the exact report edition.
A later edition should verify every selected chapter, footnote, material form and revision rather than replacing only the headline percentage. Adding another material requires closing all essential comparison fields first. An unreported value must not become zero, and a restricted or withheld entry must not become an assertion that production is absent.
Frequently asked questions
Does the United States import all its rare earths?
No. This report estimates domestic mine and compounds/metals production. It reports 67% net import reliance specifically for compounds and metals in 2025 and a separate net-export status for concentrates. The material stage belongs in the answer. (USGS, rare earths, May 2026).
Does China supply all U.S. cobalt imports?
The selected 2021 to 2024 USGS distribution for cobalt metal, oxide and salts names Norway 26%, Finland 16%, Canada 14%, Japan 14% and Other 30%. This is a different question from where cobalt is mined globally or refined. (USGS, cobalt, May 2026).
Why is nickel reliance lower than some battery supply-chain headlines suggest?
The headline 41% includes nickel in scrap within total apparent consumption. USGS says reliance excluding scrap would be nearly 100%. Use the definition that matches the question rather than treating the two scopes as conflicting observations. (USGS, nickel footnote 6, May 2026).
Is a net importer unable to export the same commodity?
No. Net imports account for imports and exports together, with the source's relevant adjustments. Gross exports can coexist with net import reliance. Different commodity forms can also move in opposite trade directions.
Can I use these values in a chart or article?
The specific finding links, source-qualified copy text and matching CSVs make reuse straightforward. Preserve the original source, material form, period, denominator and estimate status. The AMR comparison and original figures carry the stated reuse licence; underlying producer attribution remains attached.
Glossary
- Net import reliance: The source's defined net import requirement relative to specified apparent consumption.
- Apparent consumption: A commodity accounting measure, with components and adjustments defined in its chapter.
- Primary material: Material from the primary production chain, distinct from the secondary or recycled category used in the source.
- REO equivalent: Rare-earth-oxide equivalent, the stated mass basis for the rare-earth tables.
- Import origin share: A named origin's share of the specified import category and trade window.
- Concentrate: An intermediate mineral product, distinct from a refined metal or downstream component.
- Percentage point: The arithmetic difference between percentages on a common scale.
- Rounded world total: A producer's approximate global production denominator, not an exact country sum.