This reference connects the national figures to regions, six winters, weather cases, prices, consumption, heating shares and monthly timing. AMR adds a reproducible price and quantity comparison. Every chart has HTML values, finding links and downloads. The numerical edition is pinned to the November workbook.
Key Takeaways
- The national 2026 to 2027 base forecast is $640 for natural gas, -8.5% versus the previous winter’s estimate. (AMR calculations from EIA, Nov 2026).
- The national 2026 to 2027 base forecast is $2,179 for heating oil, 24.6% versus the previous winter’s estimate. (AMR calculations from EIA, Nov 2026).
- The national 2026 to 2027 base forecast is $1,186 for electricity, 3.4% versus the previous winter’s estimate. (AMR calculations from EIA, Nov 2026).
- The national 2026 to 2027 base forecast is $1,260 for propane, -2.4% versus the previous winter’s estimate. (AMR calculations from EIA, Nov 2026).
- The national electricity base forecast assigns 44.9% to space heating and 55.1% to other uses of electricity. (AMR calculations from EIA, Nov 2026).
- National natural gas expenditure assigns 79.2% to space heating and 20.8% to other uses of gas. (AMR calculations from EIA, Nov 2026).
- National heating oil expenditure assigns 84.6% to space heating; propane assigns 77.5%. (AMR calculations from EIA, Nov 2026).
- The warmer and colder national gas cases are about $620 and $679, versus a $640 base forecast. (AMR calculations from EIA, Nov 2026).
- The national colder electricity case is about 3.9% above its base forecast, not a universal household weather response. (AMR calculations from EIA, Nov 2026).
- The heating oil expenditure increase decomposes into about +$690 from price, minus $186 from quantity and minus $73 interaction. (AMR calculations from EIA, Nov 2026).
- The source reports 15 fuel and region combinations, with no propane West expenditure row or four-region oil matrix. (AMR calculations from EIA, Nov 2026).
- The source-defined season is November through March, crossing the calendar-year boundary. (AMR calculations from EIA, Nov 2026).
- Natural gas is about 45.8% of national main-heating-fuel households in 2026 to 2027; electricity is about 42.7%. (AMR calculations from EIA, Nov 2026).
- Six seasons per case preserve estimated history and the current forecast. (AMR calculations from EIA, Nov 2026).
What is the average winter energy bill, and what does it include?
National figures group households by their main heating fuel. Gas measures gas spending in homes mainly heated with gas; electricity measures electricity spending in homes mainly heated with electricity. These are different homes, rather than a controlled comparison of one house operating four systems.

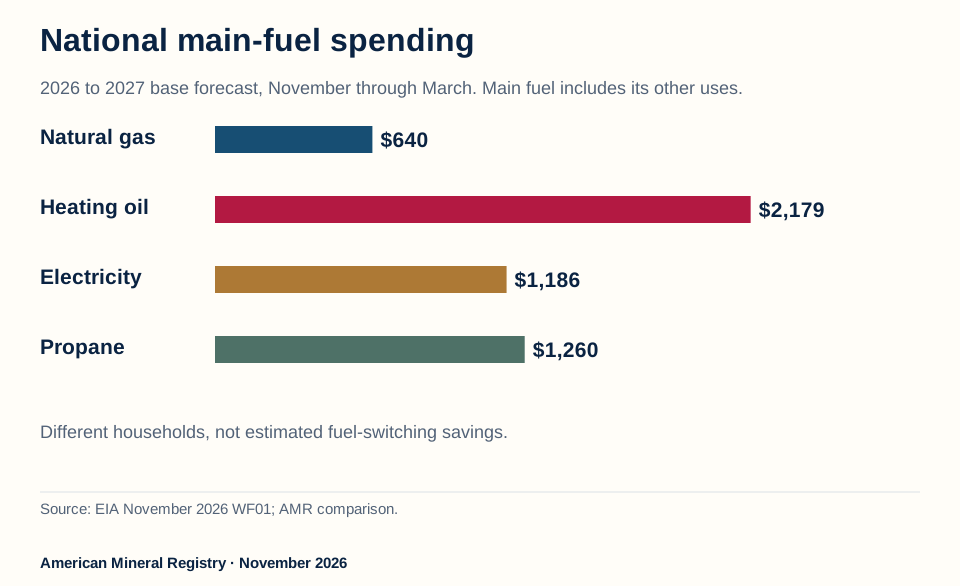
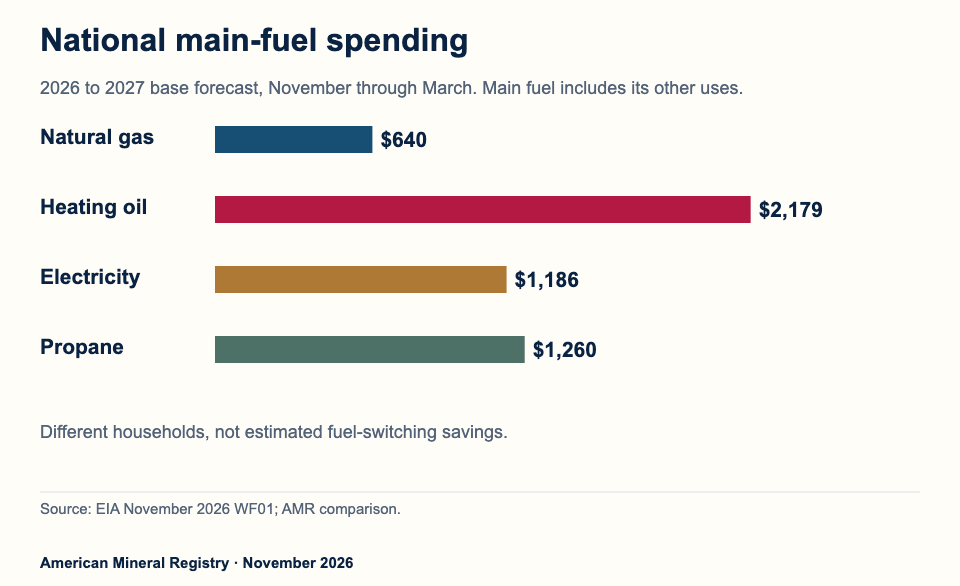
Figure 1 in text
National base forecast: gas $640, electricity $1186, propane $1260 and oil $2179; different homes, not conversion savings.
National main-fuel spending 2026 to 2027 base forecast, November through March. Main fuel includes its other uses.
Natural gas
$640
Heating oil
$2,179
Electricity
$1,186
Propane
$1,260 Different households, not estimated fuel-switching savings. Source: EIA November 2026 WF01; AMR comparison.
American Mineral Registry · November 2026
Source and data: AMR calculations from EIA November workbook
Permanent link to this figure’s text and data · Sources and context
Which amounts belong in a winter costs comparison?
The table below keeps the fuel, household group, season and forecast vintage together. The 2025 to 2026 column is the previous winter's producer estimate in the same November 2026 workbook. The next column is the 2026 to 2027 base forecast. Comparing within the same release avoids accidentally combining a revised historical estimate with an older forecast.
National main-fuel expenditure: previous estimate and base forecast, November workbook.
| Main fuel | 2025 to 2026 estimate USD | 2026 to 2027 forecast USD | Change % |
|---|---|---|---|
| Natural gas | $700 | $640 | -8.5 |
| Heating oil | $1,748 | $2,179 | 24.6 |
| Electricity | $1,147 | $1,186 | 3.4 |
| Propane | $1,291 | $1,260 | -2.4 |
Download the complete matching data (CSV).
For a household budget, start with the home's actual main heating fuel and the geographic category that fits. Then ask which other uses share the same meter or fuel delivery. Gas can serve cooking and water heating; electricity can serve lights, refrigeration, computers and many other appliances. The source includes these uses when they consume the main heating fuel. A second fuel used elsewhere in the home can fall outside the headline amount. (EIA, household coverage, Oct 2026).
That distinction also matters for coverage of heating costs in the press. Calling the national electricity amount a space-heating bill would assign every included dollar to heating. Calling it every American household's electricity bill would replace the source population with a much larger and different one. The source's main-heating-fuel wording is a necessary part of the statistic. For annual state electricity account averages rather than a winter main fuel forecast, use the residential electricity bill comparison.
Why does the regional comparison look different?
The complete base forecast covers five natural gas rows, five electricity rows, four propane rows and one heating oil row, including the published national averages. Those are 15 source-reported combinations. EIA does not publish a separate heating oil expenditure row for every region or a propane West row in this table. This reference preserves that domain rather than presenting unreported cells as zeros.
Every source-reported base forecast combination, winter 2026 to 2027.
| Main fuel | Region | Base forecast USD |
|---|---|---|
| Natural gas | Northeast | $870 |
| Natural gas | Midwest | $615 |
| Natural gas | South | $522 |
| Natural gas | West | $587 |
| Natural gas | U.S. average | $640 |
| Heating oil | U.S. average | $2,179 |
| Electricity | Northeast | $1,612 |
| Electricity | Midwest | $1,363 |
| Electricity | South | $1,076 |
| Electricity | West | $1,140 |
| Electricity | U.S. average | $1,186 |
| Propane | Northeast | $1,694 |
| Propane | Midwest | $1,325 |
| Propane | South | $1,165 |
| Propane | U.S. average | $1,260 |
Download the complete matching data (CSV).
Within natural gas, the Northeast base forecast is $870, compared with $522 in the South. Within electricity, the corresponding values are $1,612 and $1,076. These comparisons keep the main fuel fixed, but they still combine differences in climate, homes, equipment, consumption and prices. They describe the households represented by each modeled average; they do not isolate a regional tariff effect. (AMR comparison of EIA regional rows, Nov 2026).
National and regional averages are not interchangeable. An average household in a mild region need not resemble the national household mix. Nor can a reader reconstruct the national figure by giving four regions equal weight. Household counts and fuel use differ. EIA specifically describes its propane expenditure average as a household-weighted average of the Northeast, Midwest and South. (EIA, propane expenditure note, Oct 2026).
Does the lowest average identify the cheapest heating system?
It identifies the smallest published expenditure among the represented groups. Selecting equipment requires a comparison for a particular home: useful heat required, local rates, system efficiency, installation cost, maintenance and any other material costs. This workbook is not a paired-household experiment and does not supply a conversion payback calculation.
EIA explicitly cautions that differences among the housing populations complicate comparisons across fuels. A lower published average therefore cannot be copied into an estimate of the savings from switching a particular home. Use the table to understand national exposure and within-fuel changes. Use a properly specified home-level assessment for a conversion decision. (EIA, interpretation of expenditure averages, Oct 2026).
How have winter household costs changed across six seasons?
The historical panel places the forecast beside five preceding winters. All amounts are nominal and come from one source edition. Earlier values are producer estimates; the latest remains a forecast. This prevents one change from standing in for a long-run pattern.

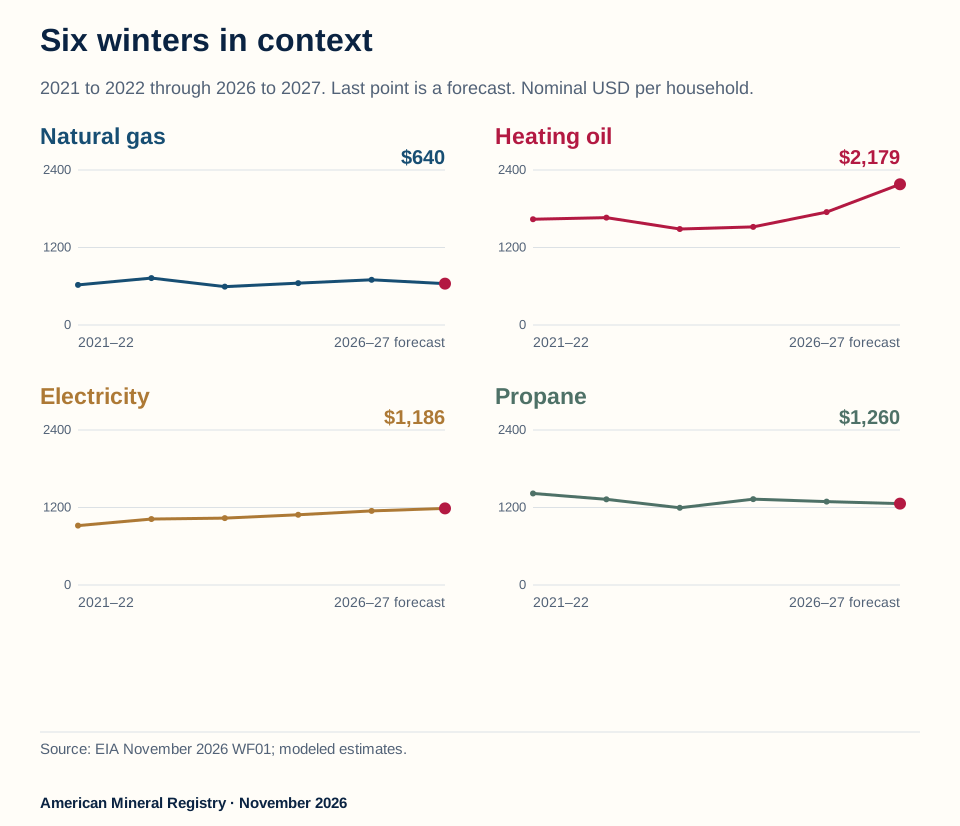
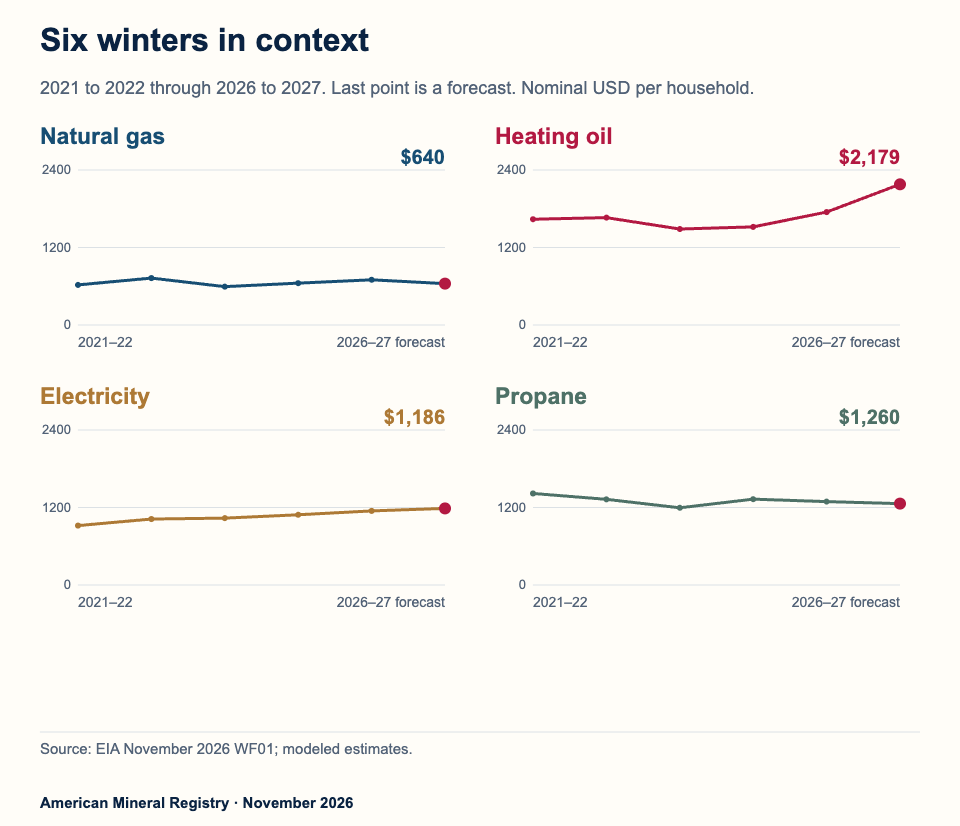
Figure 2 in text
National main-fuel modeled expenditure history across six winters, with 2026 to 2027 marked as forecast.
Six winters in context 2021 to 2022 through 2026 to 2027. Last point is a forecast. Nominal USD per household.
Natural gas 0 1200 2400 2021–22 2026–27 forecast
$640
Heating oil 0 1200 2400 2021–22 2026–27 forecast
$2,179
Electricity 0 1200 2400 2021–22 2026–27 forecast
$1,186
Propane 0 1200 2400 2021–22 2026–27 forecast
$1,260 Source: EIA November 2026 WF01; modeled estimates.
American Mineral Registry · November 2026
Source and data: AMR calculations from EIA November workbook
Permanent link to this figure’s text and data · Sources and context
What does the national history show?
The full national sequence is below. It is useful for questions such as whether a forecast is above the previous season, above an earlier peak in this panel or simply moving in a different direction from another fuel. Those are descriptive comparisons, not a forecast of what the next release will say.
National nominal expenditure history, producer estimates plus 2026 to 2027 forecast.
| Winter | Gas USD | Oil USD | Electricity USD | Propane USD |
|---|---|---|---|---|
| 2021-22 | $621 | $1,638 | $920 | $1,417 |
| 2022-23 | $726 | $1,662 | $1,021 | $1,327 |
| 2023-24 | $594 | $1,486 | $1,036 | $1,196 |
| 2024-25 | $648 | $1,519 | $1,087 | $1,329 |
| 2025-26 | $700 | $1,748 | $1,147 | $1,291 |
| 2026-27 | $640 | $2,179 | $1,186 | $1,260 |
Download the complete matching data (CSV).
For natural gas, the national amount is $621 in 2021 to 2022, $700 in 2025 to 2026 and a forecast $640 in 2026 to 2027, after rounding. Electricity is $920, $1,147 and $1,186 at those same endpoints. Heating oil is $1,638, $1,748 and $2,179. Propane is $1,417, $1,291 and $1,260. Each sequence concerns its own main-heating-fuel population. (AMR comparison of EIA seasonal history, Nov 2026).
A sequence of dollar amounts cannot establish whether the typical home is using more energy, facing a higher price or both. It also cannot establish whether the burden on income increased. An affordability measure needs an appropriate income denominator, and an inflation-adjusted comparison needs a declared deflator. This reference does not silently substitute either one for nominal expenditure.
Are the older amounts observed household bills?
They are EIA's modeled household estimates in this edition. The workbook footnote describes a framework based on the 2020 Residential Energy Consumption Survey, adjusted with actual and projected heating degree days and associated prices. It is not a newly collected panel of the same households' invoices in every winter. (EIA, workbook notes, Nov 2026).
That matters when writing about changes. A phrase such as “the modeled national average rose” preserves what the table measures. A claim that every household paid more, or that a specific share of families experienced an increase, would require household-level distribution evidence that this source does not provide. An average does not reveal the median bill, the spread of bills or the number of people with arrears. For reported household hardship rather than modeled spending, use the household energy insecurity comparison.
The historical rows are kept together with prices and physical consumption in the downloadable seasonal panel. A reader can inspect the complete 90-row file, covering six seasons across all 15 source-reported combinations. Source sheet and cell references travel with the values, so a historical comparison can be audited without relying on the chart image.
How should a future release be compared with this edition?
Match the source vintage, the season definition and the household group first. The November workbook is a fixed input here, identified by its download and hash in the reproduction bundle. A later workbook at the same producer URL may contain different values. That does not change which input this analysis used.
EIA's explanatory article states that its body analysis was published with the October outlook, while its table download offers a November workbook. This reference uses the November workbook for all numerical tables and the explanatory article for definitions. It does not combine the October article's rounded numerical claims with the November file's cells. (EIA, edition notice and downloads, Oct and Nov 2026).
Preserving that distinction makes a release archive more useful. A forecast revision is a change in an estimate for the same target season. A year-over-year change compares different seasons. Neither should be labeled the other. The permanent historical panel and transparent calculation method allow both kinds of work when a later edition is added.
How much could warmer or colder weather change spending?
EIA supplies warmer and colder cases alongside its base forecast. These are defined weather scenarios, not confidence intervals, guaranteed limits or a statement that all possible outcomes fit inside the range. Prices as well as consumption can differ between the cases.

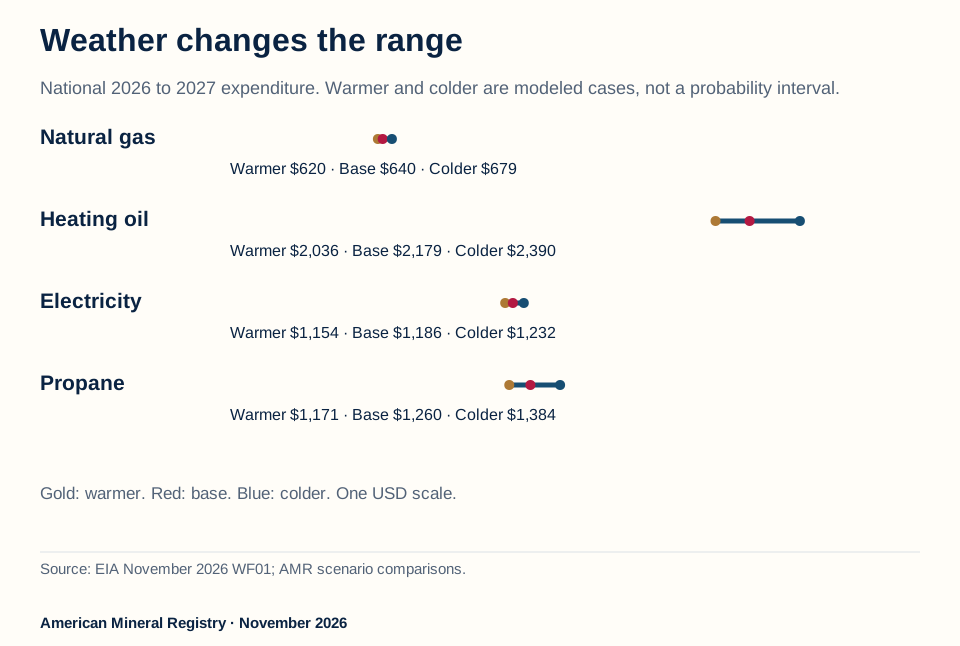
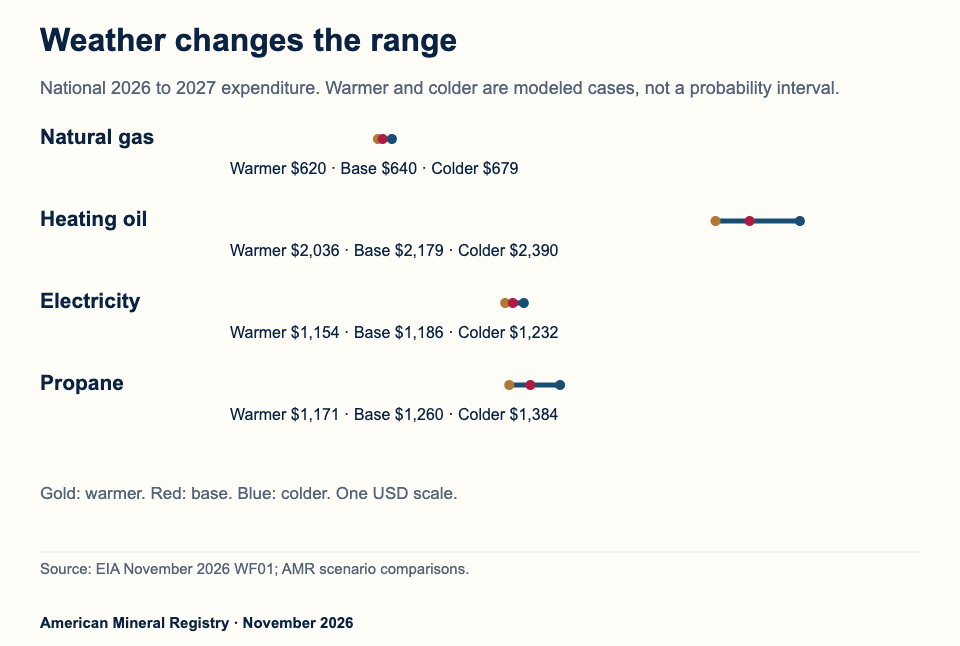
Figure 3 in text
National warmer, base and colder scenario expenditures for four fuels, winter 2026 to 2027.
Weather changes the range National 2026 to 2027 expenditure. Warmer and colder are modeled cases, not a probability interval.
Natural gas Warmer $620 · Base $640 · Colder $679
Heating oil Warmer $2,036 · Base $2,179 · Colder $2,390
Electricity Warmer $1,154 · Base $1,186 · Colder $1,232
Propane Warmer $1,171 · Base $1,260 · Colder $1,384 Gold: warmer. Red: base. Blue: colder. One USD scale. Source: EIA November 2026 WF01; AMR scenario comparisons.
American Mineral Registry · November 2026
Source and data: AMR calculations from EIA November workbook
Permanent link to this figure’s text and data · Sources and context
What are the national scenario amounts?
For 2026 to 2027, natural gas spending ranges from a modeled $620 in the warmer case to $679 in the colder case, with $640 in the base case. Heating oil ranges from $2,036 to $2,390, electricity from $1,154 to $1,232 and propane from $1,171 to $1,384. These are the source's cases, rounded to the nearest dollar. (AMR comparison of EIA scenarios, Nov 2026).
National weather scenarios, winter 2026 to 2027 forecast. Changes use each fuel’s base forecast as denominator.
| Main fuel | Warmer USD | Base USD | Colder USD | Colder vs base % |
|---|---|---|---|---|
| Natural gas | $620 | $640 | $679 | 6.0 |
| Heating oil | $2,036 | $2,179 | $2,390 | 9.7 |
| Electricity | $1,154 | $1,186 | $1,232 | 3.9 |
| Propane | $1,171 | $1,260 | $1,384 | 9.9 |
Download the complete matching data (CSV).
AMR reports both changes from the base forecast and changes from the preceding winter in the complete 45-row scenario download. The denominators answer different questions. A cold case can be more expensive than the base forecast and still be below the previous winter's modeled spending. Natural gas is one example in this edition: its colder case is above the base case but remains below the 2025 to 2026 estimate. (AMR calculations from EIA, Nov 2026).
Why does 10% colder not mean a 10% higher bill?
EIA's side cases use heating degree days above or below the base weather assumption. Heating degree days measure the difference between a day's average temperature and a base of 65 degrees Fahrenheit when the average is below that base. They are an accumulated measure of heating demand, not a percentage change in the thermometer reading. (EIA, weather method, Oct 2026).
The bill response need not match the degree-day change. Some of the included fuel serves non-heating uses; retail prices can change between cases; and the reported expenditure is the product of the modeled price and quantity. EIA explains that weather affects both the energy needed to heat a house and market conditions affecting prices. The source's scenarios account for both channels. (EIA, weather and spending, Oct 2026).
In the national gas comparison, the colder-case expenditure is about 6.0% above the base case. For electricity it is about 3.9% above, heating oil about 9.7% and propane about 9.9%. These are expenditure responses calculated from the unrounded source cases. They are not general elasticities that can be applied to any home or any weather deviation. (AMR calculations from EIA, Nov 2026).
Can the scenario range be used as an emergency budget ceiling?
It is a structured planning reference, with useful information about the direction and magnitude of the source's modeled weather cases. It does not include every possible price, local interruption, equipment failure or household behavior. A personal budget needs the actual home, rates and usage history, alongside an appropriate contingency chosen for that household.
The full regional cases remain important. A national amount averages across homes and weather patterns, while a local winter can differ from the national pattern. The download retains all reported regional base, warmer and colder cases, with the original fuel units and source-cell locations. There is no inferred scenario for an unreported geography.
For a published statistic, retain the case name and the base of comparison. “Colder-case gas spending is 6.0% above the base forecast” is reproducible here. “A cold winter raises everyone's gas bill by 6.0%” adds a household-level causal claim that the source does not establish.
Is a bill increase caused by higher prices or more energy use?
Both can contribute. AMR decomposes each source-covered change into a price component, a consumption component and their interaction. This is an exact accounting bridge between the previous winter's estimate and the current base forecast. It does not claim to identify the independent cause of weather, prices or household behavior.

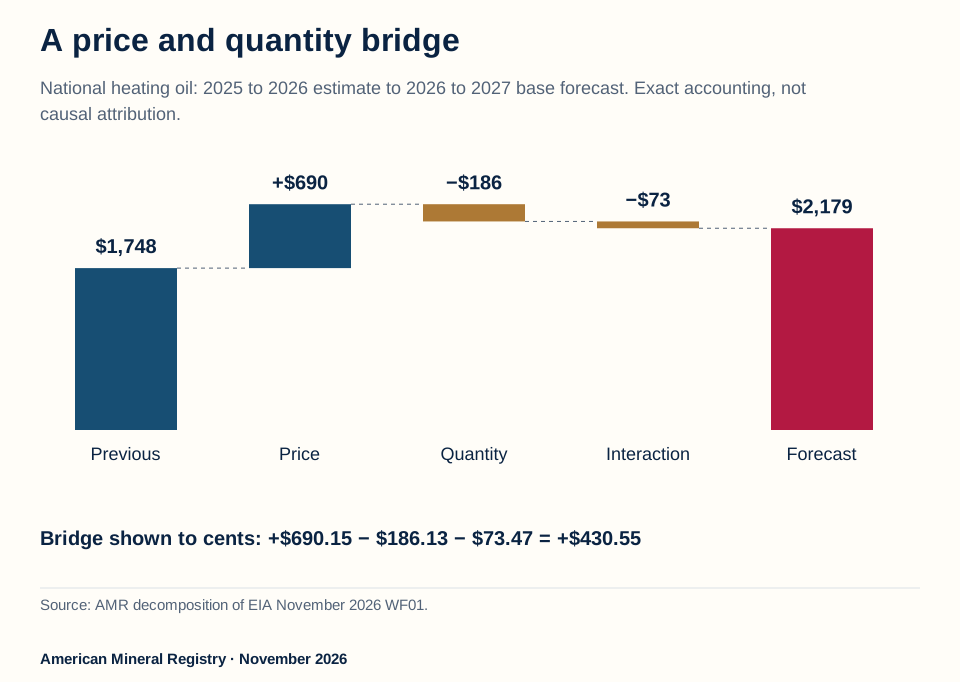
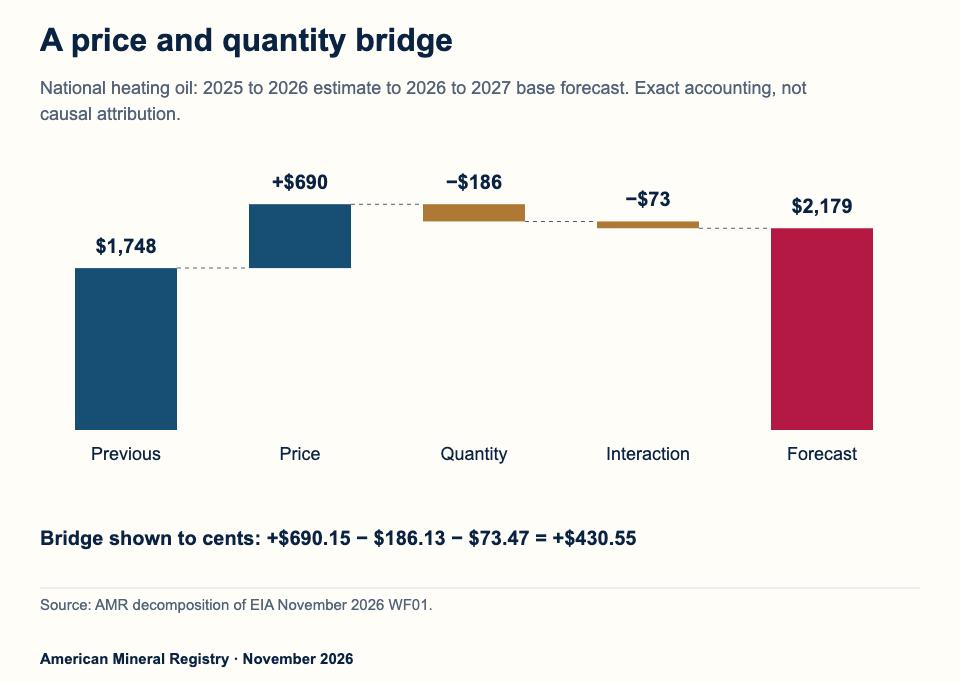
Figure 4 in text
National heating-oil expenditure change: price plus 690.15, quantity minus 186.13, interaction minus 73.47, total plus 430.55 USD.
A price and quantity bridge National heating oil: 2025 to 2026 estimate to 2026 to 2027 base forecast. Exact accounting, not causal attribution.
$1,748 Previous
+$690 Price
−$186 Quantity
−$73 Interaction
$2,179 Forecast
Bridge shown to cents: +$690.15 − $186.13 − $73.47 = +$430.55 Source: AMR decomposition of EIA November 2026 WF01.
American Mineral Registry · November 2026
Additional phone figure text: $1,748.40 · $2,178.95 · Price + quantity + interaction = $430.55 · increase, rounded to cents.
Source and data: AMR calculations from EIA November workbook
Permanent link to this figure’s text and data · Sources and context
How does the calculation work?
Write spending as price multiplied by quantity. If the old price and quantity are P 0 and Q 0, and the new ones are P 1 and Q 1, the change in spending equals three terms: the price change multiplied by Q 0, the quantity change multiplied by P 0, and the price change multiplied by the quantity change. Keeping the third term makes the arithmetic reconcile exactly.
The choice of baseline is explicit. The price component values the change in price at the old quantity. The quantity component values the change in use at the old price. The interaction accounts for the fact that both changed together. Another decomposition convention could divide the interaction between the first two terms, so authors should retain this convention when quoting the components.
National dollar bridge,2025 to 2026 estimate to 2026 to 2027 base forecast. Display rounding can affect addition.
| Main fuel | Price USD | Quantity USD | Interaction USD | Total change USD |
|---|---|---|---|---|
| Natural gas | -50.74 | -9.61 | 0.70 | -59.65 |
| Heating oil | 690.15 | -186.13 | -73.47 | 430.55 |
| Electricity | 34.95 | 3.81 | 0.12 | 38.88 |
| Propane | -0.88 | -30.55 | 0.02 | -31.40 |
Download the complete matching data (CSV).
The national heating oil bridge is particularly instructive. Its price component is approximately positive $690, its quantity component negative $186 and its interaction negative $73, giving a total increase of approximately $431 after rounding. The source therefore projects lower physical consumption alongside higher spending. Quoting only the consumption decline would miss the bill result. (AMR decomposition of EIA, Nov 2026).
Why not just add the price and usage percentage changes?
Because price and quantity multiply. Adding their two percentage changes omits the interaction. The exact spending factor is the price factor multiplied by the quantity factor. This applies whether both rise, both fall or move in opposite directions. The complete decomposition file includes both percentage changes and all dollar components for every source-covered case.
For the national natural gas group, the modeled spending decline is about $60, comprising a price component of about negative $51, a quantity component of negative $10 and a positive interaction below $1. For electricity, the increase is about $39, with about $35 assigned to the price term and $4 to quantity before final rounding. These are calculations from the source values, not survey responses about why households changed their use. (AMR decomposition of EIA, Nov 2026).
Which units make the comparison valid?
Natural gas consumption is reported in Mcf, meaning thousand cubic feet. Oil and propane use gallons. Electricity uses kilowatt-hours. The workbook reports electricity prices in cents per kilowatt-hour, while the AMR calculation files convert them to dollars per kilowatt-hour before multiplying. Failing to divide cents by 100 would produce a bill 100 times too large.
A physical quantity cannot be compared directly across these units. One Mcf, one gallon and one kilowatt-hour are different measurements, and useful heat also depends on equipment and conditions. This article compares expenditures within the source's groups; it does not create an equipment-efficiency ranking from raw fuel volumes. Workbook prices marked with the tax footnote exclude taxes, another reason the figures need not equal an actual invoice. (EIA, workbook units and notes, Nov 2026).
The bridge can explain arithmetic even when it cannot explain causation. To establish why a retail price changed, a separate analysis would need evidence about fuel procurement, delivery, regulated rates and other relevant costs. This reference keeps that question separate from the calculation it can fully reproduce.
How much of the main-fuel bill actually goes to space heating?
In the 2026 to 2027 national base forecast, space heating accounts for 79.2% of included gas spending, 84.6% of heating oil, 77.5% of propane and 44.9% of electricity. The rest serves non-heating uses of the same fuel. (AMR calculations from EIA monthly table, Nov 2026).

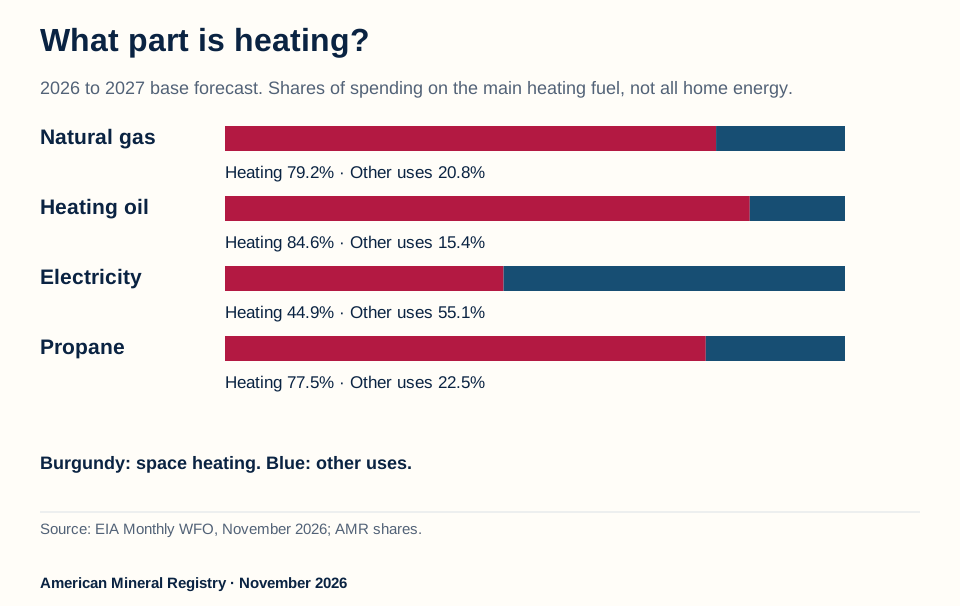
Figure 5 in text
National main-fuel heating and non-heating expenditure shares; electricity 44.9 percent heating and 55.1 percent other uses.
What part is heating? 2026 to 2027 base forecast. Shares of spending on the main heating fuel, not all home energy.
Natural gas Heating 79.2% · Other uses 20.8%
Heating oil Heating 84.6% · Other uses 15.4%
Electricity Heating 44.9% · Other uses 55.1%
Propane Heating 77.5% · Other uses 22.5%
Burgundy: space heating. Blue: other uses. Source: EIA Monthly WFO, November 2026; AMR shares.
American Mineral Registry · November 2026
Source and data: AMR calculations from EIA November workbook
Permanent link to this figure’s text and data · Sources and context
Why is the electricity distinction especially important?
The electricity main-heating group has a forecast total of about $1,186, of which about $533 is assigned to space heating and $653 to non-heating uses. Labeling all $1,186 as heating alone would overstate the source's heating component by including its non-heating amount. (AMR calculations from EIA, Nov 2026).
National base forecast, same-fuel heating and non-heating expenditures,2026 to 2027.
| Main fuel | Heating USD | Other uses USD | Heating share % | Other share % |
|---|---|---|---|---|
| Natural gas | $507 | $133 | 79.2 | 20.8 |
| Heating oil | $1,844 | $335 | 84.6 | 15.4 |
| Electricity | $533 | $653 | 44.9 | 55.1 |
| Propane | $977 | $283 | 77.5 | 22.5 |
Download the complete matching data (CSV).
These are expenditure shares, not shares of physical consumption and not shares of all household spending. A household's total energy budget can include fuel used on a different meter or for a different purpose. The denominator here stays the source's expenditure on the primary heating fuel during the five-month season.
EIA models space-heating use from RECS and weather information, while its non-heating uses follow separate assumptions. Its coverage can include secondary heating equipment if that equipment uses the same fuel as the main system. If a secondary heater uses a different fuel, its consumption and spending fall outside the main-fuel estimate. (EIA, space and secondary heating method, Oct 2026).
Can heating shares explain differences in weather sensitivity?
They help explain why a whole main-fuel bill can respond less than the heating-specific portion. A non-heating component does not have to rise in direct proportion to degree days. But the source also changes retail prices across scenarios, so dividing the bill response by a heating share would not isolate a clean household weather effect.
The national comparison is a summary, and the complete download includes both winters for every reported fuel and region combination. A reader investigating the South's electricity use can inspect its own row instead of applying a national heating share. Conversely, a national article should not lift one cold region's share and describe it as the United States.
How should this change a personal estimate?
Separate the main fuel from the household's complete energy purchases. Compare the source's seasonal spending with the corresponding part of the home's own records. Then distinguish space heating, other uses and bill items the source does not model in the same way. This avoids comparing a delivery invoice, a meter bill and a national modeled average as though all three have identical boundaries.
Budget billing can also change when cash leaves a household without changing the energy used during the season. The source measures modeled fuel consumption and associated expenditure, not each household's payment-plan schedule. Prepaid fuel, existing tank inventory and contract prices require their own treatment. EIA states that its heating oil and propane calculation assumes the prevailing retail price when fuel is used and does not account for earlier purchases or previously contracted prices. (EIA, retail-price timing, Oct 2026).
Who is exposed to these costs, and when does the spending occur?
The household mix and the monthly pattern answer two remaining questions: how widespread each main heating fuel is, and how the seasonal amount is distributed across months. Neither follows directly from which fuel has the largest dollar average.

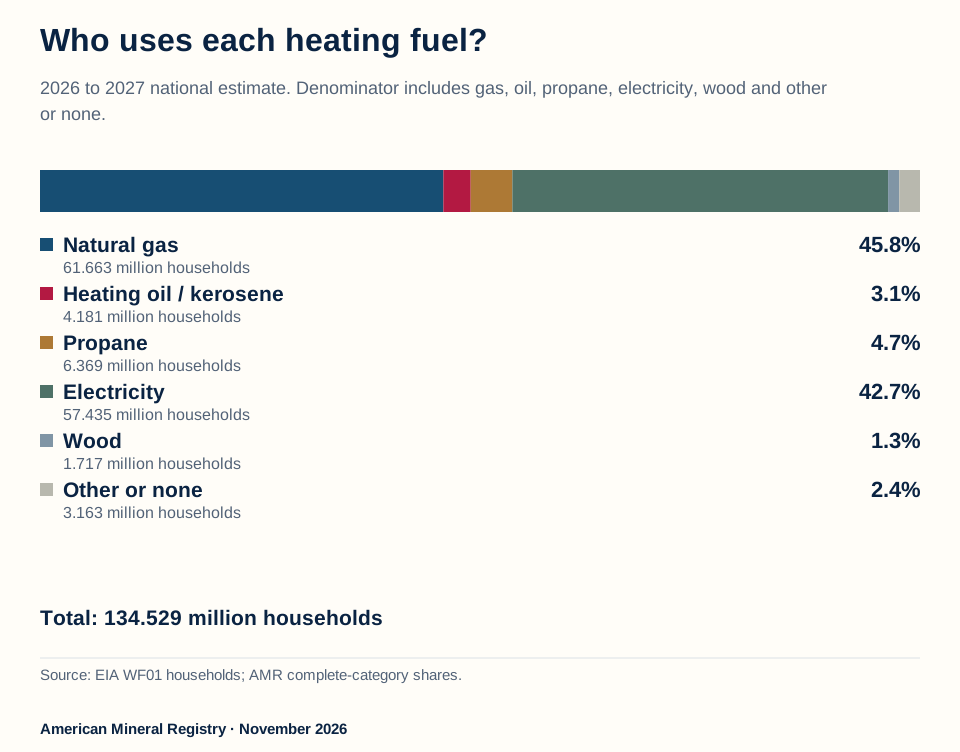
Figure 6 in text
National 2026 to 2027 main-heating-fuel households: gas 45.8 percent, electricity 42.7 percent, propane 4.7 percent, oil 3.1 percent, wood 1.3 percent and other 2.4 percent.
Who uses each heating fuel? 2026 to 2027 national estimate. Denominator includes gas, oil, propane, electricity, wood and other or none.
Natural gas
45.8% 61.663 million households
Heating oil / kerosene
3.1% 4.181 million households
Propane
4.7% 6.369 million households
Electricity
42.7% 57.435 million households
Wood
1.3% 1.717 million households
Other or none
2.4% 3.163 million households
Total: 134.529 million households Source: EIA WF01 households; AMR complete-category shares.
American Mineral Registry · November 2026
Source and data: AMR calculations from EIA November workbook
Permanent link to this figure’s text and data · Sources and context
How many households use each main heating fuel?
EIA's 2026 to 2027 national household estimates put about 45.8% in the natural gas group and 42.7% in electricity. Propane is about 4.7% and heating oil including kerosene about 3.1%. Wood and other or no fuel remain separate categories in the full denominator. (AMR shares calculated from EIA household rows, Nov 2026).
National main-heating-fuel household estimates,2026 to 2027. The complete six-category denominator is 134.529 million households.
| Main fuel category | Households, millions | Share of six-category total % |
|---|---|---|
| Natural gas | 61.663 | 45.8 |
| Heating oil including kerosene | 4.181 | 3.1 |
| Propane | 6.369 | 4.7 |
| Electricity | 57.435 | 42.7 |
| Wood | 1.717 | 1.3 |
| Other or none | 3.163 | 2.4 |
Download the complete matching data (CSV).
A fuel with a high average bill can serve a smaller population. A common fuel can affect more households even if its modeled change is smaller. Those are useful distinctions for an editor deciding which national and regional stories fit the evidence. They do not establish the share of households experiencing hardship, receiving assistance or missing payments.
The household table includes six categories and all four regions plus the United States for each of six winters, giving 180 rows. Counts are published in thousands; converting to households requires multiplication by 1,000. AMR calculates category shares from the complete six-category total for each geography and season. The expenditure average for propane has a different regional coverage, as noted earlier, so a national household count is not silently substituted as the denominator of that regional expenditure weighting.
Which months account for the expenditure?
The complete monthly panel keeps November, December, January, February and March for both the prior season and the new base forecast. It also separates heating and non-heating quantities and dollars, so an author can quote a seasonal total or a monthly observation with the right time boundary.
National month-specific main-fuel expenditures,2026 to 2027 base forecast.
| Month | Gas USD | Oil USD | Electricity USD | Propane USD |
|---|---|---|---|---|
| November | $106 | $336 | $205 | $188 |
| December | $143 | $482 | $251 | $281 |
| January | $147 | $534 | $270 | $310 |
| February | $128 | $443 | $230 | $258 |
| March | $116 | $384 | $231 | $224 |
Download the complete matching data (CSV).
A five-month seasonal total divided by five is a simple arithmetic monthly average. It is not the forecast for January, an equal-payment plan amount or a prediction of each invoice. The month-specific rows account for the source's changing usage and prices. The calculation checks that the five monthly expenditures reconcile to their published seasonal total.
Why does a wholesale gas price not determine the next household bill?
EIA explains that regulated natural gas retail prices can lag wholesale changes because utilities procure fuel over time and rate-setting schedules vary. Retail gas bills also include transportation, distribution and operating costs. Electricity rates similarly reflect the cost of supplying and delivering power, rather than only one fuel's spot price. (EIA, wholesale to retail transmission, Oct 2026).
Heating oil and propane retail prices generally reflect wholesale movements more quickly. EIA describes a usual pass-through period of roughly four to six weeks, while its expenditure method still assumes the price when fuel is used. This does not establish the terms of any particular supplier contract. (EIA, retail-price assumptions, Oct 2026).
For the historical wholesale question, see winter gas prices and monthly volatility. For this household question, use the retail expenditure model, local bills and the same fuel and season. Keeping those sources distinct allows a writer to explain the connection without claiming that a spot-market move passes immediately and proportionally into every home.
Methodology and Sources
AMR pinned EIA’s November 2026 WF 01 workbook on November 14,2026. Numerical inputs use only the nominal Seasonal and Monthly WFO sheets; broken legacy Real sheets are excluded. Every source-reported fuel and region combination is retained. Electricity cents are converted to dollars. Decimal arithmetic reconciles price times quantity, monthly and seasonal totals, end-use components and the exact price/quantity bridge. The source season is November through March. Historical amounts are producer estimates, the latest season a forecast, and all dollars nominal. The original workbook is never modified or recalculated. Source cells, units, periods and pinned inputs accompany the public standard-library program. Values are rounded after calculation. Modeled averages do not measure conversion savings, household hardship or private royalties.
Reproduce or update the comparison
Download the research bundle, extract it and run the supplied analysis program with Python 3. The program reads the pinned workbook directly from its compressed XML, preserving cached numerical values and source coordinates. It does not request a newer file from the network or write changes to the producer workbook. The bundle contains the exact workbook, source definitions and the heating output folder. Its README gives the specific command for reproducing this article.
To prepare a later edition, archive the new workbook first, verify its sheet definitions and source-covered geography, then rerun and review all tables. A file at an unchanged URL is not proof that its values, source season or definitions are unchanged. Keep the fixed historical edition available when citing a prior forecast.
What are the main limitations?
The estimates average different housing populations. They are not matched houses, a distribution of household bills or an experiment holding equipment constant. Prices and consumption are modeled at the source's geographic level. The figures are nominal and carry the source's tax and retail-price assumptions. Unreported regions are omitted rather than assigned a numerical value. Scenario cases are alternatives, not probability bounds. Changes in dollar amounts do not establish causes or affordability without further appropriate evidence.
Frequently asked questions
Is the winter heating figure for a whole year?
No. This edition uses the source's November through March season, crossing the calendar-year boundary. It does not annualize a five-month number or include summer cooling costs.
Is electricity's national figure only the cost of running the heater?
No. It is spending on electricity in homes whose main heating fuel is electricity, including other uses. The source separately models a heating component; that component is about $533 of the $1,186 base forecast in this edition. (EIA November workbook, Nov 2026).
Can I multiply a benchmark gas price by my meter use?
Only a price with the appropriate retail scope and matching units belongs in that bill calculation. A wholesale benchmark omits important retail costs and can use a different unit. This page retains the workbook's retail price and quantity basis.
Do lower projected expenditures prove that homes are more efficient?
No. A modeled decline can arise from lower prices, less heating demand, different consumption or a combination. This reference's bridge identifies the arithmetic components, not an efficiency improvement measured in the same homes.
Are these the newest values forever?
They are a fixed November 2026 source edition. The methods and historical panel remain inspectable; a later release requires its own source check. Cite the edition and target season so readers can tell a forecast from an observed outcome or later revision.
Glossary
- Main heating fuel: The source category used to group homes by their primary space-heating fuel.
- Expenditure: Modeled quantity multiplied by the associated price, with the source's stated coverage.
- Heating degree day: A measure of heating demand based on temperature below a 65°F base.
- Mcf: Thousand cubic feet of natural gas, not million cubic feet.
- kWh: Kilowatt-hour, the electricity consumption unit used here.
- Nominal dollars: Dollar amounts without an inflation adjustment.
- Base case: The source's central set of forecast assumptions.
- Interaction: The product of the price change and quantity change in the disclosed accounting bridge.