American Mineral RegistryResearch & data

Residential Electricity Bill Statistics by State: Prices, Usage and Change

Updated

Residential electricity bill statistics show why the state with expensive electricity is not always the state with the largest bill. American Mineral Registry calculates a $150.68 average monthly U.S. residential account bill for 2025 from EIA’s final annual revenue and customer counts. Hawaii’s $207.89 was the highest state average, while New Mexico’s $94.65 was the lowest. California had the second highest effective price per kilowatt hour but ranked twentieth for the monthly bill because its average reported use was the lowest. (EIA, annual residential sales workbook, Oct 2026).

On this page
  1. Key Takeaways
  2. What is the average residential electricity bill by state?
  3. Why can a lower electricity price produce a higher bill?
  4. Which states change rank when bills, prices and usage are separated?
  5. How have national residential electricity bills changed since 2010?
  6. What changed in bills between 2024 and 2025?
  7. How can these electricity bill statistics be reproduced and cited?
  8. Methodology and Sources

This reference compares all 50 states and the District of Columbia on bills, prices and consumption using one consistent annual source edition. It includes the complete 2010 through 2025 panel, separate rankings, a transparent price and usage accounting breakdown, the older published bill table crosscheck and reusable downloads. These are nominal annual utility account averages, not median household bills, current monthly tariffs or a measure of ability to pay.

Key Takeaways

What is the average residential electricity bill by state?

The average U.S. monthly bill was $150.68 in 2025. Hawaii and Connecticut were both above $200, while New Mexico and Utah were below $100. The complete state comparison uses the same residential sector, source year and accounting method.

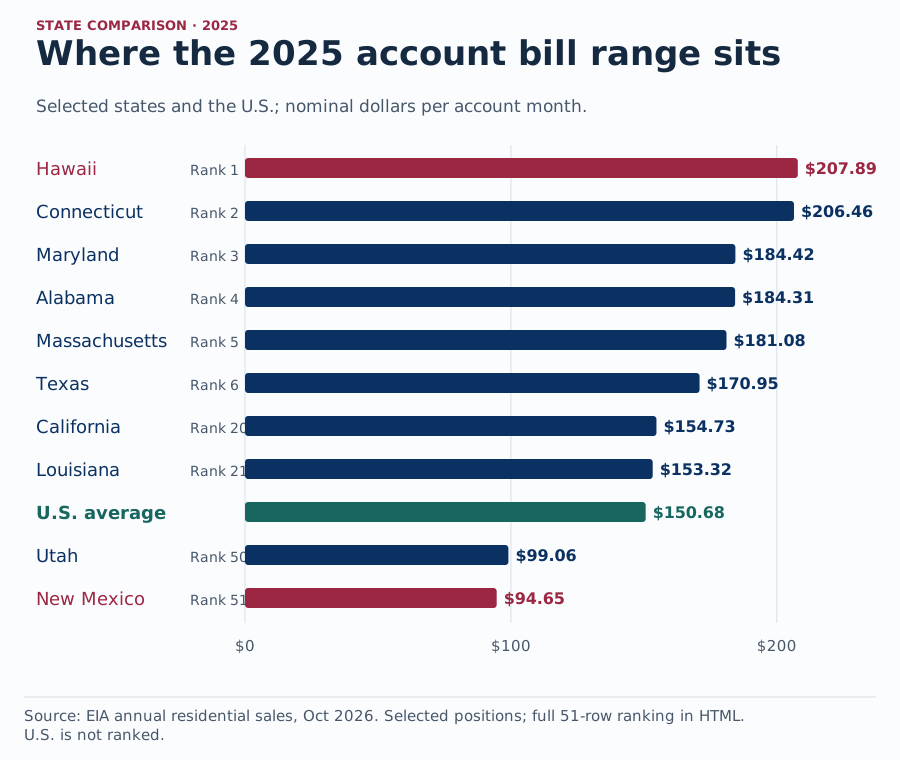
Residential electricity bill statistics show selected positions in the complete 2025 ranking: Hawaii $207.89, the United States $150.68 and New Mexico $94.65 per account month.
Figure 1: Selected positions show the size of the 2025 range. Every state and DC appears in the complete HTML table below; the U.S. value is a weighted national comparator and is not ranked as a state. Source: EIA annual residential sales workbook, Oct 2026. Chart drawn by American Mineral Registry from the source figures, checked 15 Nov 2026.

Download original chart (SVG)

Figure 1 in text

STATE COMPARISON · 2025 Where the 2025 account bill range sits Selected states and the U.S.; nominal dollars per account month. $0 $100 $200 Hawaii Rank 1

$207.89 Connecticut Rank 2

$206.46 Maryland Rank 3

$184.42 Alabama Rank 4

$184.31 Massachusetts Rank 5

$181.08 Texas Rank 6

$170.95 California Rank 20

$154.73 Louisiana Rank 21

$153.32 U.S. average

$150.68 Utah Rank 50

$99.06 New Mexico Rank 51

$94.65 Source: EIA annual residential sales, Oct 2026. Selected positions; full 51-row ranking in HTML. U.S. is not ranked.

Source and data: EIA annual residential sales workbook

Which states had the highest average monthly bills?

Hawaii led the complete panel, narrowly ahead of Connecticut. The next positions were Maryland, Alabama and Massachusetts. Rankings refer to the derived values before the two decimal presentation used in prose, so rounded display amounts do not determine the order.

This is a comparison of each geography’s annual average, not a list of the most expensive utility offers. Different customers within the same state can use different amounts of electricity and face different fixed charges, rate plans and billing arrangements. A state average also does not identify which household spent the most. A journalist describing the ranking should retain “average residential account bill” and the data year, rather than turning the result into a claim about every resident’s payment. (EIA, annual residential sales workbook, Oct 2026).

Where were average monthly bills lowest?

New Mexico had the smallest average account bill, followed by Utah and Colorado. Their positions illustrate why the bill ranking needs its own complete table instead of being inferred from a ranking of cents per kilowatt hour.

A low account bill is not evidence that energy is affordable for every household. Affordability depends on income and on other energy costs, among other factors, none of which is in this annual utility account panel. A home with little purchased electricity can still face substantial gas, heating oil or other fuel costs. For reported household hardship, use the separate household energy insecurity reference, whose survey population and measures answer that different question. (EIA, annual residential sales workbook, Oct 2026).

How large was the state range and the national comparison?

The state range compares the two observed endpoint averages. The national benchmark instead aggregates revenue and customer accounts. Neither calculation should be described as the distribution of individual bills, because the source does not provide individual account observations.

Multiplying the monthly range by twelve would describe a difference between annualized state averages, not a guaranteed saving available to a person who moves. The homes, usage patterns and customer populations in the two places differ. The national benchmark also need not split the states into equal halves. It gives more influence to places with more residential accounts. Its role is to describe the average account in the national utility data, while the complete ranking describes differences among geography averages. (EIA, annual residential sales workbook, Oct 2026).

Why can a lower electricity price produce a higher bill?

A bill combines an effective price and the quantity purchased. California’s comparatively low average use offset much of its high price, while Louisiana’s high average use combined with a much lower effective price. Price rankings alone therefore cannot reproduce bill rankings.

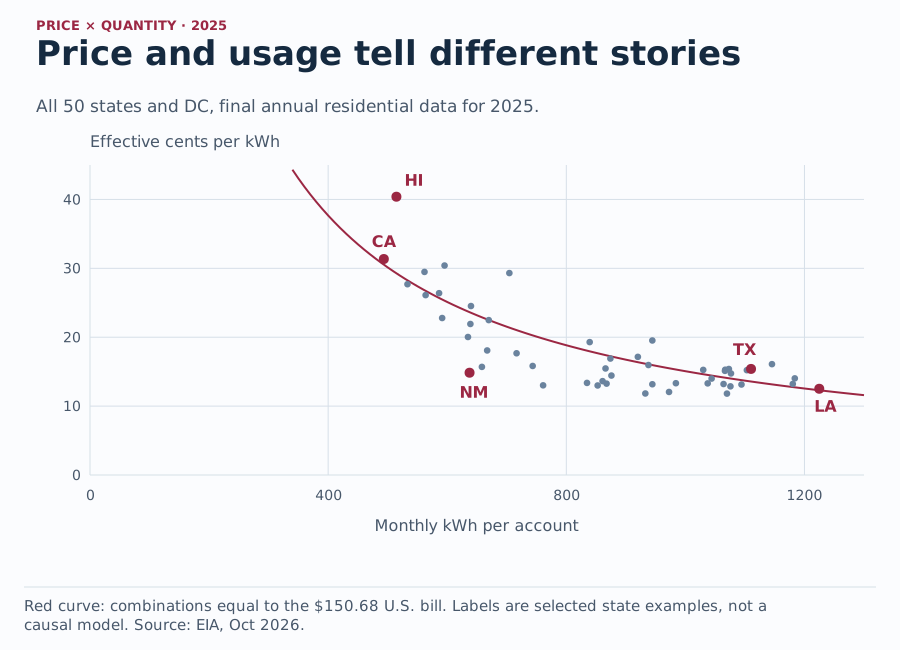
Price and usage tell different stories. All 50 states and DC, final annual residential data for 2025.
Figure 2: The curve marks combinations producing the $150.68 U.S. monthly average. It is an arithmetic reference, not an efficient consumption target or an estimate of what a particular household should spend. Source: EIA annual residential sales workbook, Oct 2026. Chart drawn by American Mineral Registry from the source figures, checked 15 Nov 2026.

Download original chart (SVG)

Figure 2 in text

PRICE × QUANTITY · 2025 Price and usage tell different stories All 50 states and DC, final annual residential data for 2025. 0 10 20 30 40 0 400 800 1200 Effective cents per kWh Monthly kWh per account HI CA TX LA NM Red curve: combinations equal to the $150.68 U.S. bill. Labels are selected state examples, not a causal model. Source: EIA, Oct 2026.

Source and data: EIA annual residential sales workbook

What does the California and Texas comparison reveal?

California and Texas reverse order depending on whether the comparison concerns effective price or monthly bills. That reversal is useful for writers explaining why a price headline can give a different impression from the annual account expenditure data.

This accounting comparison does not establish why either state uses its recorded amount. Weather, housing, fuel choices, customer composition and behavior can all be relevant questions, but their separate contributions cannot be estimated from this aggregate panel. Nor does the calculation show that changing California’s tariff to the Texas effective average would leave everything else unchanged. Keep the comparison descriptive. It establishes that the observed price and usage combinations produce different bill outcomes, without identifying a policy treatment effect. (EIA, annual residential sales workbook, Oct 2026).

How does high usage change the interpretation of low prices?

Louisiana supplies a clear example of high average use combined with a price near the lower end of the panel. Its bill was close to the national average despite having a substantially lower effective price per unit.

The appropriate sentence therefore depends on the reader’s question. “Electricity prices are low” concerns the revenue obtained per unit sold. “Bills are low” concerns revenue per account over time. “Households use little electricity” concerns a different quantity again. Combining these concepts under one cost ranking obscures the distinction. The complete table keeps all three columns and ranks together so a writer can quote the relevant measure without searching across incompatible releases or mixing different years. (EIA, annual residential sales workbook, Oct 2026).

What does the effective price actually include?

AMR derives effective price as annual residential revenue divided by annual residential sales, converted to cents per kilowatt hour. This is the arithmetic average revenue per unit in the source, rather than a quoted marginal rate available to every customer.

Do not apply the effective figure as if it were a utility’s advertised energy-only charge. The annual revenue and sales aggregates summarize the reporting sector’s actual accounting. A household’s schedule can have fixed charges, tiered prices, time periods or other features that this statewide ratio does not separately identify. The source does not let AMR itemize those components for an individual customer. The reproducible calculation consequently retains full input precision and names the derived field effective price throughout the dataset. (EIA, annual residential sales workbook, Oct 2026).

Which states change rank when bills, prices and usage are separated?

Three separate rankings answer three separate questions. Hawaii had the highest effective price and bill but the second lowest use. California had the second highest effective price, the lowest use and a bill ranked twentieth. No single rank captures all of those facts.

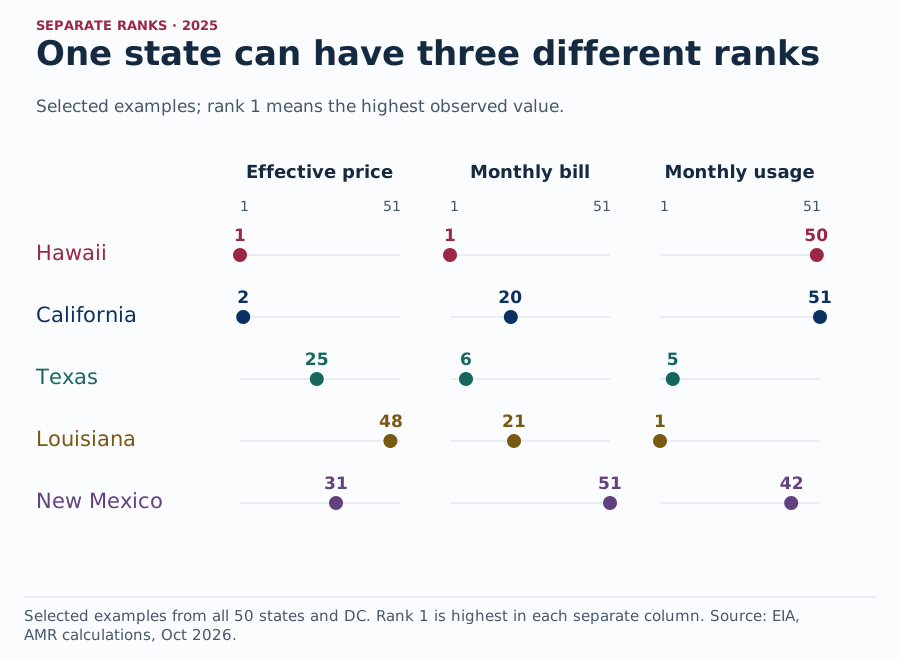
One state can have three different ranks. Selected examples; rank 1 means the highest observed value.
Figure 3: The same state can move from near the top to near the bottom depending on the denominator. These are positions within the same 51 geographies and source year, not a composite performance score. Source: EIA annual residential sales workbook, Oct 2026. Chart drawn by American Mineral Registry from the source figures, checked 15 Nov 2026.

Download original chart (SVG)

Figure 3 in text

SEPARATE RANKS · 2025 One state can have three different ranks Selected examples; rank 1 means the highest observed value.

Effective price 1 51 1 Hawaii 2 California 25 Texas 48 Louisiana 31 New Mexico

Monthly bill 1 51 1 20 6 21 51

Monthly usage 1 51 50 51 5 1 42 Selected examples from all 50 states and DC. Rank 1 is highest in each separate column. Source: EIA, AMR calculations, Oct 2026.

Additional phone figure text: 1 = highest · 51 = lowest

Source and data: EIA annual residential sales workbook

How far apart can one state’s ranks be?

The largest contrasts are often more informative than a repeated list of expensive states. Keeping bill, price and usage ranks side by side makes the denominator change visible and prevents a reader from treating one measure’s position as another measure’s result.

These are descriptive positions, not grades for affordability, service quality or policy effectiveness. A rank also hides the size of a difference. Two states can be adjacent while their dollar values are either close or far apart. Read the values next to the positions before making a claim about the scale of the gap. The full downloadable ranking preserves both, together with revenue, sales and account counts that let a reader independently reconstruct every derived value. (EIA, annual residential sales workbook, Oct 2026).

Which states had the highest and lowest average consumption?

Average use refers to annual residential electricity sales per reported customer account divided by twelve. It is not a weather-normalized engineering measure and does not describe total household energy use from every fuel.

An account average divides sales by a sector customer count, not by floor area, cooling degree days or the number of residents. It therefore cannot establish which homes are most efficient. It also does not measure all electricity used behind the meter. A comparison involving rooftop generation or a home’s total energy requirements needs additional data and a carefully matched scope. For this reference, the useful claim is purchased residential electricity per reported account, using the same source sector in every state. (EIA, annual residential sales workbook, Oct 2026).

How are DC, ties and the U.S. total handled?

The comparison contains all 50 states and the District of Columbia. The U.S. row is shown for context but excluded from state ranking, so the public ranking has 51 entries instead of giving a national aggregate a misleading competitive position.

If two values are exactly tied at the comparison precision, competition ranking gives the same rank and skips the next occupied position. The package checks that the six decimal exported comparisons reproduce the source-precision ordering in this edition. Alphabetical labels only determine a stable display order inside a tie; they never create a numerical advantage. DC remains explicitly named in the scope rather than being silently treated as a state or excluded from the comparison. (EIA, annual residential sales workbook, Oct 2026).

How have national residential electricity bills changed since 2010?

The national account bill rose from $110.55 in 2010 to $150.68 in 2025, a 36.30% nominal increase. Average account consumption declined over the same endpoints while the effective price increased. The intervening years show that neither bills nor usage moved in one uninterrupted direction.

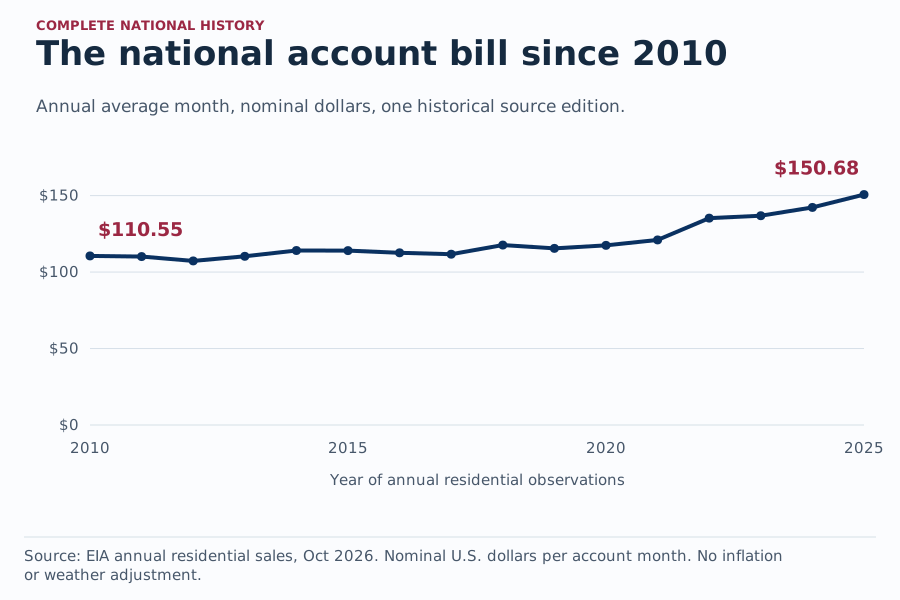
The national account bill since 2010. Annual average month, nominal dollars, one historical source edition.
Figure 4: The time series uses one retrieved historical edition and a zero dollar baseline. It shows the accounting averages as published, without an inflation adjustment, constant-household assumption or weather normalization. Source: EIA annual residential sales workbook, Oct 2026. Chart drawn by American Mineral Registry from the source figures, checked 15 Nov 2026.

Download original chart (SVG)

Figure 4 in text

COMPLETE NATIONAL HISTORY The national account bill since 2010 Annual average month, nominal dollars, one historical source edition. $0 $50 $100 $150 2010 2015 2020 2025 $110.55 $150.68 Year of annual residential observations Source: EIA annual residential sales, Oct 2026. Nominal U.S. dollars per account month. No inflation or weather adjustment.

Source and data: EIA annual residential sales workbook

How large was the long period change?

Comparing 2010 and 2025 is a fixed endpoint calculation in the same retrieved workbook. It describes the nominal account average rather than the experience of a particular household continuously observed for fifteen years.

These figures should not be called real increases or purchasing power losses. Such statements require an inflation index and an explicit deflator, which are outside this calculation. Nor can the endpoint difference be assigned entirely to a fuel price, regulation or generator technology. The annual panel measures revenue, sales and customers. It does not provide the research design needed to isolate the causes of changes in those aggregates or changes in the composition of the customer population. (EIA, annual residential sales workbook, Oct 2026).

What happened in the intervening annual observations?

The complete sixteen year series lets a reader check whether an endpoint summary hides reversals. Each observation is derived by the same identity and retains its source year instead of being joined to a separate monthly price series.

The table is an annual series. Dividing annual revenue per account by twelve gives an average month over the year; it does not reveal the highest winter or summer statement. A seasonal story needs weather, fuel and monthly expenditure evidence suited to its question. The separate winter household energy cost reference distinguishes those expenditure windows. Retaining the full annual history here makes the long period comparison reproducible without substituting a forecast for an observed year. (EIA, annual residential sales workbook, Oct 2026).

How many accounts underlie the national average?

The national customer count is the denominator behind the bill calculation. Changes in that population matter for interpretation because a comparison of average accounts is not a panel following the same homes or people through time.

One person, one household and one electric account are different units. Seasonal properties, multiple accounts associated with a household and other arrangements can prevent a one-to-one relationship. This panel does not contain the matching records needed to convert between them. A writer should consequently avoid multiplying the account average by a survey household count and calling the result an observed national household expenditure total. Use the revenue field when the question concerns the source’s national residential electricity revenue. (EIA, annual residential sales workbook, Oct 2026).

What changed in bills between 2024 and 2025?

The U.S. monthly account average increased $8.42, or 5.92%, between 2024 and 2025. AMR’s symmetric midpoint identity assigns $6.56 to the effective price term and $1.85 to the usage term. These are transparent accounting components, not estimates of policy or weather effects.

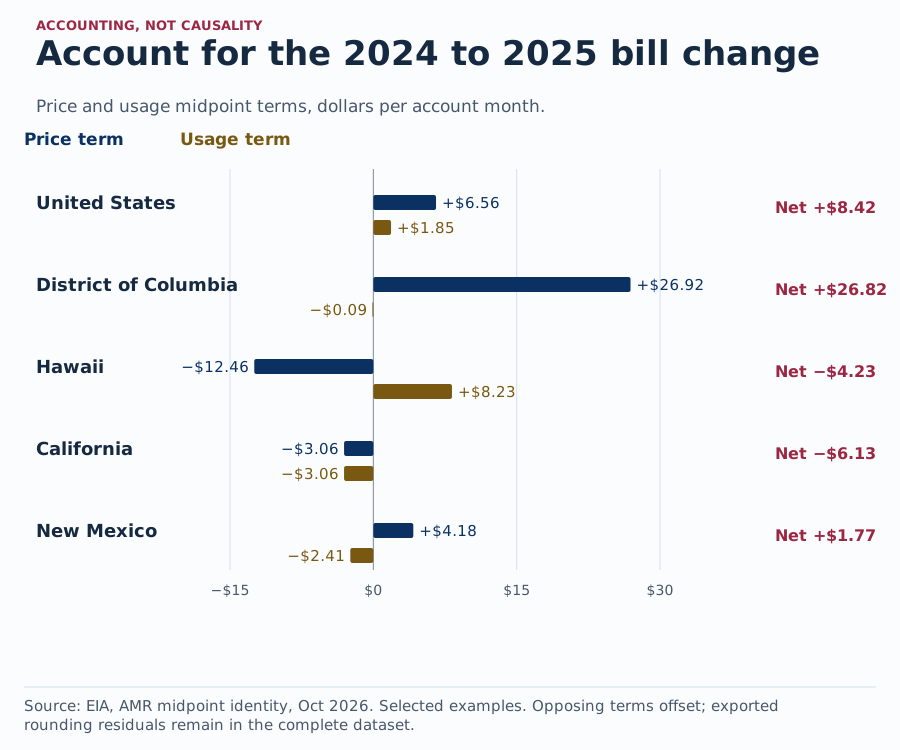
Account for the 2024 to 2025 bill change. Price and usage midpoint terms, dollars per account month.
Figure 5: The bars allocate an arithmetic change, not causal responsibility. Opposing components can offset one another; the national, DC, Hawaii and California examples are selected to show different accounting patterns. Source: EIA annual residential sales workbook, Oct 2026. Chart drawn by American Mineral Registry from the source figures, checked 15 Nov 2026.

Download original chart (SVG)

Figure 5 in text

ACCOUNTING, NOT CAUSALITY Account for the 2024 to 2025 bill change Price and usage midpoint terms, dollars per account month.

Price term

Usage term −$15 $0 $15 $30

United States +$6.56 +$1.85 Net +$8.42

District of Columbia +$26.92 −$0.09 Net +$26.82

Hawaii −$12.46 +$8.23 Net −$4.23

California −$3.06 −$3.06 Net −$6.13

New Mexico +$4.18 −$2.41 Net +$1.77 Source: EIA, AMR midpoint identity, Oct 2026. Selected examples. Opposing terms offset; exported rounding residuals remain in the complete dataset.

Source and data: EIA annual residential sales workbook

How broadly did the state averages increase?

The matched comparison uses each geography’s 2024 and 2025 values from the same current source edition. It counts directions once per state or DC, without weighting the direction count by the number of customer accounts.

The count of rising geographies does not estimate the share of households receiving a larger bill. There is no individual billing panel here, and a state mean can rise while some accounts spend less. Similarly, DC’s largest percentage increase does not mean it had the largest dollar increase unless that separate comparison is checked. The download keeps both dollar and percentage changes for every geography so writers can select the comparison that actually supports their sentence. (EIA, annual residential sales workbook, Oct 2026).

How does the price and usage accounting identity work?

Let P be effective price in cents per kWh and Q be average monthly kWh. The midpoint method splits the change in P times Q divided by 100 into a price term using average usage and a usage term using average price.

Using the midpoint in both terms allocates the interaction symmetrically instead of assigning all of it to whichever factor is changed second. It is an exact product-change identity before export rounding. There is no statistical regression and no assumption that price and consumption are independent. The six decimal exports create very small residuals, which remain visible rather than being forced into either component. The calculation script checks the sum for all 52 geographies, including the national row. (EIA, annual residential sales workbook, Oct 2026).

What do offsetting components show and what do they not show?

Hawaii and New Mexico illustrate opposing price and usage terms. California shows two negative components. Those patterns explain the arithmetic of the measured bill change, while leaving the real-world causes of each input open.

The word contribution is used here only in its accounting sense. A positive price term does not prove a generator, fuel, utility or policy caused that dollar amount. A negative usage term does not establish that customers voluntarily conserved electricity or improved efficiency. Establishing those explanations would require additional variables and a suitable design. For supply context, the separate electricity generation mix reference measures in-state output, which also must not be treated as the fuel content of an individual customer’s consumption. (EIA, annual residential sales workbook, Oct 2026).

How can these electricity bill statistics be reproduced and cited?

Use the 2025 account panel for the latest complete annual comparison and the 2024 bill table as a separately dated crosscheck. EIA’s older Electricity Sales, Revenue, and Price catalog states that its 2024 release is discontinued. The historical EIA861 workbook nevertheless provides the later 2025 annual inputs.

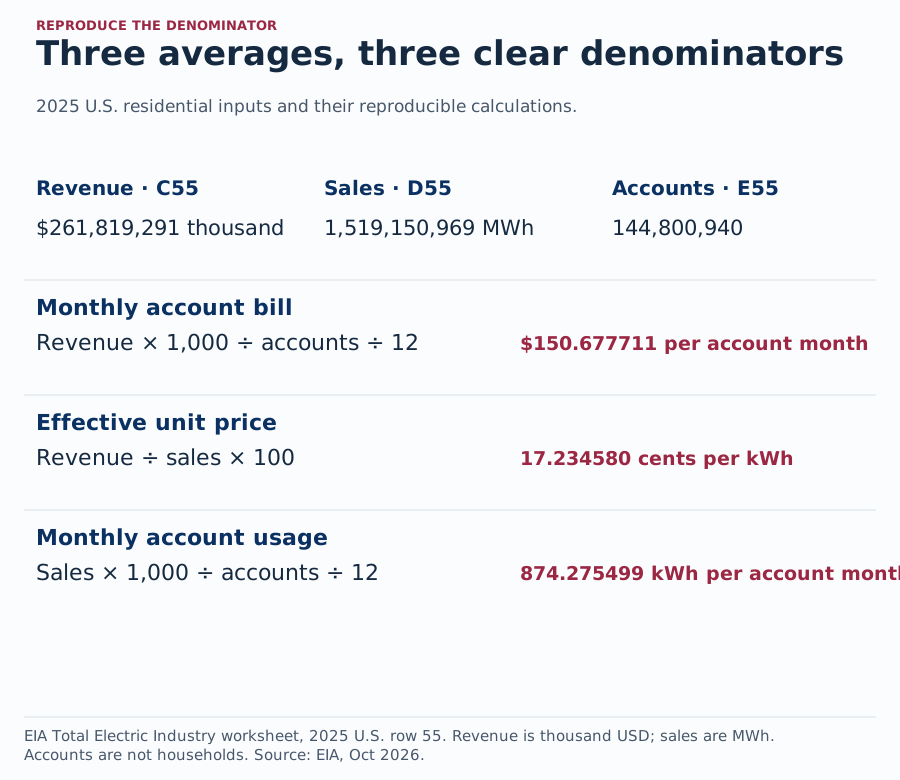
Three averages, three clear denominators. 2025 U.S. residential inputs and their reproducible calculations.
Figure 6: Revenue per account gives bills; revenue per unit sold gives effective price; sales per account give usage. The source workbook and exact row numbers remain in the download package so every derived comparison is checkable. Source: EIA annual residential sales workbook, Oct 2026. Chart drawn by American Mineral Registry from the source figures, checked 15 Nov 2026.

Download original chart (SVG)

Figure 6 in text

REPRODUCE THE DENOMINATOR Three averages, three clear denominators 2025 U.S. residential inputs and their reproducible calculations. Revenue · C55 $261,819,291 thousand Sales · D55 1,519,150,969 MWh Accounts · E55 144,800,940 Monthly account bill Revenue × 1,000 ÷ accounts ÷ 12

$150.677711 per account month Effective unit price Revenue ÷ sales × 100

17.234580 cents per kWh Monthly account usage Sales × 1,000 ÷ accounts ÷ 12

874.275499 kWh per account month EIA Total Electric Industry worksheet, 2025 U.S. row 55. Revenue is thousand USD; sales are MWh. Accounts are not households. Source: EIA, Oct 2026.

Source and data: EIA annual residential sales workbook

Why are there two source vintages?

The two producer workbooks serve different roles. The older Table 5A directly publishes average monthly bills for 2024. The current historical workbook supplies the revenue, sales and customer inputs used to reproduce the same identity and extend it to 2025.

The crosscheck is evidence that the reconstruction closely matches the producer’s published bill method for the overlapping year. It is not proof that historical source files will never be revised. The package therefore pins the actual workbooks, records their hashes and keeps the older and newer inputs separate. A writer checking a future download should compare source vintages before treating a small change as a new economic event. The publication date of a table is also distinct from the year its observations describe. (EIA, residential bill Table 5A, Oct 2025). (EIA, annual residential sales workbook, Oct 2026).

How are weighting, reconciliation and precision preserved?

National calculations use the producer’s national total, rather than averaging the fifty one state and DC means. The source records are rounded aggregates, so the package retains small differences between summed states and the separately published national totals.

Five customer accounts, five MWh and five thousand dollars are not interchangeable discrepancies. The register preserves the measure name beside every residual, allowing its practical size to be assessed against the corresponding total. It never spreads a residual across states or substitutes a state sum for a published national value. Decimal precision in derived exports supports reproduction; it should not be read as a claim that the source measured every quantity to six decimal places. Public dollar descriptions remain rounded to cents. (EIA, annual residential sales workbook, Oct 2026).

What belongs in a reusable citation?

A usable citation names the annual data year, residential account unit, geography, measure and AMR calculation. Specific finding cards pair those qualifications with permanent fragments and the exact working CSV, while crediting EIA for the original inputs.

Choose the finding that matches the claim being written instead of citing a generic electricity statistic for a different denominator. “The average account bill was $150.68 in 2025” is supported; “every household paid $150.68 in the current month” is not. The downloads below provide the complete input ledger and calculations rather than just a chart image, so readers and automated systems can inspect the actual figures. All numerical comparisons shown graphically are also available as ordinary HTML text and tables. (EIA, annual residential sales workbook, Oct 2026).

Methodology and Sources

AMR read EIA’s October 2026 final annual residential revenue, sales and customer workbook for 2010 through 2025, using its Total Electric Industry worksheet. The 832 complete observations contain 50 states, DC and the U.S. for each year. Monthly bill is revenue in thousand dollars times 1,000, divided by accounts and 12. Monthly use is MWh sales times 1,000, divided by accounts and 12. Effective price is revenue divided by sales times 100 in cents/kWh. The code checks source hashes, positive essential inputs, complete geography-year coverage, source-precision ranks, national reconciliation and all 52 matched 2024 Table 5A bills. Change components use the symmetric midpoint identity and preserve rounding residuals. All dollars remain nominal. No causal inference, missing-value imputation or inflation adjustment is performed. Source cells, calculation files and full data tables reproduce the analysis offline. (EIA, annual residential sales workbook, Oct 2026).

Glossary

  • Residential customer account: The reported utility customer unit used as the denominator of these annual sector averages. It is not automatically a unique household or person. (EIA, annual residential sales workbook, Oct 2026).
  • Average monthly bill: Annual residential revenue divided by reported residential accounts and twelve, expressed in nominal dollars per account month. (EIA, annual residential sales workbook, Oct 2026).
  • Effective price: Residential revenue divided by residential electricity sales, converted to cents per kWh. It is not an individual marginal tariff. (EIA, annual residential sales workbook, Oct 2026).
  • Midpoint decomposition: The symmetric product-change identity allocating a bill change into effective price and usage terms. It is an accounting method, not a causal model. (EIA, annual residential sales workbook, Oct 2026).
  • Rounding residual: The remaining difference after comparing source-rounded totals or exported derived values, retained with its original units. (EIA, annual residential sales workbook, Oct 2026).
  • Source vintage: The particular producer edition and retrieval preserved for reproducible analysis; its release date differs from its data year. (EIA, annual residential sales workbook, Oct 2026).

Sources

Cite a specific finding

Copy a finding with its exact period, denominator and primary source. The permanent link lands on the supporting evidence.

U.S. residential account bill

American Mineral Registry calculates an average monthly U.S. residential electricity account bill of $150.68 for 2025 from EIA’s annual residential revenue and 144,800,940 customer accounts. This is an annual account average, not a median household bill.

American Mineral Registry. American Mineral Registry calculates an average monthly U.S. residential electricity account bill of $150.68 for 2025 from EIA’s annual residential revenue and 144,800,940 customer accounts. This is an annual account average, not a median household bill. 2025 final residential account data, or the explicitly stated comparison years. Nominal dollars, not household medians or current monthly tariffs. Derived from EIA revenue, sales and customer inputs. https://americanmineralregistry.com/research/us-residential-electricity-bill-statistics-by-state#bills-national-account-average Primary sources: https://www.eia.gov/electricity/data/state/xls/861/HS861%202010-.xlsx; https://www.eia.gov/electricity/data/state/
Copy HTML attribution<a href="https://americanmineralregistry.com/research/us-residential-electricity-bill-statistics-by-state#bills-national-account-average">American Mineral Registry</a>. American Mineral Registry calculates an average monthly U.S. residential electricity account bill of $150.68 for 2025 from EIA’s annual residential revenue and 144,800,940 customer accounts. This is an annual account average, not a median household bill. 2025 final residential account data, or the explicitly stated comparison years. Nominal dollars, not household medians or current monthly tariffs. Derived from EIA revenue, sales and customer inputs. Primary sources: <a href="https://www.eia.gov/electricity/data/state/xls/861/HS861%202010-.xlsx">Original primary source</a>; <a href="https://www.eia.gov/electricity/data/state/">EIA source release catalog</a>.

Permanent finding link · Matching data (CSV) · Original producer source

EIA source release catalog

Complete state bill range

In 2025, Hawaii’s $207.89 and New Mexico’s $94.65 were the highest and lowest average monthly residential electricity account bills among all 50 states and DC. The difference between the two state averages was $113.24 per month.

American Mineral Registry. In 2025, Hawaii’s $207.89 and New Mexico’s $94.65 were the highest and lowest average monthly residential electricity account bills among all 50 states and DC. The difference between the two state averages was $113.24 per month. 2025 final residential account data, or the explicitly stated comparison years. Nominal dollars, not household medians or current monthly tariffs. Derived from EIA revenue, sales and customer inputs. https://americanmineralregistry.com/research/us-residential-electricity-bill-statistics-by-state#bills-state-bill-range Primary sources: https://www.eia.gov/electricity/data/state/xls/861/HS861%202010-.xlsx; https://www.eia.gov/electricity/data/state/
Copy HTML attribution<a href="https://americanmineralregistry.com/research/us-residential-electricity-bill-statistics-by-state#bills-state-bill-range">American Mineral Registry</a>. In 2025, Hawaii’s $207.89 and New Mexico’s $94.65 were the highest and lowest average monthly residential electricity account bills among all 50 states and DC. The difference between the two state averages was $113.24 per month. 2025 final residential account data, or the explicitly stated comparison years. Nominal dollars, not household medians or current monthly tariffs. Derived from EIA revenue, sales and customer inputs. Primary sources: <a href="https://www.eia.gov/electricity/data/state/xls/861/HS861%202010-.xlsx">Original primary source</a>; <a href="https://www.eia.gov/electricity/data/state/">EIA source release catalog</a>.

Permanent finding link · Matching data (CSV) · Original producer source

EIA source release catalog

California and Texas price versus bill

In 2025, California ranked second for effective residential electricity price and twentieth for the average monthly account bill; Texas ranked twenty fifth for price and sixth for the bill. California averaged 493.53 kWh and $154.73 per account month, compared with 1,110.26 kWh and $170.95 in Texas.

American Mineral Registry. In 2025, California ranked second for effective residential electricity price and twentieth for the average monthly account bill; Texas ranked twenty fifth for price and sixth for the bill. California averaged 493.53 kWh and $154.73 per account month, compared with 1,110.26 kWh and $170.95 in Texas. 2025 final residential account data, or the explicitly stated comparison years. Nominal dollars, not household medians or current monthly tariffs. Derived from EIA revenue, sales and customer inputs. https://americanmineralregistry.com/research/us-residential-electricity-bill-statistics-by-state#bills-california-texas-rank-reversal Primary sources: https://www.eia.gov/electricity/data/state/xls/861/HS861%202010-.xlsx; https://www.eia.gov/electricity/data/state/
Copy HTML attribution<a href="https://americanmineralregistry.com/research/us-residential-electricity-bill-statistics-by-state#bills-california-texas-rank-reversal">American Mineral Registry</a>. In 2025, California ranked second for effective residential electricity price and twentieth for the average monthly account bill; Texas ranked twenty fifth for price and sixth for the bill. California averaged 493.53 kWh and $154.73 per account month, compared with 1,110.26 kWh and $170.95 in Texas. 2025 final residential account data, or the explicitly stated comparison years. Nominal dollars, not household medians or current monthly tariffs. Derived from EIA revenue, sales and customer inputs. Primary sources: <a href="https://www.eia.gov/electricity/data/state/xls/861/HS861%202010-.xlsx">Original primary source</a>; <a href="https://www.eia.gov/electricity/data/state/">EIA source release catalog</a>.

Permanent finding link · Matching data (CSV) · Original producer source

EIA source release catalog

High usage and a low effective price

Louisiana’s 2025 average residential account usage was 1,224.85 kWh per month, the highest among all 50 states and DC. Its effective price of 12.5175 cents per kWh ranked forty eighth, while its average monthly account bill of $153.32 ranked twenty first.

American Mineral Registry. Louisiana’s 2025 average residential account usage was 1,224.85 kWh per month, the highest among all 50 states and DC. Its effective price of 12.5175 cents per kWh ranked forty eighth, while its average monthly account bill of $153.32 ranked twenty first. 2025 final residential account data, or the explicitly stated comparison years. Nominal dollars, not household medians or current monthly tariffs. Derived from EIA revenue, sales and customer inputs. https://americanmineralregistry.com/research/us-residential-electricity-bill-statistics-by-state#bills-louisiana-usage-price Primary sources: https://www.eia.gov/electricity/data/state/xls/861/HS861%202010-.xlsx; https://www.eia.gov/electricity/data/state/
Copy HTML attribution<a href="https://americanmineralregistry.com/research/us-residential-electricity-bill-statistics-by-state#bills-louisiana-usage-price">American Mineral Registry</a>. Louisiana’s 2025 average residential account usage was 1,224.85 kWh per month, the highest among all 50 states and DC. Its effective price of 12.5175 cents per kWh ranked forty eighth, while its average monthly account bill of $153.32 ranked twenty first. 2025 final residential account data, or the explicitly stated comparison years. Nominal dollars, not household medians or current monthly tariffs. Derived from EIA revenue, sales and customer inputs. Primary sources: <a href="https://www.eia.gov/electricity/data/state/xls/861/HS861%202010-.xlsx">Original primary source</a>; <a href="https://www.eia.gov/electricity/data/state/">EIA source release catalog</a>.

Permanent finding link · Matching data (CSV) · Original producer source

EIA source release catalog

Hawaii’s three different ranks

In 2025, Hawaii ranked first for the average residential electricity account bill and effective price, but fiftieth for usage among all 50 states and DC. Its averages were $207.89 per account month, 40.3951 cents per kWh and 514.64 kWh per account month.

American Mineral Registry. In 2025, Hawaii ranked first for the average residential electricity account bill and effective price, but fiftieth for usage among all 50 states and DC. Its averages were $207.89 per account month, 40.3951 cents per kWh and 514.64 kWh per account month. 2025 final residential account data, or the explicitly stated comparison years. Nominal dollars, not household medians or current monthly tariffs. Derived from EIA revenue, sales and customer inputs. https://americanmineralregistry.com/research/us-residential-electricity-bill-statistics-by-state#bills-hawaii-three-ranks Primary sources: https://www.eia.gov/electricity/data/state/xls/861/HS861%202010-.xlsx; https://www.eia.gov/electricity/data/state/
Copy HTML attribution<a href="https://americanmineralregistry.com/research/us-residential-electricity-bill-statistics-by-state#bills-hawaii-three-ranks">American Mineral Registry</a>. In 2025, Hawaii ranked first for the average residential electricity account bill and effective price, but fiftieth for usage among all 50 states and DC. Its averages were $207.89 per account month, 40.3951 cents per kWh and 514.64 kWh per account month. 2025 final residential account data, or the explicitly stated comparison years. Nominal dollars, not household medians or current monthly tariffs. Derived from EIA revenue, sales and customer inputs. Primary sources: <a href="https://www.eia.gov/electricity/data/state/xls/861/HS861%202010-.xlsx">Original primary source</a>; <a href="https://www.eia.gov/electricity/data/state/">EIA source release catalog</a>.

Permanent finding link · Matching data (CSV) · Original producer source

EIA source release catalog

National bill since 2010

American Mineral Registry calculates that the average monthly U.S. residential electricity account bill increased from $110.55 in 2010 to $150.68 in 2025, a nominal increase of 36.30%. This comparison is not inflation adjusted.

American Mineral Registry. American Mineral Registry calculates that the average monthly U.S. residential electricity account bill increased from $110.55 in 2010 to $150.68 in 2025, a nominal increase of 36.30%. This comparison is not inflation adjusted. 2025 final residential account data, or the explicitly stated comparison years. Nominal dollars, not household medians or current monthly tariffs. Derived from EIA revenue, sales and customer inputs. https://americanmineralregistry.com/research/us-residential-electricity-bill-statistics-by-state#bills-national-nominal-history Primary sources: https://www.eia.gov/electricity/data/state/xls/861/HS861%202010-.xlsx; https://www.eia.gov/electricity/data/state/
Copy HTML attribution<a href="https://americanmineralregistry.com/research/us-residential-electricity-bill-statistics-by-state#bills-national-nominal-history">American Mineral Registry</a>. American Mineral Registry calculates that the average monthly U.S. residential electricity account bill increased from $110.55 in 2010 to $150.68 in 2025, a nominal increase of 36.30%. This comparison is not inflation adjusted. 2025 final residential account data, or the explicitly stated comparison years. Nominal dollars, not household medians or current monthly tariffs. Derived from EIA revenue, sales and customer inputs. Primary sources: <a href="https://www.eia.gov/electricity/data/state/xls/861/HS861%202010-.xlsx">Original primary source</a>; <a href="https://www.eia.gov/electricity/data/state/">EIA source release catalog</a>.

Permanent finding link · Matching data (CSV) · Original producer source

EIA source release catalog

National 2024 to 2025 bill change

The average monthly U.S. residential electricity account bill increased from $142.26 in 2024 to $150.68 in 2025, a rise of $8.42 or 5.92%, calculated from one current EIA historical source edition.

American Mineral Registry. The average monthly U.S. residential electricity account bill increased from $142.26 in 2024 to $150.68 in 2025, a rise of $8.42 or 5.92%, calculated from one current EIA historical source edition. 2025 final residential account data, or the explicitly stated comparison years. Nominal dollars, not household medians or current monthly tariffs. Derived from EIA revenue, sales and customer inputs. https://americanmineralregistry.com/research/us-residential-electricity-bill-statistics-by-state#bills-national-annual-change Primary sources: https://www.eia.gov/electricity/data/state/xls/861/HS861%202010-.xlsx; https://www.eia.gov/electricity/data/state/
Copy HTML attribution<a href="https://americanmineralregistry.com/research/us-residential-electricity-bill-statistics-by-state#bills-national-annual-change">American Mineral Registry</a>. The average monthly U.S. residential electricity account bill increased from $142.26 in 2024 to $150.68 in 2025, a rise of $8.42 or 5.92%, calculated from one current EIA historical source edition. 2025 final residential account data, or the explicitly stated comparison years. Nominal dollars, not household medians or current monthly tariffs. Derived from EIA revenue, sales and customer inputs. Primary sources: <a href="https://www.eia.gov/electricity/data/state/xls/861/HS861%202010-.xlsx">Original primary source</a>; <a href="https://www.eia.gov/electricity/data/state/">EIA source release catalog</a>.

Permanent finding link · Matching data (CSV) · Original producer source

EIA source release catalog

47 state and DC averages increased

Of the 51 state and DC average monthly residential electricity account bills, 47 increased and four decreased from 2024 to 2025 in the same EIA source edition. The decreases occurred in Arizona, California, Hawaii and Nevada. This counts geography averages, not individual households.

American Mineral Registry. Of the 51 state and DC average monthly residential electricity account bills, 47 increased and four decreased from 2024 to 2025 in the same EIA source edition. The decreases occurred in Arizona, California, Hawaii and Nevada. This counts geography averages, not individual households. 2025 final residential account data, or the explicitly stated comparison years. Nominal dollars, not household medians or current monthly tariffs. Derived from EIA revenue, sales and customer inputs. https://americanmineralregistry.com/research/us-residential-electricity-bill-statistics-by-state#bills-state-change-directions Primary sources: https://www.eia.gov/electricity/data/state/xls/861/HS861%202010-.xlsx; https://www.eia.gov/electricity/data/state/
Copy HTML attribution<a href="https://americanmineralregistry.com/research/us-residential-electricity-bill-statistics-by-state#bills-state-change-directions">American Mineral Registry</a>. Of the 51 state and DC average monthly residential electricity account bills, 47 increased and four decreased from 2024 to 2025 in the same EIA source edition. The decreases occurred in Arizona, California, Hawaii and Nevada. This counts geography averages, not individual households. 2025 final residential account data, or the explicitly stated comparison years. Nominal dollars, not household medians or current monthly tariffs. Derived from EIA revenue, sales and customer inputs. Primary sources: <a href="https://www.eia.gov/electricity/data/state/xls/861/HS861%202010-.xlsx">Original primary source</a>; <a href="https://www.eia.gov/electricity/data/state/">EIA source release catalog</a>.

Permanent finding link · Matching data (CSV) · Original producer source

EIA source release catalog

National price and usage identity

The 2024 to 2025 increase in the average monthly U.S. residential electricity account bill was $8.42. American Mineral Registry’s symmetric midpoint identity allocates approximately $6.56 to the effective price term and $1.85 to the usage term. These are independently rounded accounting components, not causal effects; exact values and rounding residuals remain in the data.

American Mineral Registry. The 2024 to 2025 increase in the average monthly U.S. residential electricity account bill was $8.42. American Mineral Registry’s symmetric midpoint identity allocates approximately $6.56 to the effective price term and $1.85 to the usage term. These are independently rounded accounting components, not causal effects; exact values and rounding residuals remain in the data. 2025 final residential account data, or the explicitly stated comparison years. Nominal dollars, not household medians or current monthly tariffs. Derived from EIA revenue, sales and customer inputs. https://americanmineralregistry.com/research/us-residential-electricity-bill-statistics-by-state#bills-midpoint-accounting Primary sources: https://www.eia.gov/electricity/data/state/xls/861/HS861%202010-.xlsx; https://www.eia.gov/electricity/data/state/
Copy HTML attribution<a href="https://americanmineralregistry.com/research/us-residential-electricity-bill-statistics-by-state#bills-midpoint-accounting">American Mineral Registry</a>. The 2024 to 2025 increase in the average monthly U.S. residential electricity account bill was $8.42. American Mineral Registry’s symmetric midpoint identity allocates approximately $6.56 to the effective price term and $1.85 to the usage term. These are independently rounded accounting components, not causal effects; exact values and rounding residuals remain in the data. 2025 final residential account data, or the explicitly stated comparison years. Nominal dollars, not household medians or current monthly tariffs. Derived from EIA revenue, sales and customer inputs. Primary sources: <a href="https://www.eia.gov/electricity/data/state/xls/861/HS861%202010-.xlsx">Original primary source</a>; <a href="https://www.eia.gov/electricity/data/state/">EIA source release catalog</a>.

Permanent finding link · Matching data (CSV) · Original producer source

EIA source release catalog

2024 published bill crosscheck

For all 50 states, DC and the U.S., American Mineral Registry’s reconstructed 2024 average monthly residential electricity account bills match EIA’s published 2024 Table 5A bills when both are rounded to cents. The reconstruction uses EIA’s October 2026 historical workbook; Table 5A was released in October 2025. Exact signed differences remain in the comparison data.

American Mineral Registry. For all 50 states, DC and the U.S., American Mineral Registry’s reconstructed 2024 average monthly residential electricity account bills match EIA’s published 2024 Table 5A bills when both are rounded to cents. The reconstruction uses EIA’s October 2026 historical workbook; Table 5A was released in October 2025. Exact signed differences remain in the comparison data. 2025 final residential account data, or the explicitly stated comparison years. Nominal dollars, not household medians or current monthly tariffs. Derived from EIA revenue, sales and customer inputs. https://americanmineralregistry.com/research/us-residential-electricity-bill-statistics-by-state#bills-prior-vintage-crosscheck Primary sources: https://www.eia.gov/electricity/data/state/xls/861/HS861%202010-.xlsx; https://www.eia.gov/electricity/data/state/; https://www.eia.gov/electricity/sales_revenue_price/xls/table_5A.xlsx
Copy HTML attribution<a href="https://americanmineralregistry.com/research/us-residential-electricity-bill-statistics-by-state#bills-prior-vintage-crosscheck">American Mineral Registry</a>. For all 50 states, DC and the U.S., American Mineral Registry’s reconstructed 2024 average monthly residential electricity account bills match EIA’s published 2024 Table 5A bills when both are rounded to cents. The reconstruction uses EIA’s October 2026 historical workbook; Table 5A was released in October 2025. Exact signed differences remain in the comparison data. 2025 final residential account data, or the explicitly stated comparison years. Nominal dollars, not household medians or current monthly tariffs. Derived from EIA revenue, sales and customer inputs. Primary sources: <a href="https://www.eia.gov/electricity/data/state/xls/861/HS861%202010-.xlsx">Original primary source</a>; <a href="https://www.eia.gov/electricity/data/state/">EIA source release catalog</a>; <a href="https://www.eia.gov/electricity/sales_revenue_price/xls/table_5A.xlsx">EIA 2024 Table 5 A</a>.

Permanent finding link · Matching data (CSV) · Original producer source

EIA source release catalog · EIA 2024 Table 5 A

Complete working tables

Open a working table to inspect every row or download its matching CSV. Each table states its period, units, scope and original sources. Display values follow the stated dataset precision, with long fractions shown to four decimal places. The dictionary explains every field, denominator and rounding rule. No account is required.

Complete annual residential account panel, all 832 rows

All 50 states, DC andU.S. for each of 16 years. All 832 observations, not a selected state sample.

Period: 2010 through 2025, oneOctober 2026 source edition. Units: NominalUSD/account/month, kWh/account/month, cents/kWh; accounts; revenue thousandUSD; sales MWh.

Original sources: EIA annual state residential workbook, Total Electric Industry, columnsC:F

Complete annual residential account panel; 2010 through 2025, oneOctober 2026 source edition; NominalUSD/account/month, kWh/account/month, cents/kWh; accounts; revenue thousandUSD; sales MWh
yearstatestate nameaccountsrevenue thousand usdsales mwhmonthly use kwheffective price cents kwhmonthly bill usdpublished price cents kwh
2025AKAlaska301,478532,4762,039,337563.705326.1103147.184926.11
2025ALAlabama2,422,9815,358,94233,304,2901,145.431016.0908184.309516.09
2025ARArkansas1,491,0302,476,66319,246,4581,075.680212.8682138.420112.87
2025AZArizona3,203,5786,041,47839,595,0281,029.968915.2582157.154415.26
2025CACalifornia14,371,58126,685,24585,113,825493.530931.3524154.733931.35
2025COColorado2,601,4573,224,70420,548,681658.242715.6930103.298015.69
2025CTConnecticut1,581,5253,918,18213,367,238704.343329.3118206.455929.31
2025DCDistrict of Columbia324,763545,8072,489,890638.899221.9209140.052621.92
2025DEDelaware481,801912,3235,320,069920.170517.1487157.797317.1500
2025FLFlorida10,682,97021,518,482141,435,6391,103.279615.2143167.856615.21
2025GAGeorgia4,870,2279,274,85462,917,7031,076.570314.7412158.699914.74
2025HIHawaii448,8691,119,7862,772,081514.641840.3951207.890340.4
2025IAIowa1,460,5912,055,88415,089,329860.914613.6248117.297513.62
2025IDIdaho887,7451,175,6129,936,216932.720511.8316110.355611.83
2025ILIllinois5,423,1848,238,13346,625,606716.455017.6687126.588217.6700
2025INIndiana3,084,0755,540,80334,713,250937.970315.9616149.715415.96
2025KSKansas1,326,7792,012,81313,943,812875.793414.4352126.422314.44
2025KYKentucky2,088,9333,602,58827,428,9731,094.217813.1342143.717213.13
2025LALouisiana2,156,7113,968,03531,699,8331,224.852412.5175153.321212.52
2025MAMassachusetts2,919,1866,343,15920,861,216595.520330.4065181.076730.41
2025MDMaryland2,471,2185,468,87428,008,354944.485519.5259184.419019.53
2025MEMaine749,2321,327,6704,793,977533.210127.6945147.670127.69
2025MIMichigan4,538,5806,926,14334,574,788634.831220.0324127.171620.03
2025MNMinnesota2,605,5583,679,08923,246,776743.499615.8262117.668015.83
2025MOMissouri2,953,5154,889,99436,770,0421,037.465613.2989137.971013.3
2025MSMississippi1,347,9482,685,98519,147,8271,183.764014.0276166.053914.03
2025MTMontana565,902752,4145,790,125852.639512.9948110.798612.99
2025NCNorth Carolina5,162,8939,053,79664,684,6601,044.063513.9968146.135714
2025NDNorth Dakota400,162606,9745,137,2591,069.829011.8151126.401711.82
2025NENebraska915,7581,288,30110,687,424972.548112.0544117.234512.05
2025NHNew Hampshire658,1041,239,3745,053,198639.868224.5265156.937524.53
2025NJNew Jersey3,782,9136,835,83630,403,688669.759222.4836150.585822.48
2025NMNew Mexico946,3091,074,8157,239,364637.508814.846894.649814.85
2025NVNevada1,335,5811,844,21313,905,209867.613013.2627115.069313.26
2025NYNew York7,462,70913,857,83952,505,369586.308226.3932154.745426.39
2025OHOhio5,149,8839,130,07254,014,836874.046316.9029147.739116.9000
2025OKOklahoma1,897,4623,199,56424,229,5401,064.120613.2052140.519513.21
2025OROregon1,889,2903,035,51619,630,148865.852115.4635133.891415.46
2025PAPennsylvania5,565,99310,813,35656,056,917839.277019.2900161.896219.29
2025RIRhode Island464,880923,9463,134,178561.825629.4797165.624529.48
2025SCSouth Carolina2,629,2905,086,39733,649,1921,066.485415.1160161.209515.12
2025SDSouth Dakota446,014701,6855,266,829984.055213.3227131.102913.32
2025TNTennessee3,199,4875,990,76145,320,1081,180.400413.2188156.034413.22
2025TXTexas12,794,15226,245,470170,458,1291,110.260715.3970170.947015.4
2025UTUtah1,305,5081,551,80911,922,485761.037413.015899.055213.02
2025VAVirginia3,684,4987,208,98747,172,7141,066.918615.2821163.047715.28
2025VTVermont313,956507,7742,228,407591.486022.7864134.778422.79
2025WAWashington3,407,7255,087,28438,623,804944.515913.1714124.405713.17
2025WIWisconsin2,867,5724,149,96622,954,686667.076718.0789120.600518.0800
2025WVWest Virginia866,8161,717,64711,161,7111,073.056515.3887165.129915.39
2025WYWyoming292,568391,7752,930,751834.777713.3677111.590913.37
2025USUnited States144,800,940261,819,2911,519,150,969874.275517.2346150.677717.23
2024AKAlaska298,397513,9682,070,594578.254824.8222143.535824.82
2024ALAlabama2,398,1724,993,05832,899,0711,143.199615.1769173.502215.18
2024ARArkansas1,476,9442,288,69118,580,6381,048.371812.3176129.134412.32
2024AZArizona3,134,7336,027,53440,434,9311,074.916914.9068160.235214.91
2024CACalifornia14,217,18027,443,69785,850,538503.208931.9668160.859931.97
2024COColorado2,557,7323,086,84920,693,690674.220014.9169100.572514.92
2024CTConnecticut1,552,7463,720,21012,941,903694.570728.7455199.657628.75
2024DCDistrict of Columbia318,780433,1402,445,805639.366017.7095113.228617.71
2024DEDelaware473,508857,2545,174,514910.669916.5669150.869316.57
2024FLFlorida10,443,37319,561,174138,370,7201,104.135014.1368156.089214.14
2024GAGeorgia4,815,5018,740,02662,062,9531,074.013414.0825151.248114.08
2024HIHawaii446,5121,136,5782,651,594494.871742.8640212.121642.86
2024IAIowa1,448,8181,939,17514,468,850832.221513.4024111.537813.4
2024IDIdaho868,1411,132,6889,832,269943.804911.5201108.727311.52
2024ILIllinois5,392,4777,117,52944,850,719693.106315.8694109.991615.87
2024INIndiana3,056,2164,879,87333,048,641901.131814.7657133.058714.77
2024KSKansas1,317,0951,958,28413,839,989875.663814.1495123.901714.15
2024KYKentucky2,077,2153,335,30826,085,7091,046.501712.7860133.805312.79
2024LALouisiana2,147,7453,633,01230,974,8401,201.835711.7289140.962311.73
2024MAMassachusetts2,924,5355,867,77919,992,635569.681329.3497167.199829.35
2024MDMaryland2,451,7534,880,09927,327,356928.837317.8579165.871117.86
2024MEMaine742,5491,190,4114,901,492550.075024.2867133.595124.29
2024MIMichigan4,516,3676,466,08433,504,932618.213219.2989119.308419.3
2024MNMinnesota2,581,1803,408,95522,062,758712.295615.4512110.058015.45
2024MOMissouri2,933,9144,548,19235,226,8951,000.566012.9111129.184412.91
2024MSMississippi1,340,4592,490,44718,593,2011,155.897713.3944154.825513.39
2024MTMontana557,432721,8095,700,241852.157912.6628107.906912.66
2024NCNorth Carolina5,067,7628,726,60861,744,9421,015.322314.1333143.498714.13
2024NDNorth Dakota397,839565,1464,910,7551,028.631111.5083118.378311.51
2024NENebraska905,4151,198,16110,391,014956.376711.5307110.277311.53
2024NHNew Hampshire652,6081,134,5184,847,443618.983523.4045144.869823.4
2024NJNew Jersey3,735,6385,743,70129,692,962662.380419.3436128.128519.34
2024NMNew Mexico936,0981,043,2837,347,620654.100014.198992.875214.2
2024NVNevada1,311,7552,194,08114,631,493929.511314.9956139.385815
2024NYNew York7,420,21412,424,30550,857,373571.158024.4297139.532224.43
2024OHOhio5,142,1088,340,15152,174,356845.541015.9852135.161015.99
2024OKOklahoma1,878,8182,977,07524,328,2791,079.059612.2371132.045612.24
2024OROregon1,868,0122,905,55519,767,745881.853114.6985129.618914.7
2024PAPennsylvania5,534,5809,641,60354,272,558817.173717.7652145.172217.77
2024RIRhode Island457,383891,3683,111,332566.872128.6491162.403628.65
2024SCSouth Carolina2,581,8824,632,12132,544,8161,050.422914.2331149.507314.23
2024SDSouth Dakota433,548664,9395,170,067993.751412.8613127.809612.86
2024TNTennessee3,166,1035,445,10043,827,5031,153.560712.4239143.317612.42
2024TXTexas12,547,86324,652,422165,051,7431,096.147814.9362163.722614.94
2024UTUtah1,272,8611,444,46111,825,248774.190812.215194.567912.22
2024VAVirginia3,654,4816,524,03345,272,8251,032.358714.4105148.767914.41
2024VTVermont323,960488,4882,230,155573.670421.9038125.655421.9
2024WAWashington3,368,9784,595,90638,626,766955.452111.8982113.682011.9
2024WIWisconsin2,843,8743,783,44522,016,559645.145817.1845110.865317.18
2024WVWest Virginia866,4561,609,06410,674,5031,026.644115.0739154.755315.07
2024WYWyoming286,475370,0542,968,051863.382812.4679107.645812.47
2024USUnited States143,144,185244,367,4091,482,873,586863.275016.4793142.261816.48
2023AKAlaska296,192490,0722,050,667576.953223.8982137.881323.9
2023ALAlabama2,353,2744,593,82431,409,6521,112.267814.6255162.674914.63
2023ARArkansas1,459,8022,251,15718,373,9711,048.884912.2519128.508112.25
2023AZArizona3,068,5525,466,05938,992,3651,058.924114.0183148.443014.02
2023CACalifornia14,063,97224,439,80682,820,898490.739129.5092144.813329.51
2023COColorado2,517,4522,859,28519,999,333662.023014.296994.648814.3
2023CTConnecticut1,541,8953,751,25012,553,299678.456229.8826202.740229.88
2023DCDistrict of Columbia312,982390,0352,371,637631.462616.4458103.849216.45
2023DEDelaware468,358775,8334,931,847877.506615.7311138.041315.73
2023FLFlorida10,222,47620,651,963135,805,0221,107.078715.2071168.354215.21
2023GAGeorgia4,703,7967,996,71958,412,4991,034.846813.6901141.671413.69
2023HIHawaii446,2031,141,7012,693,161502.977542.3926213.225342.39
2023IAIowa1,436,0371,940,40914,581,845846.185513.3070112.602113.31
2023IDIdaho845,8961,082,5379,793,265964.782211.0539106.646011.05
2023ILIllinois5,394,6596,804,07243,319,747669.176515.7066105.105115.71
2023INIndiana3,018,4964,741,35431,739,243876.243314.9385130.897314.94
2023KSKansas1,306,7771,848,94413,815,434881.012013.3832117.907413.38
2023KYKentucky2,057,7053,106,28924,552,708994.340312.6515125.799112.65
2023LALouisiana2,137,1993,666,44431,746,5701,237.857411.5491142.961411.55
2023MAMassachusetts2,886,2035,733,88419,365,825559.149429.6083165.554429.61
2023MDMaryland2,432,4234,333,16326,107,722894.434716.5972148.451516.6000
2023MEMaine731,9691,348,7784,918,678559.982527.4216153.555927.42
2023MIMichigan4,496,3006,130,30132,533,717602.972018.8429113.617518.84
2023MNMinnesota2,551,5743,391,94123,023,275751.930514.7327110.779414.73
2023MOMissouri2,906,4384,397,84734,964,5731,002.503612.5780126.095012.58
2023MSMississippi1,335,2782,452,65918,544,1901,157.323913.2260153.067913.23
2023MTMontana549,248721,6815,755,522873.242712.5389109.495312.54
2023NCNorth Carolina4,951,3807,593,06158,737,520988.571512.9271127.793712.93
2023NDNorth Dakota395,002557,8575,067,1561,069.014811.0093117.690811.01
2023NENebraska893,1231,195,23710,670,550995.621511.2013111.522211.2
2023NHNew Hampshire647,0071,310,4664,654,978599.552828.1519168.785728.15
2023NJNew Jersey3,702,9635,030,51428,414,871639.462517.7038113.209217.7
2023NMNew Mexico928,2161,015,7857,336,277658.635913.846191.195113.85
2023NVNevada1,288,4982,251,64313,508,820873.680116.6679145.624516.6700
2023NYNew York7,384,44411,147,68250,113,258565.527322.2450125.801422.25
2023OHOhio5,110,8147,646,82249,713,538810.593915.3818124.683715.38
2023OKOklahoma1,857,1512,877,13823,817,5061,068.729612.0799129.101812.08
2023OROregon1,843,6832,603,09820,444,544924.080812.7325117.658412.73
2023PAPennsylvania5,516,1579,472,22252,327,643790.520818.1018143.098118.1000
2023RIRhode Island450,190809,1522,995,162554.425527.0153149.779727.02
2023SCSouth Carolina2,518,2724,228,05530,898,3291,022.471313.6838139.912613.68
2023SDSouth Dakota426,548646,5245,245,8191,024.859112.3246126.309312.32
2023TNTennessee3,106,7785,041,36341,350,5671,109.149312.1918135.224812.19
2023TXTexas12,257,00824,388,838168,610,8751,146.356914.4646165.815614.46
2023UTUtah1,244,0661,268,52611,328,264758.819911.197984.971811.2
2023VAVirginia3,615,9396,145,51143,095,838993.191514.2601141.630114.26
2023VTVermont322,405453,0952,176,314562.520720.8194117.113320.82
2023WAWashington3,319,8364,276,67938,940,142977.461510.9827107.351710.98
2023WIWisconsin2,813,5803,749,63322,218,861658.083916.8759111.057616.88
2023WVWest Virginia864,7681,437,86410,233,824986.182014.0501138.559714.05
2023WYWyoming283,729337,8972,947,863865.809511.462499.242911.46
2023USUnited States141,282,713231,992,6661,450,025,184855.274015.9992136.837116
2022AKAlaska294,370473,7512,050,472580.469023.1045134.114423.1
2022ALAlabama2,329,5594,690,78832,923,5731,177.747014.2475167.799614.25
2022ARArkansas1,445,5282,320,52719,250,6611,109.782612.0543133.776212.05
2022AZArizona3,013,3934,994,75838,367,6331,061.030813.0182138.126613.02
2022CACalifornia13,942,17423,136,71889,542,208535.199925.8389138.289825.84
2022COColorado2,480,5552,922,46920,593,942691.845914.190998.179314.19
2022CTConnecticut1,536,2173,246,41813,190,687715.539524.6114176.104624.61
2022DCDistrict of Columbia306,464357,2652,519,079684.985014.182497.147114.18
2022DEDelaware461,484714,3025,210,069940.817913.7100128.986413.71
2022FLFlorida10,066,75318,664,364134,245,9751,111.298213.9031154.505013.9
2022GAGeorgia4,648,8988,437,88461,140,2411,095.963013.8009151.252413.8
2022HIHawaii444,8541,182,5592,748,479514.865443.0259221.525743.03
2022IAIowa1,426,1641,997,14615,192,859887.746113.1453116.696813.15
2022IDIdaho826,3291,033,5839,963,6531,004.810910.3735104.234410.37
2022ILIllinois5,376,7347,274,06946,479,195720.375315.6502112.739915.65
2022INIndiana2,988,1514,970,15834,058,498949.820914.5930138.607414.59
2022KSKansas1,297,4002,020,77714,443,522927.722213.9909129.796613.99
2022KYKentucky2,045,2523,466,09626,840,1861,093.597412.9138141.225312.91
2022LALouisiana2,128,4254,067,05831,444,7081,231.141512.9340159.235812.93
2022MAMassachusetts2,888,5835,196,28820,006,891577.183025.9725149.908825.97
2022MDMaryland2,415,6554,057,91328,065,379968.177014.4588139.986614.46
2022MEMaine728,0531,142,5405,090,874582.704122.4429130.775722.44
2022MIMichigan4,475,3176,255,97135,034,971652.374117.8564116.490317.86
2022MNMinnesota2,523,1103,336,37223,418,313773.460614.2468110.193814.25
2022MOMissouri2,882,2594,373,89837,244,9701,076.845511.7436126.460411.74
2022MSMississippi1,329,1842,348,63018,917,8771,186.058312.4149147.247612.41
2022MTMontana540,745667,9685,894,499908.391711.3321102.939511.33
2022NCNorth Carolina4,855,6587,253,47062,443,9531,071.669911.6160124.484811.62
2022NDNorth Dakota392,470575,5415,271,9041,119.385810.9171122.204910.92
2022NENebraska877,6191,185,53210,983,6491,042.940110.7936112.570910.79
2022NHNew Hampshire642,8701,224,0854,808,322623.288525.4576158.674525.46
2022NJNew Jersey3,675,5695,031,55730,062,192681.576816.7372114.076616.7400
2022NMNew Mexico921,1091,008,1827,282,636658.864813.843691.210913.84
2022NVNevada1,270,1551,971,54214,306,529938.634113.7807129.350513.78
2022NYNew York7,346,23611,531,65252,227,413592.450922.0797130.811322.08
2022OHOhio5,082,4147,384,05553,312,216874.128813.8506121.072013.85
2022OKOklahoma1,839,0833,170,14125,479,1441,154.522112.4421143.646812.44
2022OROregon1,826,2862,367,52620,725,899945.721711.4230108.030111.42
2022PAPennsylvania5,504,3258,994,50156,413,218854.074115.9440136.173215.94
2022RIRhode Island448,184735,4133,168,339589.106823.2113136.739423.21
2022SCSouth Carolina2,472,2654,386,98332,287,0751,088.309513.5874147.873313.59
2022SDSouth Dakota419,358643,7205,322,9061,057.749012.0934127.917812.09
2022TNTennessee3,058,3915,339,49543,603,9871,188.097112.2454145.487612.25
2022TXTexas12,063,14723,474,681170,596,4601,178.496113.7604162.165313.76
2022UTUtah1,207,8781,230,16111,344,265782.658010.843984.870710.84
2022VAVirginia3,583,3716,233,14446,717,5471,086.443213.3422144.955313.34
2022VTVermont320,849435,8612,186,667567.937719.9327113.205119.93
2022WAWashington3,273,5054,079,23439,775,8491,012.570310.2556103.844710.26
2022WIWisconsin2,786,4573,575,87022,887,928684.499115.6234106.942015.62
2022WVWest Virginia863,9051,473,39811,136,9701,074.285813.2298142.125813.23
2022WYWyoming281,464333,6363,008,680890.783011.089198.780011.09
2022USUnited States139,854,178226,989,6471,509,233,162899.289815.0401135.253815.04
2021AKAlaska292,451469,8862,083,911593.806322.5483133.893122.55
2021ALAlabama2,308,2264,092,36831,585,1531,140.311312.9566147.745812.96
2021ARArkansas1,436,2462,131,72318,918,0151,097.654111.2682123.686011.27
2021AZArizona2,953,8234,655,90337,130,3391,047.522112.5394131.352512.54
2021CACalifornia13,883,99420,604,39290,284,143541.895822.8217123.669922.82
2021COColorado2,443,1092,696,11820,625,005703.509513.072191.963413.07
2021CTConnecticut1,530,2512,868,41013,092,128712.961921.9094156.205921.91
2021DCDistrict of Columbia298,337330,8512,528,049706.150313.087292.415313.09
2021DEDelaware453,758647,1265,170,380949.548012.5160118.845712.52
2021FLFlorida9,917,11315,518,174130,412,4641,095.853711.8993130.399011.9
2021GAGeorgia4,560,6537,339,63458,684,9621,072.305512.5068134.111512.51
2021HIHawaii443,535946,2102,825,082530.789033.4932177.778233.49
2021IAIowa1,417,4241,864,64514,651,755861.407412.7264109.626412.73
2021IDIdaho806,421944,6399,300,843961.123610.156597.616410.16
2021ILIllinois5,361,7176,167,78046,813,068727.582013.175395.861413.18
2021INIndiana2,948,8034,476,49233,471,970945.919713.3739126.505913.37
2021KSKansas1,289,3441,787,50713,769,410889.949312.9817115.530812.98
2021KYKentucky2,032,5753,040,79226,434,3711,083.780111.5032124.669111.5
2021LALouisiana2,126,1553,351,64830,408,2241,191.831611.0222131.365811.02
2021MAMassachusetts2,840,3114,647,88520,305,269595.746622.8900136.366722.89
2021MDMaryland2,395,9543,669,20427,964,545972.630813.1209127.618113.12
2021MEMaine722,038861,5765,062,266584.256617.019699.438017.02
2021MIMichigan4,458,0386,289,78335,868,100670.476217.5359117.573817.54
2021MNMinnesota2,496,4063,138,27923,246,055775.984113.5003104.759913.5
2021MOMissouri2,861,9334,071,54535,668,4091,038.587411.4150118.554611.42
2021MSMississippi1,321,5762,145,79518,569,9361,170.946411.5552135.305311.56
2021MTMontana531,398623,9235,559,446871.827111.222897.843011.22
2021NCNorth Carolina4,774,5926,897,04060,914,6841,063.174311.3225120.377511.32
2021NDNorth Dakota391,340530,3114,888,4011,040.953510.8484112.926310.85
2021NENebraska869,6561,127,99710,492,3691,005.413710.7506108.088410.75
2021NHNew Hampshire638,267959,2504,831,911630.863319.8524125.241519.8500
2021NJNew Jersey3,648,9144,921,08030,090,371687.199216.3543112.386916.3500
2021NMNew Mexico914,495958,0867,088,358645.926413.516387.305613.52
2021NVNevada1,249,3921,651,79414,373,357958.690111.4921110.173211.49
2021NYNew York7,256,21210,161,75552,156,882598.991219.4831116.701819.48
2021OHOhio5,041,9046,789,21753,171,193878.821312.7686112.213212.77
2021OKOklahoma1,818,8132,612,42423,745,8671,087.974511.0016119.694511
2021OROregon1,805,6842,307,36320,285,346936.180111.3745106.486111.37
2021PAPennsylvania5,477,3677,697,61355,945,176851.156813.7592117.112413.76
2021RIRhode Island446,320698,3803,131,533584.695022.3015130.396022.3
2021SCSouth Carolina2,426,7034,037,45431,385,7961,077.792812.8640138.646812.86
2021SDSouth Dakota412,657616,5175,043,9641,018.594912.2229124.501512.22
2021TNTennessee3,016,6424,741,60642,840,4421,183.447311.0681130.984711.07
2021TXTexas11,815,25118,772,300155,075,1361,093.749812.1053132.401612.11
2021UTUtah1,176,9491,142,20610,950,415775.339110.430780.873410.43
2021VAVirginia3,551,5325,579,58546,634,4111,094.232311.9645130.919711.96
2021VTVermont319,444418,7342,174,489567.258819.2567109.235119.2600
2021WAWashington3,220,8133,843,74638,021,233983.738010.109599.450710.11
2021WIWisconsin2,761,9903,320,22122,864,047689.842214.5216100.176014.52
2021WVWest Virginia863,6471,343,20711,050,7051,066.283012.1549129.606112.15
2021WYWyoming278,599323,7022,897,498866.687111.171896.824311.17
2021USUnited States138,308,772200,833,8741,470,486,882885.992813.6576121.005713.66
2020AKAlaska315,208471,5262,089,046552.293022.5714124.660022.57
2020ALAlabama2,280,7413,939,86731,331,0411,144.768312.5750143.954212.58
2020ARArkansas1,413,4901,871,42217,980,2061,060.036210.4082110.331010.41
2020AZArizona2,896,3394,751,04738,707,4161,113.688012.2743136.696912.27
2020CACalifornia13,834,71919,413,31494,934,563571.837720.4492116.936020.45
2020COColorado2,400,3572,531,33720,482,502711.092212.358587.880612.36
2020CTConnecticut1,521,1122,948,78012,981,839711.203322.7147161.547422.71
2020DCDistrict of Columbia290,466309,8412,452,589703.636312.633288.891912.63
2020DEDelaware446,276627,0314,991,134931.996912.5629117.085812.56
2020FLFlorida9,731,23715,021,436133,298,8691,141.503311.2690128.635911.27
2020GAGeorgia4,487,4316,995,85958,220,2801,081.173212.0162129.915812.02
2020HIHawaii442,002862,7712,849,114537.160830.2821162.663530.28
2020IAIowa1,403,3861,815,02814,567,483865.020012.4594107.776712.46
2020IDIdaho782,559892,4738,970,751955.27959.948795.03799.9500
2020ILIllinois5,339,6106,021,96646,170,538720.566613.042993.982613.04
2020INIndiana2,920,2664,217,03832,878,355938.223812.8262120.338312.83
2020KSKansas1,282,5321,747,07613,592,444883.177712.8533113.517412.85
2020KYKentucky2,013,9102,818,42525,935,0961,073.165110.8672116.623310.87
2020LALouisiana2,112,9282,942,98930,440,7461,200.57519.6679116.07079.67
2020MAMassachusetts2,817,5494,468,96120,345,178601.739821.9657132.176421.97
2020MDMaryland2,376,9833,551,28127,306,375957.319113.0053124.502413.01
2020MEMaine717,559824,6654,905,263569.670116.811895.772016.8100
2020MIMichigan4,423,5955,831,46135,862,912675.598916.2604109.855216.2600
2020MNMinnesota2,464,7533,020,23622,935,672775.455413.1683102.114213.17
2020MOMissouri2,833,9183,922,56234,950,3701,027.740011.2232115.345711.22
2020MSMississippi1,308,1492,010,53517,994,8331,146.329211.1728128.077611.17
2020MTMontana522,382604,8445,379,965858.242511.242596.488111.24
2020NCNorth Carolina4,695,0966,672,91958,641,5721,040.830211.3792118.437711.38
2020NDNorth Dakota387,506526,6735,046,5511,085.263010.4363113.261310.44
2020NENebraska864,8421,135,27110,514,9441,013.185510.7967109.391010.8
2020NHNew Hampshire633,234911,9674,790,374630.411219.0375120.014519.04
2020NJNew Jersey3,618,5874,756,75429,676,857683.435716.0285109.544516.03
2020NMNew Mexico905,885942,0237,282,079669.886312.936286.657712.94
2020NVNevada1,226,5661,624,39514,321,607973.015111.3423110.362011.34
2020NYNew York7,239,1629,596,80552,257,144601.556118.3646110.473218.36
2020OHOhio5,014,9596,457,16752,552,770873.266912.2870107.298412.29
2020OKOklahoma1,795,6292,350,12223,232,4731,078.195710.1157109.066810.1200
2020OROregon1,785,1312,191,86719,628,011916.273111.1670102.320511.17
2020PAPennsylvania5,448,1097,511,99155,307,093845.967713.5823114.902113.58
2020RIRhode Island441,573692,8403,148,021594.092222.0087130.752322.01
2020SCSouth Carolina2,377,0203,940,88930,826,0171,080.695512.7843138.159312.78
2020SDSouth Dakota407,532595,5095,070,0241,036.733311.7457121.771411.75
2020TNTennessee2,930,4824,420,25541,084,9111,168.320610.7588125.697610.76
2020TXTexas11,515,33318,322,011156,414,8191,131.931511.7137132.591411.71
2020UTUtah1,143,1361,100,68210,546,793768.849410.436280.238510.44
2020VAVirginia3,506,8445,542,94846,088,8461,095.211912.0267131.717412.03
2020VTVermont316,948421,3762,157,001567.128019.5353110.790019.54
2020WAWashington3,168,2383,639,30336,858,798969.48739.873695.72369.8700
2020WIWisconsin2,742,4243,271,75822,846,734694.237814.320599.418114.32
2020WVWest Virginia862,2791,283,97610,877,4991,051.235411.8040124.087411.8
2020WYWyoming276,029319,9402,879,528869.331411.110896.590111.11
2020USUnited States136,682,001192,663,2081,464,605,046892.951713.1546117.464413.15
2019AKAlaska289,290441,8871,928,208555.442622.9170127.290722.92
2019ALAlabama2,249,4254,061,18232,415,6461,200.886412.5285150.452612.53
2019ARArkansas1,396,8701,834,85918,732,3161,117.51739.7952109.46259.8000
2019AZArizona2,853,1834,317,05934,720,0501,014.073612.4339126.089012.43
2019CACalifornia13,707,12616,763,78087,523,987532.107619.1534101.916519.1500
2019COColorado2,370,1642,362,56519,404,743682.257412.175283.066212.18
2019CTConnecticut1,510,9662,732,69712,493,550689.048721.8729150.714721.87
2019DCDistrict of Columbia282,277330,6872,546,920751.897412.983897.624912.98
2019DEDelaware439,167627,9845,004,131949.549812.5493119.162012.55
2019FLFlorida9,565,84614,882,751127,181,5511,107.948311.7020129.651811.7
2019GAGeorgia4,411,5216,979,14959,331,4911,120.767911.7630131.835711.76
2019HIHawaii438,352884,8472,759,774524.649532.0623168.214732.06
2019IAIowa1,392,9791,805,89914,494,821867.135612.4589108.035812.46
2019IDIdaho763,841860,0488,696,843948.80609.889293.82939.89
2019ILIllinois5,314,5225,890,95845,220,258709.067513.027392.372013.03
2019INIndiana2,887,0314,182,91933,249,234959.729712.5805120.738812.58
2019KSKansas1,274,9551,732,74213,630,661890.924312.7121113.255112.71
2019KYKentucky1,991,1372,869,13126,573,0761,112.139910.7971120.079310.8
2019LALouisiana2,095,4663,035,09530,986,0241,232.26469.7950120.70099.8000
2019MAMassachusetts2,802,0994,233,10619,314,571574.407821.9166125.890921.92
2019MDMaryland2,352,5353,611,32727,533,693975.320013.1160127.923213.12
2019MEMaine710,869857,5694,793,809561.965817.8891100.530617.89
2019MIMichigan4,384,3055,273,11933,495,725636.659715.7427100.227215.74
2019MNMinnesota2,446,1112,906,62522,288,152759.305713.041199.022013.04
2019MOMissouri2,811,8633,975,60235,691,4261,057.763311.1388117.822311.14
2019MSMississippi1,293,4192,108,80118,717,8581,205.967711.2663135.867411.27
2019MTMontana516,052590,9435,308,103857.165411.132895.426911.13
2019NCNorth Carolina4,620,8566,834,01759,852,7931,079.395811.4180123.245911.42
2019NDNorth Dakota385,038527,9705,125,4311,109.291210.3010114.267910.3
2019NENebraska855,6191,109,65510,307,9051,003.942310.7651108.075310.77
2019NHNew Hampshire627,257903,5744,506,830598.748520.0490120.043020.05
2019NJNew Jersey3,596,8344,534,97328,612,555662.910715.8496105.068615.85
2019NMNew Mexico895,086859,6646,871,561639.748712.510580.035512.51
2019NVNevada1,204,9961,544,74312,867,637889.881012.0049106.829112
2019NYNew York7,235,4008,995,43950,141,003577.496317.9403103.604517.9400
2019OHOhio4,980,9316,464,45352,226,097873.767312.3778108.153412.38
2019OKOklahoma1,777,1562,429,74323,805,9721,116.295410.2064113.934110.2100
2019OROregon1,763,7832,123,88219,286,182911.212911.0125100.346911.01
2019PAPennsylvania5,418,8707,508,61954,396,182836.524113.8036115.470213.8
2019RIRhode Island444,216648,2922,983,012559.602421.7328121.617321.73
2019SCSouth Carolina2,330,9034,048,09531,159,9571,114.015912.9913144.725612.99
2019SDSouth Dakota403,717584,2665,057,0321,043.848411.5535120.601411.55
2019TNTennessee2,914,9164,628,86142,573,1831,217.107210.8727132.332610.87
2019TXTexas11,366,63918,286,991155,481,3421,139.895311.7615134.069211.76
2019UTUtah1,116,1451,013,0019,739,525727.169910.400975.632410.4
2019VAVirginia3,464,6775,632,06646,666,1631,122.427012.0688135.464012.07
2019VTVermont316,180368,7212,081,545548.618117.713897.181217.71
2019WAWashington3,126,1923,544,71636,512,424973.29349.708294.48979.7100
2019WIWisconsin2,720,2873,117,98521,995,360673.806414.175695.516414.18
2019WVWest Virginia857,6661,254,56011,153,2191,083.679311.2484121.896711.25
2019WYWyoming274,881318,4232,849,378863.821711.175296.533611.18
2019USUnited States135,249,616187,436,0371,440,288,909887.426413.0138115.487713.01
2018AKAlaska287,526433,2471,974,906572.384821.9376125.567521.94
2018ALAlabama2,229,4724,027,60333,080,3801,236.480412.1752150.544012.18
2018ARArkansas1,388,3581,888,65719,259,2041,155.99419.8065113.36289.81
2018AZArizona2,808,3524,425,19234,660,2971,028.488612.7673131.310512.77
2018CACalifornia13,591,15216,782,22289,099,985546.311218.8353102.899218.84
2018COColorado2,326,9762,342,77819,286,952690.701612.147083.899212.15
2018CTConnecticut1,503,7012,769,11113,061,372723.845821.2008153.460921.2
2018DCDistrict of Columbia274,613332,8692,592,242786.634912.8410101.011512.84
2018DEDelaware432,449635,3625,070,175977.027512.5314122.434912.53
2018FLFlorida9,423,02214,485,280125,528,0471,110.118511.5395128.101911.54
2018GAGeorgia4,354,0216,847,32559,689,1061,142.413511.4716131.053711.47
2018HIHawaii436,266880,2072,710,698517.783932.4716168.132732.47
2018IAIowa1,385,7561,817,12214,840,349892.434012.2445109.273812.24
2018IDIdaho743,567855,1578,427,578944.498810.147195.839510.15
2018ILIllinois5,289,5736,028,53247,225,915744.009612.765394.975112.77
2018INIndiana2,863,3584,239,86234,574,6641,006.238812.2629123.394212.26
2018KSKansas1,266,0441,894,14214,187,192933.826913.3511124.675913.35
2018KYKentucky1,980,2092,936,37927,712,7221,166.237310.5958123.571910.6
2018LALouisiana2,085,0553,074,08632,065,5381,281.56249.5869122.86199.59
2018MAMassachusetts2,784,2434,383,44920,284,674607.127121.6097131.198121.61
2018MDMaryland2,332,5173,741,62028,138,4741,005.297213.2972133.676113.3
2018MEMaine709,848820,5644,872,001571.953616.842496.331016.84
2018MIMichigan4,365,5295,426,83535,131,422670.621715.4472103.592515.45
2018MNMinnesota2,420,3253,001,39122,837,140786.297313.1426103.339813.14
2018MOMissouri2,792,4594,248,63837,463,3901,117.992811.3408126.789011.34
2018MSMississippi1,290,2812,146,53519,310,5271,247.178411.1159138.634911.12
2018MTMontana509,526569,7685,197,686850.085210.962093.186010.96
2018NCNorth Carolina4,550,4206,834,73561,622,4541,128.512211.0913125.166711.09
2018NDNorth Dakota382,596526,1455,133,1711,118.057310.2499114.599810.25
2018NENebraska849,8981,114,44210,412,0081,020.907610.7034109.272110.7
2018NHNew Hampshire622,671913,6134,641,013621.116319.6856122.270719.6900
2018NJNew Jersey3,568,0444,550,43129,530,689689.703015.4092106.277415.41
2018NMNew Mexico889,841865,7556,826,442639.294212.682481.077712.68
2018NVNevada1,183,6601,593,36013,449,743946.903611.8468112.177511.85
2018NYNew York7,190,9069,658,62252,153,246604.388918.5197111.931018.52
2018OHOhio4,964,8556,839,82354,451,714913.952712.5613114.804012.56
2018OKOklahoma1,764,9802,484,03124,116,8081,138.672410.3000117.283210.3
2018OROregon1,750,2402,079,22818,930,583901.332710.983498.997310.98
2018PAPennsylvania5,390,4287,764,87055,896,453864.131313.8915120.041013.89
2018RIRhode Island442,005642,0413,124,168589.014520.5508121.047120.55
2018SCSouth Carolina2,290,2003,962,86131,852,4191,159.011512.4413144.196312.44
2018SDSouth Dakota400,150581,7645,018,3601,045.099811.5927121.155411.59
2018TNTennessee2,882,9924,751,65744,381,9571,282.867410.7063137.347410.71
2018TXTexas11,148,78417,609,632157,267,9131,175.523711.1972131.626011.2
2018UTUtah1,091,1621,011,4469,714,507741.908410.411777.245310.41
2018VAVirginia3,431,5745,624,47847,962,6061,164.737811.7268136.586411.73
2018VTVermont315,138381,3092,116,045559.555118.0199100.831218.02
2018WAWashington3,076,8683,446,38135,338,978957.11459.752493.34129.75
2018WIWisconsin2,700,2453,146,09122,441,335692.571014.019297.092814.02
2018WVWest Virginia859,0391,306,09711,679,4551,132.996211.1829126.701411.18
2018WYWyoming272,427310,2262,748,356840.701111.287794.895811.29
2018USUnited States133,893,321189,032,9691,469,093,059914.343012.8673117.651512.87
2017AKAlaska285,697438,2402,060,349600.971521.2702127.827721.27
2017ALAlabama2,213,5923,786,69930,181,0451,136.201712.5466142.554812.55
2017ARArkansas1,380,1571,749,67617,026,7791,028.070210.2760105.644710.28
2017AZArizona2,764,3554,259,27534,251,2201,032.526012.4354128.398712.44
2017CACalifornia13,548,29516,500,84890,123,505554.334818.3092101.494018.3100
2017COColorado2,288,3582,264,55618,615,000677.887812.165282.466612.17
2017CTConnecticut1,495,5772,512,03312,379,520689.785120.2918139.970120.29
2017DCDistrict of Columbia267,448309,7642,394,652746.142612.935796.518512.94
2017DEDelaware426,071622,3854,662,598911.936813.3485121.729513.35
2017FLFlorida9,291,70714,097,730121,462,6221,089.346111.6066126.436511.61
2017GAGeorgia4,296,9776,516,80654,771,4491,062.208911.8982126.383511.9
2017HIHawaii432,952775,8532,629,679506.152929.5037149.333929.5
2017IAIowa1,375,5991,692,83213,721,869831.266312.3367102.551212.34
2017IDIdaho727,568876,3648,727,901999.666110.0409100.376010.0400
2017ILIllinois5,264,3335,661,90443,717,391692.037512.951189.626812.95
2017INIndiana2,834,0903,878,28131,551,558927.739212.2919114.036612.29
2017KSKansas1,259,2261,732,46113,013,422861.205113.3129114.651213.31
2017KYKentucky1,971,0022,699,91824,882,5821,052.027610.8506114.151710.85
2017LALouisiana2,073,6152,874,95729,531,9601,186.81479.7351115.53729.74
2017MAMassachusetts2,766,1543,879,09619,337,799582.571820.0597116.861920.0600
2017MDMaryland2,313,1893,640,76526,084,176939.690313.9578131.159713.96
2017MEMaine707,792740,6774,638,535546.127415.967987.205115.97
2017MIMichigan4,344,3215,078,01132,977,374632.576315.398597.407115.4
2017MNMinnesota2,403,1682,813,96921,573,800748.102813.043597.578513.04
2017MOMissouri2,771,1233,843,96833,051,080993.913511.6304115.596011.63
2017MSMississippi1,284,5781,932,65717,444,0161,131.630811.0792125.375611.08
2017MTMontana503,313572,2875,224,588865.033010.953794.753310.95
2017NCNorth Carolina4,488,0396,138,40456,133,9601,042.288210.9353113.977110.94
2017NDNorth Dakota380,101498,9024,848,3051,062.942310.2902109.379310.29
2017NENebraska841,9651,060,4369,667,990956.887610.9685104.956510.97
2017NHNew Hampshire618,356852,9814,441,497598.562619.2048114.952819.2
2017NJNew Jersey3,536,0874,344,09427,761,879654.251415.6477102.375315.65
2017NMNew Mexico880,867836,7726,497,207614.660212.878979.161812.88
2017NVNevada1,263,1011,550,49812,936,791853.507311.9852102.294411.99
2017NYNew York7,144,4138,849,14649,080,757572.484118.0298103.217618.03
2017OHOhio4,936,4716,287,04349,795,540840.606212.6257106.132512.63
2017OKOklahoma1,751,0342,316,98321,837,5961,039.271510.6101110.267410.61
2017OROregon1,725,8842,138,50520,065,930968.872110.6574103.256510.66
2017PAPennsylvania5,356,6937,359,03351,724,498804.670914.2274114.483514.23
2017RIRhode Island437,124554,7523,028,267577.308918.3191105.757918.32
2017SCSouth Carolina2,251,5583,804,26129,224,9711,081.657313.0172140.801113.02
2017SDSouth Dakota396,564547,5544,652,890977.751011.7680115.062111.77
2017TNTennessee2,847,6964,213,50639,292,5281,149.833910.7234123.301610.72
2017TXTexas10,809,49415,886,368144,242,1311,112.001911.0137122.472311.01
2017UTUtah1,063,2921,041,8209,510,783745.388110.954181.650510.95
2017VAVirginia3,398,5295,078,88943,982,4401,078.467611.5475124.536511.55
2017VTVermont313,670357,6412,023,424537.567117.675095.015217.68
2017WAWashington3,037,6743,600,61537,282,9011,022.79199.657698.77669.66
2017WIWisconsin2,681,3413,045,97221,233,154659.904714.345494.665714.35
2017WVWest Virginia858,9611,229,69910,573,4631,025.799711.6300119.301011.63
2017WYWyoming270,576315,2842,772,371853.848511.372497.102711.37
2017USUnited States132,579,747177,661,1671,378,647,742866.552512.8866111.669412.89
2016AKAlaska283,260407,3652,006,392590.268120.3034119.844320.3
2016ALAlabama2,200,5743,843,39532,055,5461,213.908511.9898145.545211.99
2016ARArkansas1,368,8671,764,93017,784,2331,082.66149.9241107.44479.92
2016AZArizona2,725,5104,094,42633,690,7831,030.106412.1530125.188412.15
2016CACalifornia13,445,13315,359,79688,311,069547.354617.392895.200517.39
2016COColorado2,260,0682,273,97918,833,722694.437912.074083.846312.07
2016CTConnecticut1,486,7412,536,77212,676,983710.557720.0108142.188620.0100
2016DCDistrict of Columbia259,392307,5062,501,892803.768012.290998.790612.29
2016DEDelaware419,234639,0864,763,106946.787513.4174127.034513.42
2016FLFlorida9,149,21413,545,273123,320,5471,123.234410.9838123.373710.98
2016GAGeorgia4,240,4216,659,24357,889,3791,137.650011.5034130.868411.5
2016HIHawaii430,941717,3902,611,727505.043427.4680138.725527.47
2016IAIowa1,358,9021,682,43314,093,678864.281011.9375103.173611.94
2016IDIdaho714,365813,4978,172,022953.29689.954794.89749.9500
2016ILIllinois5,231,5415,764,94545,990,052732.576612.535291.829912.54
2016INIndiana2,821,5463,892,45933,025,955975.409611.7861114.962411.79
2016KSKansas1,252,8461,764,17313,509,235898.569813.0590117.344413.06
2016KYKentucky1,957,1882,763,07726,338,4371,121.440410.4907117.646610.49
2016LALouisiana2,059,6992,861,96330,650,0671,240.07069.3375115.79219.34
2016MAMassachusetts2,740,8653,741,85919,692,896598.743319.0011113.767619
2016MDMaryland2,288,3013,886,43027,316,871994.801814.2272141.532614.23
2016MEMaine699,321725,7464,585,825546.461615.825986.482215.83
2016MIMichigan4,311,0085,258,08334,543,262667.733715.2217101.640615.22
2016MNMinnesota2,378,6812,762,79021,803,791763.861412.671196.790012.67
2016MOMissouri2,751,4603,850,74634,354,9321,040.506111.2087116.627411.21
2016MSMississippi1,278,6161,931,95818,458,9281,203.053910.4663125.914710.47
2016MTMontana497,170530,6614,852,547813.361510.935788.946910.94
2016NCNorth Carolina4,423,5326,446,11458,456,8091,101.246911.0271121.436011.03
2016NDNorth Dakota377,739481,7474,741,2981,045.981910.1607106.278610.16
2016NENebraska834,0381,055,5949,738,351973.012310.8396105.470210.84
2016NHNew Hampshire612,716815,7834,438,407603.652018.3801110.951818.38
2016NJNew Jersey3,510,1414,573,77429,090,726690.635315.7224108.584815.72
2016NMNew Mexico876,921799,3366,642,511631.234312.033675.960512.03
2016NVNevada1,143,6671,447,61912,691,942924.798811.4058105.480811.41
2016NYNew York7,118,9018,933,62350,831,287595.027317.5750104.576317.5800
2016OHOhio4,911,5976,551,23152,524,141891.158612.4728111.152412.47
2016OKOklahoma1,736,8192,323,58122,789,7151,093.460510.1957111.486410.2000
2016OROregon1,706,6221,980,61518,573,242906.920310.663896.712210.66
2016PAPennsylvania5,335,5557,470,00053,877,130841.479613.8649116.670213.86
2016RIRhode Island438,507573,6623,081,562585.616318.6159109.018018.62
2016SCSouth Carolina2,209,7833,873,81730,615,5961,154.547612.6531146.085912.65
2016SDSouth Dakota392,187529,5824,618,724981.403411.4660112.527511.47
2016TNTennessee2,812,2874,349,57441,773,8881,237.838610.4122128.886010.41
2016TXTexas10,521,73216,048,319145,973,1811,156.124510.9940127.104510.99
2016UTUtah1,041,8231,032,3429,370,656749.540011.016882.575011.02
2016VAVirginia3,362,9855,131,02545,186,0571,119.691211.3553127.144611.36
2016VTVermont312,239357,1282,056,402548.832317.366695.313717.37
2016WAWashington2,985,7993,244,68234,211,748954.84639.484190.55879.48
2016WIWisconsin2,662,2843,069,41021,814,249682.817514.070796.077014.07
2016WVWest Virginia860,3751,301,90311,375,5811,101.804511.4447126.098411.44
2016WYWyoming269,647306,2982,751,073850.208211.133894.660211.13
2016USUnited States131,068,760177,076,7381,411,058,153897.148812.5492112.585112.55
2015AKAlaska282,282405,2702,044,184603.469819.8255119.641019.8300
2015ALAlabama2,182,6163,731,83131,908,5301,218.283111.6954142.483111.7
2015ARArkansas1,356,6581,794,30318,273,3891,122.45129.8192110.21599.82
2015AZArizona2,689,2234,023,33333,167,2051,027.781512.1305124.674612.13
2015CACalifornia13,380,68415,187,82789,386,373556.687916.991294.588016.9900
2015COColorado2,225,7252,227,99018,384,936688.350112.118683.418112.12
2015CTConnecticut1,468,9582,699,30612,892,862731.406320.9364153.130420.94
2015DCDistrict of Columbia247,469324,3092,497,559841.034312.9850109.208612.99
2015DEDelaware413,445650,8354,848,998977.356513.4221131.181313.42
2015FLFlorida8,963,96714,216,590122,759,4721,141.230911.5808132.164211.58
2015GAGeorgia4,191,2096,511,15556,421,6501,121.825311.5402129.460611.54
2015HIHawaii428,339781,8962,641,336513.871829.6023152.117829.6
2015IAIowa1,356,6001,603,95113,786,328846.867711.634498.527611.63
2015IDIdaho701,447799,7008,054,693956.91399.928495.00609.93
2015ILIllinois5,172,6535,581,10144,645,638719.257612.500989.913612.5
2015INIndiana2,804,8613,753,08432,441,693963.853311.5687111.505311.57
2015KSKansas1,231,8301,634,55213,241,682895.800212.3440110.577512.34
2015KYKentucky1,947,0682,680,34326,168,0931,119.978610.2428114.717110.24
2015LALouisiana2,043,7602,943,58731,545,3131,286.24509.3313120.02339.33
2015MAMassachusetts2,794,9184,000,02220,175,317601.547719.8263119.264719.8300
2015MDMaryland2,255,5563,786,87627,403,3361,012.438313.8190139.909213.82
2015MEMaine699,241727,9224,662,301555.638315.612986.751415.61
2015MIMichigan4,282,8584,810,81533,357,876649.057914.421893.606014.42
2015MNMinnesota2,374,6742,630,74221,713,970761.998312.115492.319412.12
2015MOMissouri2,734,5533,799,96233,911,7601,033.434011.2054115.800811.21
2015MSMississippi1,270,3972,092,17718,561,1011,217.539411.2718137.239111.27
2015MTMontana491,422525,0044,825,213818.239910.880489.028010.88
2015NCNorth Carolina4,336,6986,531,84757,901,5571,112.627611.2810125.515011.28
2015NDNorth Dakota371,501467,8954,862,5421,090.74229.6224104.95609.6200
2015NENebraska825,9401,010,5279,532,132961.745810.6013101.957310.6
2015NHNew Hampshire607,465837,5494,526,948621.016318.5014114.896718.5
2015NJNew Jersey3,489,1114,607,27029,142,283696.029315.8096110.039315.81
2015NMNew Mexico871,047828,1696,641,724635.415812.469279.231212.47
2015NVNevada1,126,2201,574,10312,338,538912.975712.7576116.473912.76
2015NYNew York7,079,0979,456,18851,012,745600.509118.5369111.315818.54
2015OHOhio4,892,9166,590,56951,492,954876.998412.7990112.246812.8
2015OKOklahoma1,723,9382,293,59222,615,8241,093.224910.1415110.869810.14
2015OROregon1,686,9731,948,31518,269,007902.455010.664696.243110.66
2015PAPennsylvania5,304,2797,423,14554,418,663854.949113.6408116.622013.64
2015RIRhode Island440,191604,8253,135,506593.588219.2896114.500519.29
2015SCSouth Carolina2,185,9653,778,45130,059,1881,145.916012.5700144.042112.57
2015SDSouth Dakota388,374506,5224,571,325980.868311.0804108.684311.08
2015TNTennessee2,783,0584,291,88041,667,4111,247.650710.3003128.512110.3
2015TXTexas10,318,00616,838,434145,651,9131,176.357111.5607135.995511.56
2015UTUtah1,021,839992,2649,117,153743.524910.883580.921410.88
2015VAVirginia3,332,0835,221,25945,928,4111,148.641111.3683130.580511.37
2015VTVermont312,060356,9862,088,940557.836117.089395.330517.09
2015WAWashington2,945,7603,098,11034,071,987963.87099.092887.64329.09
2015WIWisconsin2,647,2242,994,38321,214,787667.831314.114694.261714.11
2015WVWest Virginia861,3341,153,34411,437,4511,106.563710.0839111.585110.08
2015WYWyoming268,226293,5172,676,702831.606610.965691.190810.97
2015USUnited States129,811,718177,623,6231,404,096,499901.367312.6504114.026412.65
2014AKAlaska281,438391,0682,043,614605.110819.1361115.794619.14
2014ALAlabama2,169,7903,781,91732,929,5981,264.699911.4849145.249011.48
2014ARArkansas1,345,0091,753,28418,441,1191,142.56489.5075108.62909.51
2014AZArizona2,661,6943,848,99832,346,0791,012.703411.8994120.505911.9
2014CACalifornia13,256,06814,517,39389,360,680561.759616.245891.262616.25
2014COColorado2,193,5202,203,83818,092,932687.362912.180783.725312.18
2014CTConnecticut1,459,2392,523,34912,777,579729.694219.7483144.101919.75
2014DCDistrict of Columbia239,355263,9732,072,205721.454512.738791.904312.74
2014DEDelaware407,508617,4004,644,841949.846613.2922126.255213.29
2014FLFlorida8,891,02013,854,538116,535,2631,092.256211.8887129.855211.89
2014GAGeorgia4,137,0576,659,46457,167,3871,151.530911.6491134.142511.65
2014HIHawaii425,168957,0732,583,770506.421437.0417187.587237.04
2014IAIowa1,348,6411,610,03614,426,582891.427111.160299.485111.16
2014IDIdaho690,277791,0998,134,913982.08329.724795.50509.7200
2014ILIllinois5,145,0225,481,12546,009,458745.209911.913088.777211.91
2014INIndiana2,784,6603,861,63633,703,9651,008.620011.4575115.562811.46
2014KSKansas1,228,8581,665,58313,684,952928.026412.1709112.949212.17
2014KYKentucky1,939,4892,785,00127,399,7681,177.276110.1643119.662110.16
2014LALouisiana2,026,2233,005,47231,400,6831,291.42929.5714123.60739.57
2014MAMassachusetts2,720,1283,490,56920,071,160614.896317.3910106.936417.39
2014MDMaryland2,234,9623,746,11527,487,6331,024.910513.6284139.678513.63
2014MEMaine706,952711,8134,660,605549.377815.273083.906315.27
2014MIMichigan4,273,1264,846,49633,514,991653.600214.460794.515014.46
2014MNMinnesota2,345,8602,737,89522,791,466809.634312.012897.259812.01
2014MOMissouri2,724,5413,807,78835,792,6441,094.760710.6385116.465710.64
2014MSMississippi1,263,5832,141,26418,922,0971,247.912811.3162141.216411.32
2014MTMontana485,041505,9624,969,243853.749610.181986.927710.18
2014NCNorth Carolina4,303,4766,511,38358,649,9941,135.709711.1021126.087711.1
2014NDNorth Dakota360,171490,0715,357,5141,239.57659.1474113.38859.15
2014NENebraska817,4251,043,02310,028,2381,022.340310.4009106.332210.4
2014NHNew Hampshire606,883790,6564,510,487619.351517.5293108.567917.53
2014NJNew Jersey3,470,8744,400,22827,892,582669.682015.7756105.646515.78
2014NMNew Mexico869,875812,0346,611,970633.421512.281377.792212.28
2014NVNevada1,110,5351,541,12111,916,521894.202712.9326115.644012.93
2014NYNew York7,046,82910,031,31649,974,914590.985820.0727118.626820.07
2014OHOhio4,882,1596,598,18152,804,334901.314612.4955112.624012.5
2014OKOklahoma1,710,3522,343,19923,351,1441,137.735810.0346114.167510.0300
2014OROregon1,669,1241,948,73218,617,613929.510210.467197.293210.47
2014PAPennsylvania5,289,2117,217,83154,195,335853.866113.3182113.719413.32
2014RIRhode Island438,879527,1163,070,347582.990417.1680100.087617.1700
2014SCSouth Carolina2,157,0913,824,28830,715,9861,186.628412.4505147.740912.45
2014SDSouth Dakota384,749505,3454,827,3681,045.566510.4683109.453410.47
2014TNTennessee2,756,9324,392,02342,538,2481,285.796710.3249132.757010.32
2014TXTexas10,138,87416,715,817140,899,7441,158.081811.8636137.390511.86
2014UTUtah1,000,416954,2318,963,971746.687010.645279.486210.65
2014VAVirginia3,303,6765,155,28146,443,7161,171.516111.1001130.039011.1
2014VTVermont310,932370,6732,121,347568.545317.473599.344617.47
2014WAWashington2,907,7053,040,58635,082,9581,005.45968.666887.14168.67
2014WIWisconsin2,631,4302,996,15221,925,712694.353513.665094.883513.67
2014WVWest Virginia862,8691,119,69811,990,7281,158.02909.3380108.13719.34
2014WYWyoming265,720288,8792,752,313863.162010.495990.596310.5
2014USUnited States128,680,416176,178,0081,407,208,311911.307012.5197114.092712.52
2013AKAlaska277,275381,1812,103,966632.334318.1173114.561718.12
2013ALAlabama2,158,8983,532,58431,378,6591,211.214411.2579136.357511.26
2013ARArkansas1,339,6801,746,48918,219,2871,133.31099.5859108.63849.59
2013AZArizona2,630,5953,877,98633,103,6021,048.672811.7147122.848811.71
2013CACalifornia13,256,42614,481,05489,241,934560.998016.226791.031716.23
2013COColorado2,169,3652,210,31618,528,908711.763911.929084.906411.93
2013CTConnecticut1,454,9632,305,82113,135,451752.335917.5542132.066417.55
2013DCDistrict of Columbia235,322255,5752,033,618720.154412.567590.505412.57
2013DEDelaware403,519591,9654,570,013943.783112.9532122.250512.95
2013FLFlorida8,756,32212,770,123113,293,9131,078.210611.2717121.532411.27
2013GAGeorgia4,101,3516,135,75553,544,4111,087.942511.4592124.669411.46
2013HIHawaii422,386964,8822,608,853514.705536.9849190.363436.9800
2013IAIowa1,341,8071,614,96814,625,866908.343911.0419100.298111.04
2013IDIdaho680,930803,6658,619,2621,054.83959.324198.35389.32
2013ILIllinois5,120,6074,927,66146,372,234754.666910.626380.193310.63
2013INIndiana2,771,2603,672,73933,406,6301,004.556010.9940110.441310.99
2013KSKansas1,222,9851,582,80713,593,003926.217611.6443107.851411.64
2013KYKentucky1,935,2452,623,03826,788,0981,153.51889.7918112.95039.7900
2013LALouisiana2,011,0442,895,48230,709,2061,272.52349.4287119.98259.43
2013MAMassachusetts2,708,7593,282,07420,727,624637.672815.8343100.971015.83
2013MDMaryland2,218,9483,638,09127,448,3671,030.832613.2543136.629713.25
2013MEMaine704,775669,2274,662,303551.275614.354079.130114.35
2013MIMichigan4,265,2644,962,36934,013,168664.538214.589696.953114.59
2013MNMinnesota2,329,7342,698,10322,849,542817.315811.808196.509711.81
2013MOMissouri2,708,9343,745,00235,318,2041,086.473010.6036115.205310.6
2013MSMississippi1,260,8921,989,58518,462,4151,220.195410.7764131.493210.78
2013MTMontana477,266508,8734,926,471860.189610.329488.852110.33
2013NCNorth Carolina4,268,0196,172,48756,251,2971,098.310010.9731120.518210.97
2013NDNorth Dakota348,486459,3605,038,8461,204.93759.1164109.84669.1200
2013NENebraska810,8671,037,78610,062,1591,034.094710.3138106.653910.31
2013NHNew Hampshire603,628743,5874,553,871628.680716.3287102.655216.3300
2013NJNew Jersey3,461,1094,489,69228,544,638687.271015.7287108.098615.73
2013NMNew Mexico865,195794,9166,803,987655.342311.683176.564211.68
2013NVNevada1,094,7701,444,31512,142,431924.275611.8948109.940511.89
2013NYNew York7,027,8669,543,51050,777,369602.095618.7948113.162718.79
2013OHOhio4,875,3466,264,30252,158,094891.528112.0102107.074512.01
2013OKOklahoma1,693,1512,244,42723,199,9681,141.85379.6743110.46609.67
2013OROregon1,650,8031,913,13719,328,558975.71509.898096.57619.9
2013PAPennsylvania5,272,8576,938,37454,251,847857.407512.7892109.655512.79
2013RIRhode Island438,198481,0143,164,692601.838315.199491.475815.2
2013SCSouth Carolina2,135,4323,455,72028,812,5181,124.382911.9938134.856411.99
2013SDSouth Dakota381,081494,8554,824,1501,054.926610.2579108.213010.26
2013TNTennessee2,738,5474,083,08840,905,9241,244.75759.9817124.24749.98
2013TXTexas9,954,30315,926,136140,272,6071,174.304611.3537133.327111.35
2013UTUtah981,194974,8229,401,748798.495510.368582.792210.37
2013VAVirginia3,273,5024,924,51045,416,2531,156.158710.8431125.362910.84
2013VTVermont311,308364,2452,125,435568.952917.137497.503917.14
2013WAWashington2,880,0083,129,36235,983,4861,041.18598.696790.54848.7000
2013WIWisconsin2,619,6762,993,09822,095,922702.883413.545995.212113.55
2013WVWest Virginia863,6411,103,10211,581,8251,117.53859.5244106.43919.52
2013WYWyoming263,614287,3802,829,496894.456810.156690.846210.16
2013USUnited States127,777,153169,130,6401,394,812,129909.664512.1257110.303112.13
2012AKAlaska275,405386,3042,160,196653.642217.8828116.889717.88
2012ALAlabama2,150,9773,491,38030,632,2611,186.757711.3977135.263311.4
2012ARArkansas1,332,1541,664,69617,909,3011,120.32229.2951104.13569.3000
2012AZArizona2,585,6383,718,35732,922,9701,061.084711.2941119.840111.29
2012CACalifornia13,101,88713,821,56590,109,995573.136215.338587.910815.34
2012COColorado2,149,6372,087,88918,220,365706.335011.459180.939611.46
2012CTConnecticut1,454,6512,212,59412,757,633730.853017.3433126.754017.34
2012DCDistrict of Columbia231,550245,9402,002,527720.696412.281588.512212.28
2012DEDelaware399,998614,0374,521,682942.021813.5798127.925013.58
2012FLFlorida8,645,20712,806,820112,127,0561,080.821011.4217123.448211.42
2012GAGeorgia4,071,4785,996,28653,660,1671,098.294211.1746122.729511.17
2012HIHawaii419,6121,022,9442,739,298544.014137.3433203.152837.3400
2012IAIowa1,334,5961,513,37613,987,613873.398710.819494.496510.82
2012IDIdaho673,368707,1818,159,3491,009.76848.667187.51798.67
2012ILIllinois5,098,6475,335,08846,901,870766.573811.375087.197811.38
2012INIndiana2,755,5953,469,89032,963,522996.866410.5265104.934710.53
2012KSKansas1,217,2561,551,10213,796,679944.520511.2426106.188411.24
2012KYKentucky1,924,6442,460,67426,096,7071,129.93659.4291106.54249.43
2012LALouisiana1,995,6612,514,35330,026,5881,253.82808.3738104.99258.3700
2012MAMassachusetts2,699,1413,029,29220,313,469627.158414.912793.526414.91
2012MDMaryland2,212,2873,424,55626,678,1581,004.923812.8366128.997612.84
2012MEMaine703,770656,8224,480,736530.563514.658877.774214.66
2012MIMichigan4,250,6204,871,03434,461,140675.610114.134995.496514.13
2012MNMinnesota2,317,3362,504,49122,059,631793.282711.353390.063611.35
2012MOMissouri2,699,2873,491,82734,336,6151,060.052010.1694107.800910.17
2012MSMississippi1,256,3921,846,70717,992,7081,193.411210.2636122.487410.26
2012MTMontana473,033481,8144,778,365841.795610.083284.880310.08
2012NCNorth Carolina4,230,5885,962,72054,671,5211,076.909410.9064117.452510.91
2012NDNorth Dakota342,549406,3324,484,7581,091.02599.060398.85019.06
2012NENebraska806,524972,3159,680,1431,000.191710.0444100.463510.0400
2012NHNew Hampshire601,697713,3884,439,208614.817816.070298.802216.07
2012NJNew Jersey3,455,3024,523,77028,662,958691.279615.7826109.102115.78
2012NMNew Mexico859,281769,3846,763,820655.957311.375074.615111.38
2012NVNevada1,080,5831,433,83212,122,718934.890211.8276110.575511.83
2012NYNew York7,010,7408,929,71350,691,506602.545817.6158106.143317.62
2012OHOhio4,869,3056,148,48952,287,769894.853411.7589105.225311.76
2012OKOklahoma1,679,2962,168,29222,809,6801,131.90699.5060107.59939.51
2012OROregon1,642,4441,848,67018,854,659956.63639.804893.79679.8000
2012PAPennsylvania5,261,3816,741,62752,876,058837.487012.7499106.778512.75
2012RIRhode Island435,448449,6043,121,367597.347814.404186.042414.4
2012SCSouth Carolina2,113,1443,338,09828,366,2631,118.643711.7678131.640311.77
2012SDSouth Dakota378,633448,3754,453,732980.221810.067498.682810.07
2012TNTennessee2,721,0994,015,59439,753,6311,217.450210.1012122.977110.1
2012TXTexas9,802,11015,087,710137,411,6331,168.214710.9799128.269210.98
2012UTUtah966,063912,3309,188,204792.58159.929478.69839.93
2012VAVirginia3,248,5184,822,89343,534,6751,116.783011.0783123.720311.08
2012VTVermont309,019356,3252,095,283565.036217.006196.090417.0100
2012WAWashington2,852,7603,028,28135,510,9611,037.32768.527788.46068.5300
2012WIWisconsin2,609,1682,905,40422,026,353703.492213.190692.794713.19
2012WVWest Virginia865,6731,102,69111,194,6791,077.64709.8501106.14979.85
2012WYWyoming261,191267,5062,716,528866.71189.847385.34819.85
2012USUnited States126,832,343163,280,3601,374,514,708903.104811.8791107.281011.88
2011AKAlaska273,855376,0052,134,422649.498817.6162114.417317.62
2011ALAlabama2,142,6253,661,47033,002,8151,283.581911.0944142.405911.09
2011ARArkansas1,328,2861,693,83618,787,3491,178.67129.0158106.26709.02
2011AZArizona2,575,5863,666,15333,079,0741,070.276611.0830118.618711.08
2011CACalifornia13,002,98013,060,94688,398,416566.526614.775183.704814.78
2011COColorado2,141,7802,059,15518,276,799711.121911.266580.118511.27
2011CTConnecticut1,453,8642,338,98012,918,796740.486318.1052134.066918.11
2011DCDistrict of Columbia229,450276,1542,061,392748.671513.3965100.295613.4
2011DEDelaware398,109634,5684,632,094969.603413.6994132.829613.7
2011FLFlorida8,575,89213,388,983116,341,1051,130.505411.5084130.102911.51
2011GAGeorgia4,056,1476,383,60157,749,5191,186.460911.0539131.150811.05
2011HIHawaii417,5311,015,6852,928,743584.536034.6799202.716534.68
2011IAIowa1,329,9051,499,14814,326,771897.731510.464093.938310.46
2011IDIdaho667,243660,5768,389,8661,047.82747.873582.50077.87
2011ILIllinois5,089,4495,545,10647,057,002770.499311.783890.794111.78
2011INIndiana2,744,8793,410,41333,912,0981,029.556610.0566103.538710.06
2011KSKansas1,215,4111,527,02514,343,748983.463510.6459104.698810.65
2011KYKentucky1,928,5232,502,96827,197,8361,175.24469.2028108.15579.2000
2011LALouisiana1,979,1752,869,88032,019,0401,348.16448.9630120.83658.9600
2011MAMassachusetts2,693,5483,003,30520,472,512633.381214.669992.916614.67
2011MDMaryland2,208,0153,634,38627,295,6751,030.174013.3149137.166413.31
2011MEMaine701,335674,0794,381,536520.618515.384580.094715.38
2011MIMichigan4,249,1364,621,16734,811,337682.714013.274990.629513.27
2011MNMinnesota2,308,7362,469,48722,523,727812.989110.963989.135610.96
2011MOMissouri2,693,2613,502,91135,941,2431,112.07339.7462108.38519.75
2011MSMississippi1,251,6401,966,08519,336,4301,287.406310.1678130.900610.17
2011MTMontana469,963479,1664,913,110871.18749.752884.96529.75
2011NCNorth Carolina4,201,8985,954,61558,055,8781,151.382010.2567118.093810.26
2011NDNorth Dakota330,738390,7724,552,2281,146.98748.584298.45968.58
2011NENebraska805,671927,3429,946,9731,028.84989.322995.91829.32
2011NHNew Hampshire599,532735,8324,454,088619.106216.5204102.278716.52
2011NJNew Jersey3,457,3254,772,50329,398,870708.613116.2336115.033616.23
2011NMNew Mexico856,128755,8586,873,748669.073210.996373.573311
2011NVNevada1,067,9441,334,06911,493,279896.838511.6074104.099511.61
2011NYNew York6,987,6319,356,96651,239,599611.075018.2612111.589618.2600
2011OHOhio4,874,4826,133,42553,687,111917.825911.4244104.856011.42
2011OKOklahoma1,667,2232,313,03024,425,0271,220.84389.4699115.61299.4700
2011OROregon1,633,5511,852,60319,429,175991.15249.535294.50809.5400
2011PAPennsylvania5,249,8277,265,43554,795,633869.800613.2592115.328213.26
2011RIRhode Island432,430448,5303,129,446603.073714.332686.436014.33
2011SCSouth Carolina2,101,5853,404,92830,801,7311,221.369111.0543135.014311.05
2011SDSouth Dakota374,260434,6554,646,3841,034.57139.354796.78109.35
2011TNTennessee2,708,1134,298,01843,067,8611,325.27289.9796132.25759.98
2011TXTexas9,621,48116,141,983145,654,2281,261.536811.0824139.808511.08
2011UTUtah946,468801,9668,946,741787.73058.963870.61048.9600
2011VAVirginia3,225,3954,871,34945,771,1441,182.572110.6428125.859210.64
2011VTVermont308,992345,5252,124,533572.974116.263693.186116.2600
2011WAWashington2,837,6313,010,49336,376,1431,068.26628.276088.40988.2800
2011WIWisconsin2,601,8792,884,51222,149,941709.421313.022792.385513.02
2011WVWest Virginia868,0361,103,04011,746,1511,127.65599.3907105.89429.39
2011WYWyoming258,528255,2632,802,726903.42449.107782.28099.11
2011USUnited States126,143,072166,713,9481,422,801,093939.938711.7173110.135511.72
2010AKAlaska271,956340,3402,093,217641.408016.2592104.287716.2600
2010ALAlabama2,138,9113,790,73435,529,2921,384.243810.6693147.689410.67
2010ARArkansas1,322,8331,702,93819,230,9611,211.47578.8552107.27858.86
2010AZArizona2,554,2133,558,16132,448,1381,058.647610.9657116.088010.97
2010CACalifornia12,947,91712,873,56587,256,946561.589314.753682.854814.75
2010COColorado2,128,5071,997,85818,102,386708.727811.036478.218311.04
2010CTConnecticut1,451,8082,514,46613,065,275749.942819.2454144.329619.25
2010DCDistrict of Columbia227,550297,4502,123,312777.599114.0088108.932114.01
2010DEDelaware396,114657,1034,759,9731,001.389513.8048138.239513.8
2010FLFlorida8,529,20413,982,240122,244,6501,194.373411.4379136.611411.44
2010GAGeorgia4,054,1456,198,37061,554,4981,265.258510.0697127.408110.07
2010HIHawaii414,568840,0722,989,499600.926528.1008168.864928.1
2010IAIowa1,327,8961,516,86214,554,888913.405410.421795.192110.42
2010IDIdaho664,717649,7598,136,7361,020.07527.985581.45817.99
2010ILIllinois5,070,0565,599,01948,582,984798.528111.524692.027611.52
2010INIndiana2,742,7893,350,35535,058,3721,065.16809.5565101.79289.56
2010KSKansas1,213,0361,437,10214,334,086984.725210.025898.726310.0300
2010KYKentucky1,930,6662,496,77029,136,5181,257.61958.5692107.76818.57
2010LALouisiana1,973,1742,935,16932,678,9311,380.13398.9818123.96148.98
2010MAMassachusetts2,674,7173,124,52821,409,005667.017814.594597.347614.59
2010MDMaryland2,200,3684,142,93528,934,0741,095.804414.3185156.903114.32
2010MEMaine699,625687,0374,371,835520.735515.715181.834015.72
2010MIMichigan4,245,1584,320,77534,680,715680.789612.458784.817712.46
2010MNMinnesota2,300,2912,379,11322,464,797813.839010.590486.188810.59
2010MOMissouri2,695,8093,385,58237,302,2791,153.09489.0761104.65579.08
2010MSMississippi1,250,1491,991,61220,174,8261,344.82819.8718132.75839.8700
2010MTMontana467,878434,4204,742,794844.73489.159677.37429.16
2010NCNorth Carolina4,185,5406,288,49362,160,1071,237.596310.1166125.202710.1200
2010NDNorth Dakota326,409357,0524,392,5961,121.44488.128591.15668.1300
2010NENebraska801,101903,39310,106,6731,051.33158.938693.97418.94
2010NHNew Hampshire597,411732,0384,485,469625.681616.3202102.112616.32
2010NJNew Jersey3,454,8405,021,99730,307,268731.034016.5703121.134316.57
2010NMNew Mexico853,811710,5486,752,473659.052310.522869.350610.52
2010NVNevada1,058,5191,435,69911,614,669914.380512.3611113.027312.36
2010NYNew York6,954,9169,547,88450,945,648610.427318.7413114.402118.7400
2010OHOhio4,877,2296,161,97054,474,377930.760411.3117105.284711.31
2010OKOklahoma1,660,6532,164,32823,688,8611,188.73229.1365108.60839.14
2010OROregon1,629,0761,671,72718,838,666963.66838.873985.51518.8700
2010PAPennsylvania5,244,2787,017,22355,252,837877.986112.7002111.506012.7
2010RIRhode Island430,623496,4813,117,808603.352215.924096.078015.92
2010SCSouth Carolina2,089,3023,449,57432,852,0861,310.329410.5003137.588810.5
2010SDSouth Dakota370,566415,3384,628,1231,040.77798.974293.40178.9700
2010TNTennessee2,704,0544,172,36245,191,0271,392.69379.2327128.58359.23
2010TXTexas9,536,77815,905,877137,161,4021,198.530211.5965138.987211.6
2010UTUtah936,602769,1458,834,230786.01788.706468.43408.7100
2010VAVirginia3,258,9595,061,60348,438,9581,238.610210.4494129.427910.45
2010VTVermont307,839331,3902,127,935576.041115.573389.708715.57
2010WAWashington2,825,2812,805,59134,906,9261,029.60048.037382.75268.0400
2010WIWisconsin2,594,6982,820,62122,299,493716.187812.648890.589312.65
2010WVWest Virginia867,9481,094,17412,442,5831,194.63608.7938105.05378.7900
2010WYWyoming257,447239,1982,727,201882.77108.770877.42638.77
2010USUnited States125,717,935166,778,0411,445,708,403958.301611.5361110.550411.54

Download the same complete table (CSV)

Every geography’s annual change and midpoint accounting, all 52 rows

All 52 matched geographies. Price and usage terms use the symmetric midpoint identity; export residual retained. Accounting, not causal effects.

Period: 2024 to 2025, same October 2026 historical source edition. Units: NominalUSD/account/month andpercent change; accounting components/residualUSD.

Original sources: EIA annual state residential workbook, Total Electric Industry, columnsC:F

Every geography’s annual change and midpoint accounting; 2024 to 2025, same October 2026 historical source edition; NominalUSD/account/month andpercent change; accounting components/residualUSD
statestate namebill 2024 usdbill 2025 usdbill change usdbill change pctprice component usdusage component usdrounding residual usd
AKAlaska143.5358147.18493.64902.54227.3542-3.7052-0.0000
ALAlabama173.5022184.309510.80736.228910.45850.34890.0000
ARArkansas129.1344138.42019.28587.19085.84683.4389-0.0000
AZArizona160.2352157.1544-3.0807-1.92263.6985-6.77930.0000
CACalifornia160.8599154.7339-6.1261-3.8083-3.0620-3.06400.0000
COColorado100.5725103.29802.72552.71005.1709-2.4453-0.0000
CTConnecticut199.6576206.45596.79833.40503.96152.83680
DCDistrict of Columbia113.2286140.052626.824123.690226.9166-0.09250.0000
DEDelaware150.8693157.79736.92804.59215.32641.60160.0000
FLFlorida156.0892167.856611.76747.538911.8929-0.1255-0.0000
GAGeorgia151.2481158.69997.45184.92687.08330.3685-0.0000
HIHawaii212.1216207.8903-4.2313-1.9948-12.46158.23020.0000
IAIowa111.5378117.29755.75975.16391.88233.87750.0000
IDIdaho108.7273110.35561.62831.49762.9225-1.2942-0.0000
ILIllinois109.9916126.588216.596615.088912.68123.9153-0.0000
INIndiana133.0587149.715416.656712.518310.99705.65980.0000
KSKansas123.9017126.42232.52062.03432.50200.01850.0000
KYKentucky133.8053143.71729.91207.40773.72796.18410.0000
LALouisiana140.9623153.321212.35908.76769.56862.7904-0.0000
MAMassachusetts167.1998181.076713.87698.29966.15677.72020.0000
MDMaryland165.8711184.419018.547911.182115.62302.92490.0000
MEMaine133.5951147.670114.075010.535618.4583-4.3833-0.0000
MIMichigan119.3084127.17167.86336.59074.59523.26800.0000
MNMinnesota110.0580117.66807.61006.91452.73014.8799-0.0000
MOMissouri129.1844137.97108.78666.80163.95094.83570.0000
MSMississippi154.8255166.053911.22847.25237.40773.8208-0.0000
MTMontana107.9069110.79862.89172.67992.83000.0618-0.0000
NCNorth Carolina143.4987146.13572.63701.8376-1.40554.0425-0.0000
NDNorth Dakota118.3783126.40178.02346.77783.21904.80440.0000
NENebraska110.2773117.23456.95726.30885.05011.90700.0000
NHNew Hampshire144.8698156.937512.06778.33007.06265.0051-0.0000
NJNew Jersey128.1285150.585822.457317.527220.91411.5432-0.0000
NMNew Mexico92.875294.64981.77461.91074.1841-2.40950.0000
NVNevada139.3858115.0693-24.3165-17.4455-15.5708-8.74570.0000
NYNew York139.5322154.745415.213210.903011.36333.84990.0000
OHOhio135.1610147.739112.57819.30607.89074.68740.0000
OKOklahoma132.0456140.51958.47396.417410.3743-1.90040.0000
OROregon129.6189133.89144.27253.29626.6856-2.41310.0000
PAPennsylvania145.1722161.896216.724011.520112.62884.09520.0000
RIRhode Island162.4036165.62453.22081.98324.6875-1.46670
SCSouth Carolina149.5073161.209511.70227.82729.34512.3571-0.0000
SDSouth Dakota127.8096131.10293.29342.57684.5628-1.26940.0000
TNTennessee143.3176156.034412.71688.87329.27563.44120.0000
TXTexas163.7226170.94707.22454.41265.08402.1405-0.0000
USUnited States142.2618150.67778.41595.91586.56161.85430.0000
UTUtah94.567999.05524.48744.74516.1467-1.65940.0000
VAVirginia148.7679163.047714.27989.59879.14895.13090.0000
VTVermont125.6554134.77849.12307.26035.14213.9809-0.0000
WAWashington113.6820124.405710.72379.433012.0945-1.3708-0.0000
WIWisconsin110.8653120.60059.73518.78105.86833.86680.0000
WVWest Virginia154.7553165.129910.37466.70393.30547.0692-0.0000
WYWyoming107.6458111.59093.94513.66487.6402-3.6952-0.0000

Download the same complete table (CSV)

State sums and producer national totals, all 48 rows

All 16 years, accounts, sales and revenue individually. Signed residual equals sum of 51 geographies minus producerU.S. total. Do not add residuals across units.

Period: 2010 through 2025. Units: Count for accounts;MWh for sales; thousand nominal USD for revenue.

Original sources: EIA annual state residential workbook, Total Electric Industry, columnsC:F

State sums and producer national totals; 2010 through 2025; Count for accounts;MWh for sales; thousand nominal USD for revenue
yearmeasurestate sumpublished ussum minus us
2010accounts125,717,935125,717,9350
2010sales_mwh1,445,708,4031,445,708,4030
2010revenue_thousand_usd166,778,041166,778,0410
2011accounts126,143,072126,143,0720
2011sales_mwh1,422,801,0931,422,801,0930
2011revenue_thousand_usd166,713,950166,713,9482
2012accounts126,832,343126,832,3430
2012sales_mwh1,374,514,7081,374,514,7080
2012revenue_thousand_usd163,280,362163,280,3602
2013accounts127,777,153127,777,1530
2013sales_mwh1,394,812,1291,394,812,1290
2013revenue_thousand_usd169,130,640169,130,6400
2014accounts128,680,416128,680,4160
2014sales_mwh1,407,208,3111,407,208,3110
2014revenue_thousand_usd176,178,013176,178,0085
2015accounts129,811,718129,811,7180
2015sales_mwh1,404,096,4991,404,096,4990
2015revenue_thousand_usd177,623,627177,623,6234
2016accounts131,068,760131,068,7600
2016sales_mwh1,411,058,1531,411,058,1530
2016revenue_thousand_usd177,076,740177,076,7382
2017accounts132,579,747132,579,7470
2017sales_mwh1,378,647,7421,378,647,7420
2017revenue_thousand_usd177,661,170177,661,1673
2018accounts133,893,321133,893,3210
2018sales_mwh1,469,093,0591,469,093,0590
2018revenue_thousand_usd189,032,971189,032,9692
2019accounts135,249,616135,249,6160
2019sales_mwh1,440,288,9091,440,288,9090
2019revenue_thousand_usd187,436,040187,436,0373
2020accounts136,682,001136,682,0010
2020sales_mwh1,464,605,0461,464,605,0460
2020revenue_thousand_usd192,663,212192,663,2084
2021accounts138,308,772138,308,7720
2021sales_mwh1,470,486,8821,470,486,8820
2021revenue_thousand_usd200,833,876200,833,8742
2022accounts139,854,178139,854,1780
2022sales_mwh1,509,233,1621,509,233,1620
2022revenue_thousand_usd226,989,650226,989,6473
2023accounts141,282,713141,282,7130
2023sales_mwh1,450,025,1841,450,025,1840
2023revenue_thousand_usd231,992,669231,992,6663
2024accounts143,144,185143,144,1850
2024sales_mwh1,482,873,5861,482,873,5860
2024revenue_thousand_usd244,367,412244,367,4093
2025accounts144,800,940144,800,9400
2025sales_mwh1,519,150,9691,519,150,9690
2025revenue_thousand_usd261,819,295261,819,2914

Download the same complete table (CSV)

2024 published bill and current historical reconstruction, all 52 rows

All 50 states, DC andU.S. matched by explicit source state name. Prior worksheetTable 5 Asource rows retained. Binary representation of source decimal cells not treated as added precision.

Period: 2024 observations, October 2025 Table 5 AandOctober 2026 historical edition. Units: NominalUSD/account/month; kWh/account/month; cents/kWh; customer accounts.

Original sources: EIA annual state residential workbook, Total Electric Industry, columnsC:F · EIA residential bill Table 5 A, cellsA:E

2024 published bill and current historical reconstruction; 2024 observations, October 2025 Table 5 AandOctober 2026 historical edition; NominalUSD/account/month; kWh/account/month; cents/kWh; customer accounts
statestate nametable5a bill usdcurrent 2024 bill usdcurrent minus prior usdtable5a monthly kwhtable5a price cents kwhtable5a customerssource row
CTConnecticut199.6576199.65760.0000694.570728.74551,552,7465
MEMaine133.5951133.5951-0.0000550.075024.2867742,5496
MAMassachusetts167.1998167.19980.0000569.681329.34972,924,5357
NHNew Hampshire144.8698144.8698-0.0000618.983523.4045652,6088
RIRhode Island162.4036162.40360.0001566.872128.6491457,3839
VTVermont125.6555125.6554-0.0000573.670421.9038323,96010
NJNew Jersey128.1285128.12850.0000662.380419.34363,735,63812
NYNew York139.5322139.53220.0000571.158024.42977,420,21413
PAPennsylvania145.1721145.17220.0000817.173717.76525,534,58014
ILIllinois109.9916109.99160.0000693.106315.86945,392,47716
INIndiana133.0587133.0587-0.0000901.131814.76573,056,21617
MIMichigan119.3084119.30840.0000618.213219.29894,516,36718
OHOhio135.1610135.16100.0000845.541015.98525,142,10819
WIWisconsin110.8653110.86530.0000645.145817.18452,843,87420
IAIowa111.5377111.53780.0000832.221513.40241,448,81822
KSKansas123.9017123.90170.0000875.663814.14951,317,09523
MNMinnesota110.0580110.0580-0.0000712.295615.45122,581,18024
MOMissouri129.1844129.1844-0.00001,000.56612.91112,933,91425
NENebraska110.2773110.27730.0000956.376711.5307905,41526
NDNorth Dakota118.3783118.3783-0.00001,028.631111.5083397,83927
SDSouth Dakota127.8096127.8096-0.0000993.751412.8613433,54828
DEDelaware150.8694150.8693-0.0000910.669916.5669473,50830
DCDistrict of Columbia113.2286113.2286-0.0001639.366017.7095318,78031
FLFlorida156.0892156.0892-0.00001,104.13514.136810,443,37332
GAGeorgia151.2481151.24810.00001,074.013414.08254,815,50133
MDMaryland165.8711165.87110.0000928.837317.85792,451,75334
NCNorth Carolina143.4987143.4987-0.00001,015.322314.13335,067,76235
SCSouth Carolina149.5072149.50730.00001,050.422914.23312,581,88236
VAVirginia148.7679148.76790.00001,032.358714.41053,654,48137
WVWest Virginia154.7553154.7553-0.00001,026.644115.0739866,45638
ALAlabama173.5022173.5022-0.00001,143.199615.17692,398,17240
KYKentucky133.8053133.80530.00001,046.501712.78602,077,21541
MSMississippi154.8255154.8255-0.00001,155.897713.39441,340,45942
TNTennessee143.3176143.31760.00001,153.560712.42393,166,10343
ARArkansas129.1344129.1344-0.00001,048.371812.31761,476,94445
LALouisiana140.9623140.9623-0.00001,201.835711.72892,147,74546
OKOklahoma132.0456132.0456-0.00001,079.059612.23711,878,81847
TXTexas163.7226163.722601,096.147814.936212,547,86348
AZArizona160.2352160.2352-0.00001,074.916914.90683,134,73350
COColorado100.5724100.57250.0000674.220014.91692,557,73251
IDIdaho108.7274108.7273-0.0000943.804911.5201868,14152
MTMontana107.9069107.9069-0.0000852.157912.6628557,43253
NVNevada139.3859139.3858-0.0000929.511314.99561,311,75554
NMNew Mexico92.875192.87520.0000654.100014.1989936,09855
UTUtah94.567894.56790.0000774.190812.21511,272,86156
WYWyoming107.6459107.6458-0.0001863.382812.4679286,47557
CACalifornia160.8599160.85990.0000503.208931.966814,217,18059
OROregon129.6189129.61890.0000881.853114.69851,868,01260
WAWashington113.6820113.6820-0.0000955.452111.89823,368,97861
AKAlaska143.5359143.5358-0.0000578.254824.8222298,39763
HIHawaii212.1215212.12160.0001494.871742.8639446,51264
USU.S. Total142.2618142.2618-0.0000863.275016.4793143,144,18565

Download the same complete table (CSV)

All 2025 state bills, prices, usage and separate ranks, all 52 rows

All 50 states and DCranked separately for each measure. U.S. comparator is explicitly not ranked because it is not a state. Descending competition ranking.

Period: 2025 final annual observations, released October 2026. Units: NominalUSD/account/month; kWh/account/month; cents/kWh; ranks 1 through 51; national gapUSD and percent.

Original sources: EIA annual state residential workbook, Total Electric Industry, columnsC:F

All 2025 state bills, prices, usage and separate ranks; 2025 final annual observations, released October 2026; NominalUSD/account/month; kWh/account/month; cents/kWh; ranks 1 through 51; national gapUSD and percent
yearstatestate nameaccountsrevenue thousand usdsales mwhmonthly use kwheffective price cents kwhmonthly bill usdpublished price cents kwhbill rankprice rankusage rankbill vs us usdbill vs us pct
2025AKAlaska301,478532,4762,039,337563.705326.1103147.184926.1126847-3.4928-2.3181
2025ALAlabama2,422,9815,358,94233,304,2901,145.431016.0908184.309516.09420433.631822.3204
2025ARArkansas1,491,0302,476,66319,246,4581,075.680212.8682138.420112.8731479-12.2576-8.1350
2025AZArizona3,203,5786,041,47839,595,0281,029.968915.2582157.154415.261628176.47674.2984
2025CACalifornia14,371,58126,685,24585,113,825493.530931.3524154.733931.35202514.05622.6919
2025COColorado2,601,4573,224,70420,548,681658.242715.6930103.298015.69492339-47.3797-31.4444
2025CTConnecticut1,581,5253,918,18213,367,238704.343329.3118206.455929.31253655.778237.0182
2025DCDistrict of Columbia324,763545,8072,489,890638.899221.9209140.052621.92301241-10.6251-7.0515
2025DEDelaware481,801912,3235,320,069920.170517.1487157.797317.15001518247.11964.7251
2025FLFlorida10,682,97021,518,482141,435,6391,103.279615.2143167.856615.21729617.178911.4011
2025GAGeorgia4,870,2279,274,85462,917,7031,076.570314.7412158.699914.74143288.02225.3241
2025HIHawaii448,8691,119,7862,772,081514.641840.3951207.890340.4115057.212637.9702
2025IAIowa1,460,5912,055,88415,089,329860.914613.6248117.297513.62433629-33.3802-22.1534
2025IDIdaho887,7451,175,6129,936,216932.720511.8316110.355611.83485023-40.3221-26.7605
2025ILIllinois5,423,1848,238,13346,625,606716.455017.6687126.588217.6700371735-24.0895-15.9874
2025INIndiana3,084,0755,540,80334,713,250937.970315.9616149.715415.96232122-0.9623-0.6386
2025KSKansas1,326,7792,012,81313,943,812875.793414.4352126.422314.44383325-24.2554-16.0976
2025KYKentucky2,088,9333,602,58827,428,9731,094.217813.1342143.717213.1328447-6.9605-4.6194
2025LALouisiana2,156,7113,968,03531,699,8331,224.852412.5175153.321212.52214812.64351.7544
2025MAMassachusetts2,919,1866,343,15920,861,216595.520330.4065181.076730.41534430.399020.1748
2025MDMaryland2,471,2185,468,87428,008,354944.485519.5259184.419019.533142133.741322.3930
2025MEMaine749,2321,327,6704,793,977533.210127.6945147.670127.6925649-3.0076-1.9961
2025MIMichigan4,538,5806,926,14334,574,788634.831220.0324127.171620.03361343-23.5061-15.6002
2025MNMinnesota2,605,5583,679,08923,246,776743.499615.8262117.668015.83422234-33.0097-21.9075
2025MOMissouri2,953,5154,889,99436,770,0421,037.465613.2989137.971013.3323916-12.7067-8.4330
2025MSMississippi1,347,9482,685,98519,147,8271,183.764014.0276166.053914.03834215.376210.2047
2025MTMontana565,902752,4145,790,125852.639512.9948110.798612.99474630-39.8791-26.4665
2025NCNorth Carolina5,162,8939,053,79664,684,6601,044.063513.9968146.135714273515-4.5420-3.0144
2025NDNorth Dakota400,162606,9745,137,2591,069.829011.8151126.401711.82395111-24.2760-16.1112
2025NENebraska915,7581,288,30110,687,424972.548112.0544117.234512.05444919-33.4432-22.1952
2025NHNew Hampshire658,1041,239,3745,053,198639.868224.5265156.937524.53179406.25974.1544
2025NJNew Jersey3,782,9136,835,83630,403,688669.759222.4836150.585822.48221137-0.0919-0.0610
2025NMNew Mexico946,3091,074,8157,239,364637.508814.846894.649814.85513142-56.0280-37.1840
2025NVNevada1,335,5811,844,21313,905,209867.613013.2627115.069313.26454027-35.6084-23.6321
2025NYNew York7,462,70913,857,83952,505,369586.308226.3932154.745426.39197464.06772.6996
2025OHOhio5,149,8839,130,07254,014,836874.046316.9029147.739116.9000241926-2.9386-1.9502
2025OKOklahoma1,897,4623,199,56424,229,5401,064.120613.2052140.519513.21294214-10.1583-6.7417
2025OROregon1,889,2903,035,51619,630,148865.852115.4635133.891415.46342428-16.7863-11.1405
2025PAPennsylvania5,565,99310,813,35656,056,917839.277019.2900161.896219.2912153111.21857.4453
2025RIRhode Island464,880923,9463,134,178561.825629.4797165.624529.48944814.94689.9197
2025SCSouth Carolina2,629,2905,086,39733,649,1921,066.485415.1160161.209515.1213301310.53176.9896
2025SDSouth Dakota446,014701,6855,266,829984.055213.3227131.102913.32353818-19.5748-12.9911
2025TNTennessee3,199,4875,990,76145,320,1081,180.400413.2188156.034413.22184135.35673.5551
2025TXTexas12,794,15226,245,470170,458,1291,110.260715.3970170.947015.4625520.269313.4521
2025UTUtah1,305,5081,551,80911,922,485761.037413.015899.055213.02504533-51.6225-34.2602
2025VAVirginia3,684,4987,208,98747,172,7141,066.918615.2821163.047715.2811271212.37008.2096
2025VTVermont313,956507,7742,228,407591.486022.7864134.778422.79331045-15.8993-10.5518
2025WAWashington3,407,7255,087,28438,623,804944.515913.1714124.405713.17404320-26.2720-17.4359
2025WIWisconsin2,867,5724,149,96622,954,686667.076718.0789120.600518.0800411638-30.0773-19.9613
2025WVWest Virginia866,8161,717,64711,161,7111,073.056515.3887165.129915.3910261014.45229.5915
2025WYWyoming292,568391,7752,930,751834.777713.3677111.590913.37463732-39.0868-25.9407
2025USUnited States144,800,940261,819,2911,519,150,969874.275517.2346150.677717.23Not ranked, U.S. totalNot ranked, U.S. totalNot ranked, U.S. total00

Download the same complete table (CSV)

Data and downloads

Read the tables directly or download the research. No form or account is required.

Reproducible research bundle (ZIP) · Full data dictionary · Calculation program (Python)

Annual residential panel 2010 2025 (CSV)

Bill change decomposition 2024 2025 (CSV)

National total reconciliation (CSV)

Prior table5a vintage audit (CSV)

Source inputs 2010 2025 (CSV)

State rankings 2025 (CSV)

Cite this page

Name the 2025 data year, residential customer account denominator and nominal dollar measure. AMR calculates these averages from EIA final annual source inputs.

American Mineral Registry. "Residential Electricity Bill Statistics by State: Prices, Usage and Change." American Mineral Registry, November 2026. https://americanmineralregistry.com/research/us-residential-electricity-bill-statistics-by-state/
<a href="https://americanmineralregistry.com/research/us-residential-electricity-bill-statistics-by-state/">U.S. Residential Electricity Bills by State</a> (American Mineral Registry, November 2026)