American Mineral RegistryResearch & data

State Electricity Generation Statistics: Gas, Coal and Fuel Mix

Updated

State electricity generation statistics show that the largest producer of a fuel is not necessarily the state with the highest share from that fuel. In EIA’s final 2025 annual workbook, natural gas supplied 40.93% of U.S. net generation, nuclear 17.75% and coal 16.61% within the selected Total Electric Power Industry series. Texas generated the most electricity from both natural gas and coal, but Rhode Island had the highest reported gas share and West Virginia the highest reported coal share. American Mineral Registry calculates each share using the same year’s published all-source total. (EIA, state generation workbook, Sep 2026).

On this page
  1. Key Takeaways
  2. What does the U.S. electricity generation mix look like?
  3. Which source supplies the largest reported share in each state?
  4. Why do gas and coal volume rankings differ from share rankings?
  5. How do nuclear, wind and solar comparisons change the picture?
  6. How did gas and coal generation change from 2015 to 2025?
  7. What do the source boundaries and accounting details change?
  8. Methodology and Sources

This reference covers state totals, largest reported fuels, national history and source accounting, with fuel rankings restricted to numeric source rows, exact cells and downloads. The data describe electricity generated in a location, not electricity consumed there, installed capacity, utility bills or a customer’s electricity supply contract. Separate estimates of small solar generation are not added to this EIA923-based series.

Key Takeaways

What does the U.S. electricity generation mix look like?

Natural gas was the largest reported national source in 2025. Nuclear and coal followed, while wind, the reported solar category and conventional hydro supplied additional large volumes. The denominator is the workbook’s published Total Electric Power Industry net generation, not national electricity consumption.

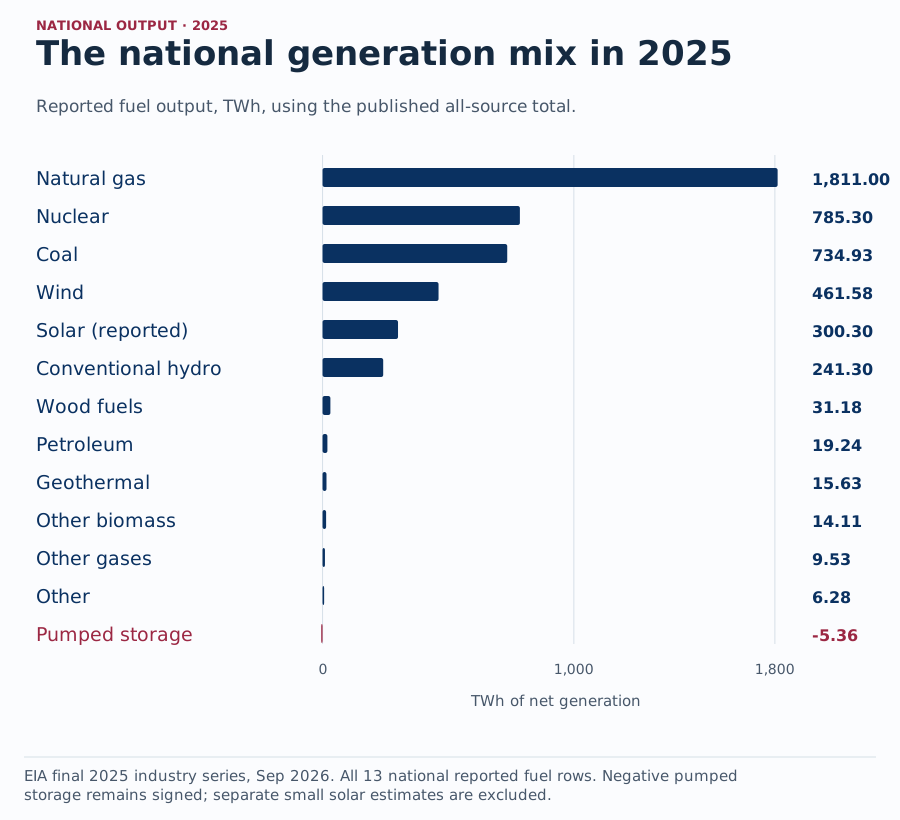
State electricity generation statistics show the full national 2025 reported fuel mix, including natural gas 1,811.00 TWh, coal 734.93 TWh and negative pumped storage.
Figure 1: Every national fuel row uses the same published total of 4,425.03 TWh. Negative net storage remains negative; small categories are labelled rather than rounded away or combined with an invented balancing category. Source: EIA state generation workbook, Sep 2026. Chart drawn by American Mineral Registry from the source figures, checked 15 Nov 2026.

Download original chart (SVG)

Figure 1 in text

NATIONAL OUTPUT · 2025 The national generation mix in 2025 Reported fuel output, TWh, using the published all-source total. 0 1,000 1,800 Natural gas

1,811.00 Nuclear

785.30 Coal

734.93 Wind

461.58 Solar (reported)

300.30 Conventional hydro

241.30 Wood fuels

31.18 Petroleum

19.24 Geothermal

15.63 Other biomass

14.11 Other gases

9.53 Other

6.28 Pumped storage

-5.36 TWh of net generation EIA final 2025 industry series, Sep 2026. All 13 national reported fuel rows. Negative pumped storage remains signed; separate small solar estimates are excluded.

Source and data: EIA state generation workbook

How much electricity came from the principal sources?

The national comparison keeps each producer fuel label and calculates its share of the published all-source total. One TWh equals one million MWh, so the article’s readable volumes are direct unit conversions from the source fields.

These values concern electrical output after the source’s net generation accounting. They are not the heat content of fuel delivered to plants. A gas volume in cubic feet, a coal weight in tons and electricity output in MWh cannot be substituted for one another. Conversion to fuel input would require heat content, technology and efficiency evidence beyond this workbook. A writer describing national electricity output can use these figures directly, while retaining the series and data year in the sentence. (EIA, state generation workbook, Sep 2026). For the separate question of federal coal royalty dollars, use the federal coal royalty revenue reference.

How much came from wind, solar and conventional hydro?

The workbook reports wind, solar thermal and photovoltaic generation, and conventional hydro as separate categories. AMR preserves that taxonomy instead of folding them into a new renewable definition whose scope would be unclear.

The solar figure belongs to this generating-facility series. EIA publishes separate estimates for small solar photovoltaic systems through other survey inputs and estimation methods. Those estimates are not silently appended here, because adding one fuel’s extra output without rebuilding the all-source denominator would change the meaning of every share. The EIA reporting instructions define the survey’s grid connection and one MW plant threshold; the technical notes separately explain small solar estimation. (EIA, state generation workbook, Sep 2026).

Why are the smaller and negative categories retained?

Small categories still contribute to the accounting, and a negative net value is information rather than an error to erase. The national source includes separate other gases, petroleum, biomass, wood, other and pumped storage rows.

Net generation subtracts electricity used to operate the generating facility from gross production. Pumped storage can consume more electricity in pumping and operation than it returns through generation over an annual period. Its negative value should not be converted to zero to make a chart easier to read. Other signed source values are also retained without guessing their individual causes. The accounting table allows a reader to inspect all reported rows, including the categories whose shares disappear when a display rounds every value to whole percentages. (EIA, state generation workbook, Sep 2026).

Which source supplies the largest reported share in each state?

Natural gas was the largest reported fuel in 28 state and DC generation mixes. Coal led in nine, wind in five, conventional hydro in four, nuclear in four and petroleum in one. The classification compares each geography’s reported fuel volumes using its own source total.

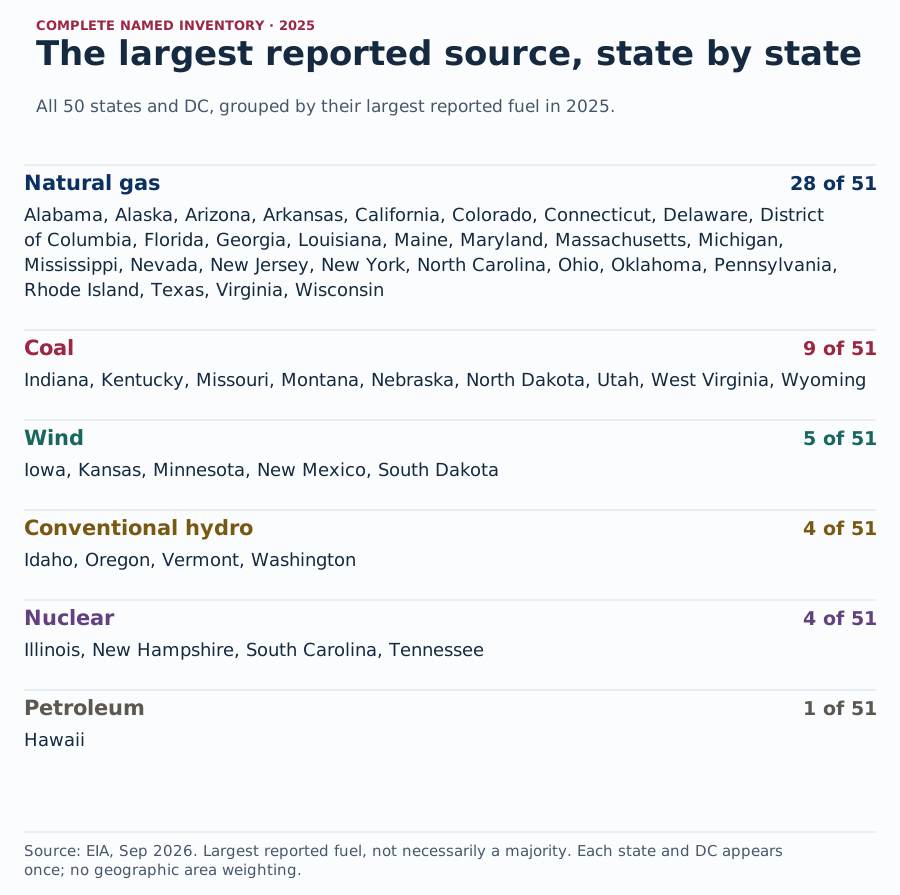
The largest reported source, state by state. All 50 states and DC, grouped by their largest reported fuel in 2025.
Figure 2: The classification identifies the largest reported row, which can be a plurality below 50%. It is a grouped inventory of states and DC, without geographic area weighting or a claim about electricity consumed by residents. Source: EIA state generation workbook, Sep 2026. Chart drawn by American Mineral Registry from the source figures, checked 15 Nov 2026.

Download original chart (SVG)

Figure 2 in text

COMPLETE NAMED INVENTORY · 2025 The largest reported source, state by state All 50 states and DC, grouped by their largest reported fuel in 2025. Natural gas

28 of 51 Alabama, Alaska, Arizona, Arkansas, California, Colorado, Connecticut, Delaware, District of Columbia, Florida, Georgia, Louisiana, Maine, Maryland, Massachusetts, Michigan, Mississippi, Nevada, New Jersey, New York, North Carolina, Ohio, Oklahoma, Pennsylvania, Rhode Island, Texas, Virginia, Wisconsin Coal

9 of 51 Indiana, Kentucky, Missouri, Montana, Nebraska, North Dakota, Utah, West Virginia, Wyoming Wind

5 of 51 Iowa, Kansas, Minnesota, New Mexico, South Dakota Conventional hydro

4 of 51 Idaho, Oregon, Vermont, Washington Nuclear

4 of 51 Illinois, New Hampshire, South Carolina, Tennessee Petroleum

1 of 51 Hawaii Source: EIA, Sep 2026. Largest reported fuel, not necessarily a majority. Each state and DC appears once; no geographic area weighting.

Source and data: EIA state generation workbook

How many state mixes were led by each fuel?

Counting the largest reported fuel gives each state or DC one entry. It answers how widespread the largest source is across geography averages; it does not measure that fuel’s share of national output or the number of customers using it.

The complete table identifies the largest reported fuel, its MWh and its fraction of the same state total. No omitted fuel row is filled with zero to create this classification. The relevant question is explicitly the largest reported row in the source. Gas appearing first in more states does not imply that it supplied a majority in each one. Nor does a count of states weight Texas and DC by their very different generation totals. Use a national volume calculation when the story concerns output rather than geographic prevalence. (EIA, state generation workbook, Sep 2026).

Does the largest source always supply a majority?

No. A fuel can be the largest individual category while other categories together supply more electricity. The distinction is particularly useful when a state is described as relying on one source even though its reported mix is more divided.

A statement such as “gas was the largest source” is supported for Texas, but “most Texas generation came from gas” would be incorrect if most means more than half. The table makes that distinction testable. A majority threshold is also not a reliability score or an estimate of supply security. Those questions involve the timing of generation, availability, network connections and other variables absent from these annual totals. The classification here is a descriptive annual output comparison. (EIA, state generation workbook, Sep 2026).

Which states generated the most electricity overall?

Total output ranks a geography’s scale rather than its fuel preference. The national contribution of a large generator can be important even when the fuel is a smaller fraction of that state’s own mix than elsewhere.

State generation is not a state’s electricity sales or demand. Power can be traded across state lines, and generation facilities can serve markets larger than their physical location. This dataset does not include the necessary flow and sales records to reconcile those exchanges. The totals therefore cannot identify how much electricity a state imported, exported or consumed. A newspaper comparing output can quote the figures; a story about dependence on outside electricity needs a separate, matched state electricity balance. (EIA, state generation workbook, Sep 2026).

Why do gas and coal volume rankings differ from share rankings?

Texas led the reported state volumes for both gas and coal. Rhode Island led the reported gas share, while West Virginia led the reported coal share. The rankings differ because volume measures physical output and share divides that output by the particular state’s generation total.

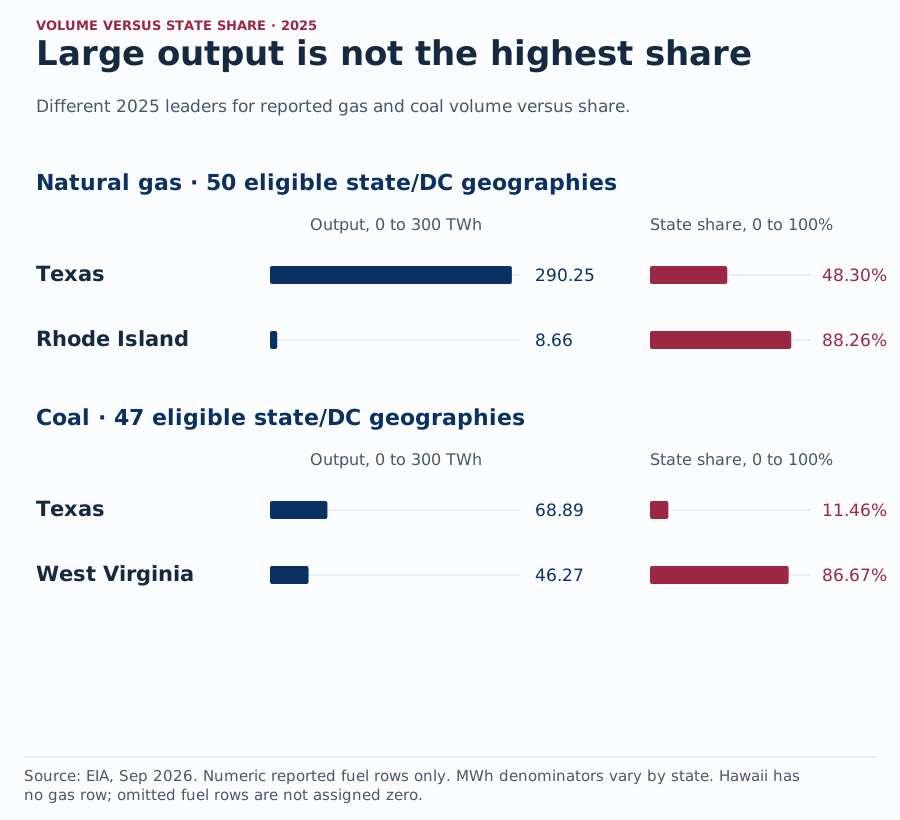
Large output is not the highest share. Different 2025 leaders for reported gas and coal volume versus share.
Figure 3: The fuel-specific comparisons use only geographies with numeric source rows: 50 for gas and 47 for coal. A smaller state can lead on share while contributing much less physical output. Source: EIA state generation workbook, Sep 2026. Chart drawn by American Mineral Registry from the source figures, checked 15 Nov 2026.

Download original chart (SVG)

Figure 3 in text

VOLUME VERSUS STATE SHARE · 2025 Large output is not the highest share Different 2025 leaders for reported gas and coal volume versus share. Natural gas · 50 eligible state/DC geographies Output, 0 to 300 TWh State share, 0 to 100%

Texas 290.25 48.30%

Rhode Island 8.66 88.26% Coal · 47 eligible state/DC geographies Output, 0 to 300 TWh State share, 0 to 100%

Texas 68.89 11.46%

West Virginia 46.27 86.67% Source: EIA, Sep 2026. Numeric reported fuel rows only. MWh denominators vary by state. Hawaii has no gas row; omitted fuel rows are not assigned zero.

Additional phone figure text: Natural gas · 50 eligible geographies · Share · Coal · 47 eligible geographies

Source and data: EIA state generation workbook

Who led gas volume and who led gas share?

For gas, the comparison contains numeric fuel observations for 50 of the 51 state/DC geographies. Hawaii has no gas row in the selected 2025 producer series, so it is not assigned a fabricated zero or included in the fuel ranking.

The source supports “Rhode Island had the highest reported gas share” within this defined comparison. It does not support converting an omitted fuel row into a verified zero. Stating the eligible comparison set is more useful than hiding the distinction in an unexplained footnote. The full ranking carries its reporting geography count beside each result, preserves the national comparator without a state rank and keeps the MWh denominator visible for independent reproduction. (EIA, state generation workbook, Sep 2026).

Who led coal volume and who led coal share?

The coal ranking contains 47 of the 51 state/DC geographies with numeric source rows. The source includes some literal zero rows; those are observations and remain in the comparison. Omitted rows have a different status and are left out.

DC, Hawaii, Oregon and Vermont have no coal row in the selected 2025 producer series. This is an observed source omission, not a conclusion that these places used no coal-generated electricity or had no coal plants under every possible definition. Imports, contractual supply and generation are different questions. The source does explicitly report zero coal generation for Connecticut, which is retained as zero. A complete, honest comparison preserves both kinds of record instead of making an apparently fuller table by changing their meanings. (EIA, state generation workbook, Sep 2026).

How should the ranks and denominators be quoted?

Every fuel rank should name its measure and eligible set. A position in a volume ranking cannot be reused as a position in a share ranking, and a fuel-specific source set cannot be presented as an unqualified ranking of all states.

The ranking uses competition positions, one plus the count of strictly larger values. Literal ties share a rank. Public percentages are rounded for readability, while the download retains six decimal shares and whole source MWh. A high displayed share is not a separate physical amount that can be added to another state’s share. To aggregate generation, add compatible volumes and use a matched total denominator rather than taking an unweighted mean of percentages from states of very different sizes. (EIA, state generation workbook, Sep 2026).

How do nuclear, wind and solar comparisons change the picture?

The volume-versus-share distinction also changes nuclear, wind and solar comparisons. Illinois led reported nuclear volume, while New Hampshire led nuclear share. Texas led reported wind and solar volumes, while Iowa led wind share and Nevada led the reported solar share.

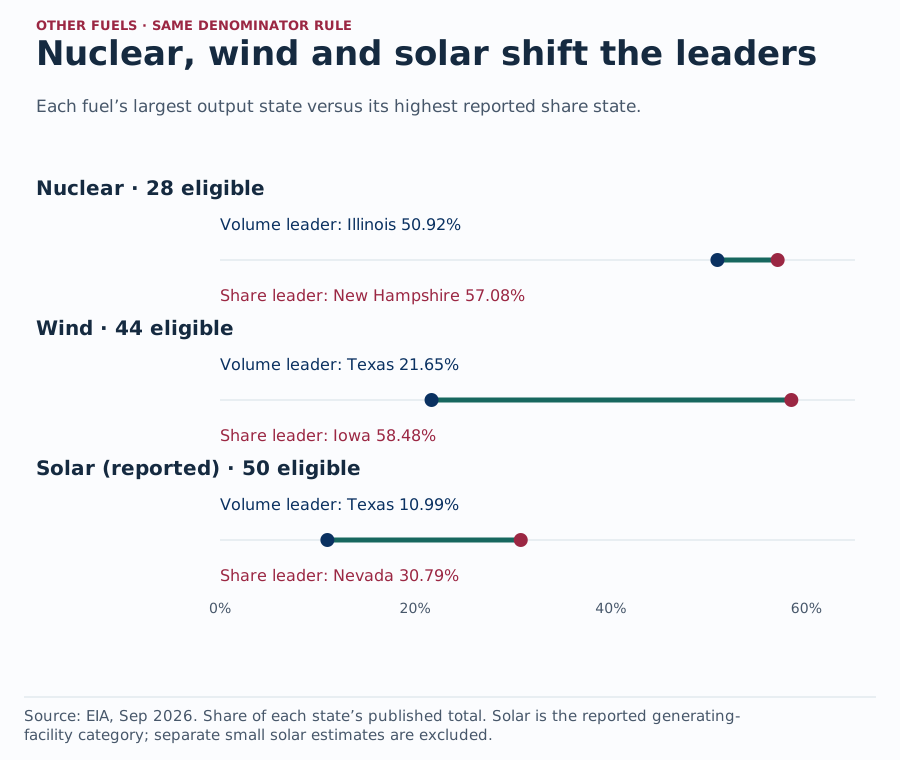
Nuclear, wind and solar shift the leaders. Each fuel’s largest output state versus its highest reported share state.
Figure 4: Connected points share a percentage scale, while the labels identify different selection rules. Solar is the workbook’s generating-facility category, with separate small solar estimates excluded. Source: EIA state generation workbook, Sep 2026. Chart drawn by American Mineral Registry from the source figures, checked 15 Nov 2026.

Download original chart (SVG)

Figure 4 in text

OTHER FUELS · SAME DENOMINATOR RULE Nuclear, wind and solar shift the leaders Each fuel’s largest output state versus its highest reported share state. Nuclear · 28 eligible Volume leader: Illinois 50.92% Share leader: New Hampshire 57.08% Wind · 44 eligible Volume leader: Texas 21.65% Share leader: Iowa 58.48% Solar (reported) · 50 eligible Volume leader: Texas 10.99% Share leader: Nevada 30.79% 0% 20% 40% 60% Source: EIA, Sep 2026. Share of each state’s published total. Solar is the reported generating- facility category; separate small solar estimates are excluded.

Source and data: EIA state generation workbook

How do nuclear volume and share compare?

Nuclear has numeric source rows for 28 of the 51 state/DC geographies in the selected 2025 industry series. Illinois had the largest reported nuclear volume, while New Hampshire had a larger nuclear fraction of its smaller total.

A share does not reveal installed reactor capacity or operating performance per unit of capacity. Capacity factor requires generation, available capacity and time alignment. This workbook alone does not provide all of those matching inputs for a defensible capacity factor calculation. The comparison is therefore kept to observed output and its share. The source’s nuclear category is also kept separate from a custom low-carbon grouping, because that would introduce a new classification and potential emissions claim not required by the underlying question. (EIA, state generation workbook, Sep 2026).

Why can Texas lead wind volume while Iowa leads wind share?

Texas’s large all-source generation total means that a very large wind volume can still represent a smaller fraction than wind does in another state. The eligible comparison contains 44 of the 51 state/DC geographies with numeric reported wind rows.

The complete table shows both quantities because the phrases wind producer and wind dependent can otherwise be used as if they meant the same thing. Even the latter phrase needs care: the annual generation share does not establish the electricity mix delivered to consumers or the source available at a particular hour. Annual totals also do not identify curtailment, peak demand contributions or backup requirements. Those are legitimate reporting questions, but this source does not settle them through a single state share. (EIA, state generation workbook, Sep 2026).

What does the reported solar category show?

The solar ranking has numeric source rows for 50 of the 51 state/DC geographies. It uses the workbook’s Solar Thermal and Photovoltaic category consistently, rather than mixing generating-facility output with separately estimated small systems in selected states.

DC’s contrasting positions are an especially clear warning against interpreting a high share as a large national contribution. Its denominator is small. A rooftop solar story needs the relevant small solar series and a consistent combined denominator, not this facility series alone. EIA’s technical notes explain that small solar generation is estimated using capacity and other survey information. AMR does not treat unadded estimates as measured zero; it specifies the narrower source scope for every solar comparison here. (EIA, state generation workbook, Sep 2026).

How did gas and coal generation change from 2015 to 2025?

National gas share rose from 32.72% in 2015 to 40.93% in 2025. Coal share fell from 33.16% to 16.61%. Those are changes in fractions of a changing total, so the accompanying output volumes and state comparisons are essential to their interpretation.

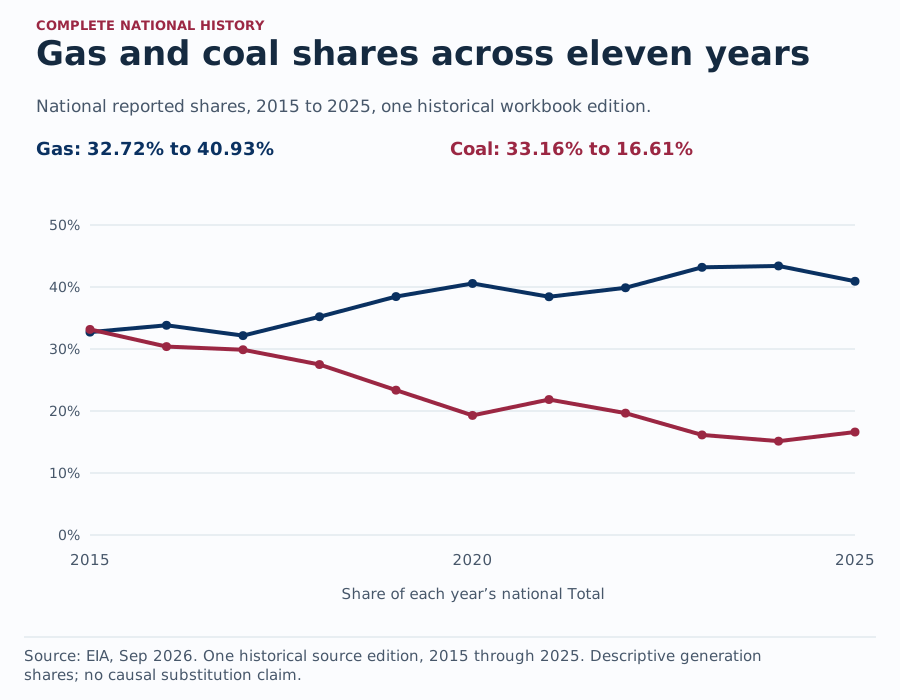
Gas and coal shares across eleven years. National reported shares, 2015 to 2025, one historical workbook edition.
Figure 5: Two lines show descriptive shares, not a claim that an increase in one fuel caused the change in another. Absolute output and state-specific matched changes remain available in the HTML data tables. Source: EIA state generation workbook, Sep 2026. Chart drawn by American Mineral Registry from the source figures, checked 15 Nov 2026.

Download original chart (SVG)

Figure 5 in text

COMPLETE NATIONAL HISTORY Gas and coal shares across eleven years National reported shares, 2015 to 2025, one historical workbook edition. Gas: 32.72% to 40.93% Coal: 33.16% to 16.61% 0% 10% 20% 30% 40% 50% 2015 2020 2025 Share of each year’s national Total Source: EIA, Sep 2026. One historical source edition, 2015 through 2025. Descriptive generation shares; no causal substitution claim.

Source and data: EIA state generation workbook

How much did national output and shares change?

The fixed endpoint comparison uses 2015 and 2025 observations from the same retrieved historical edition. Each endpoint share divides by its own year’s national all-source total, avoiding a constant-denominator assumption. Changes are calculated before rounding; displayed endpoints and changes are rounded independently.

A percentage point change subtracts two percentages. It is not the same as the percentage change in output, and it is not the percentage change in the share itself. The dataset provides the endpoint MWh, shares and share-point changes as separate fields. The national all-source total rose from 4,078.71 TWh in 2015 to 4,425.03 TWh in 2025. That changing denominator is one reason a source’s physical output trend and its share trend can tell different stories. (EIA, state generation workbook, Sep 2026).

Did all state gas shares move in the national direction?

No. The matched gas comparison includes 50 of the 51 state/DC geographies with numeric gas rows at both endpoints. Most had a higher gas share, but ten had a lower share, including Texas despite its higher physical gas generation.

Texas is a useful counterexample to the assumption that more gas generation always means a larger gas share. Its all-source denominator changed enough for the share to fall. This observation does not identify which technologies displaced which, nor does the national comparison establish a causal substitution between gas and coal. Power plant additions, retirements, dispatch, demand and other factors require separate evidence. The matched panel supports a transparent description of observed output and fractions, with no explanatory variable invented to complete the story. (EIA, state generation workbook, Sep 2026).

What does the matched coal comparison establish?

The coal endpoint comparison includes 47 of the 51 state/DC geographies with numeric rows in both years. Its eligible set is defined by actual source records, while literal zero observations remain in the data rather than being dropped as if they were missing.

This describes the matched reported series, not a census of coal plant closures or a count of workers affected. The workbook has no employee, ownership, royalty or retirement fields, so those outcomes cannot be derived from a decline in generation share. The year-by-year national table is also retained instead of presenting endpoints as if the path between them were continuous and uniform. Using one historical vintage makes the arithmetic reproducible, while later producer revisions would require a new pinned edition and explicit comparison. (EIA, state generation workbook, Sep 2026).

What do the source boundaries and accounting details change?

The total industry category, reporting threshold, numeric statuses and original national total determine what these statistics mean. Keeping them explicit prevents a complete-looking table from silently inventing zeros, duplicating producer categories or turning generation into a claim about consumption, capacity or affordability.

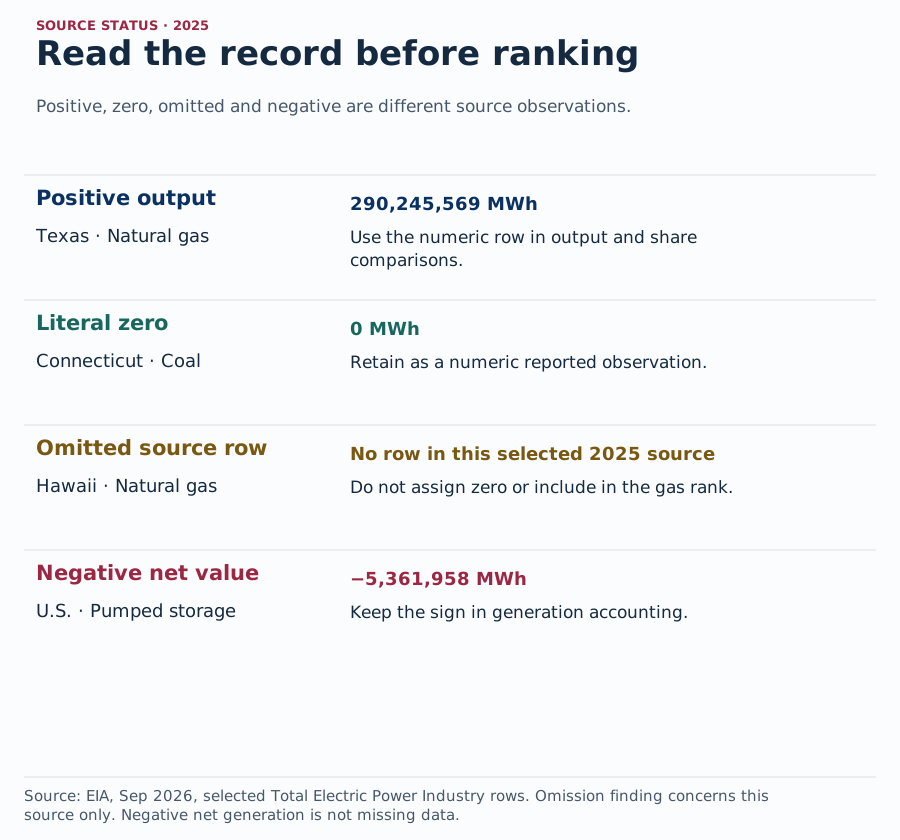
Read the record before ranking. Positive, zero, omitted and negative are different source observations.
Figure 6: The examples preserve source values and their different statuses. The published Total is always the share denominator; small fuel-sum residuals remain explicit instead of being allocated to a balancing category. Source: EIA state generation workbook, Sep 2026. Chart drawn by American Mineral Registry from the source figures, checked 15 Nov 2026.

Download original chart (SVG)

Figure 6 in text

SOURCE STATUS · 2025 Read the record before ranking Positive, zero, omitted and negative are different source observations. Positive output Texas · Natural gas

290,245,569 MWh Use the numeric row in output and share comparisons. Literal zero Connecticut · Coal

0 MWh Retain as a numeric reported observation. Omitted source row Hawaii · Natural gas

No row in this selected 2025 source Do not assign zero or include in the gas rank. Negative net value U.S. · Pumped storage

−5,361,958 MWh Keep the sign in generation accounting. Source: EIA, Sep 2026, selected Total Electric Power Industry rows. Omission finding concerns this source only. Negative net generation is not missing data.

Source and data: EIA state generation workbook

Which producers and solar systems belong in this series?

The analysis selects only Total Electric Power Industry rows. The workbook separately lists utilities, independent generators and several combined heat and power groups, so adding every producer category would duplicate the total rather than extend its coverage.

  • The selected national industry total is 4,425,028,526 MWh in 2025. (EIA, state generation workbook, Sep 2026).
  • The source separately reports 137,728,117 MWh for Combined Heat and Power, Industrial Power and 15,339,977 MWh for Combined Heat and Power, Commercial Power. (EIA, state generation workbook, Sep 2026).

The EIA923 reporting instructions specify grid-connected plants with at least one MW of total generator nameplate capacity. (EIA923 reporting instructions).

Total Electric Power Industry should not be casually renamed the electric power sector, because industrial and commercial combined heat and power belong in the selected broader total. The workbook’s separate producer rows make that inclusion inspectable. The official survey instructions also distinguish generation from fuel consumption and describe eligible facilities. For context on account spending rather than output, use the separate residential electricity bill reference, which uses EIA861 revenue and customer records rather than these generating-plant data. (EIA, state generation workbook, Sep 2026).

How are zero, omitted and negative values treated?

Source status is preserved before any ranking or arithmetic. A number can be positive, explicitly zero or negative; a row that the workbook does not supply is a different kind of evidence and is not materialized as a numeric observation.

The source-row ledger defines the scope of the omission finding: one selected producer category, one annual edition, one geography and one fuel label. It does not establish a universal absence outside that source. Negative values are included in fuel-sum checks rather than clipped, and every residual is kept in MWh. Percentages are calculated against the published total even when rounded fuel values sum slightly differently. There is no invented Other adjustment to force an exact 100% display. (EIA, state generation workbook, Sep 2026).

How can writers reuse the findings without changing the question?

A reusable sentence names the fuel, geography, year, physical output or share and the comparison population. Specific finding cards below connect those facts to exact fragments, matching CSVs and EIA’s original workbook.

One MWh is 1,000 kWh; one TWh is one million MWh, while MW describes capacity rather than annual energy. (EIA, generation and capacity definitions).

Do not recast a generation share as the fuel mix in a household’s bill, a cause of local prices or a measure of reliability. The source has no state import balance, hourly operation, emissions or causal price model. For household hardship, the separate energy insecurity reference uses a different survey population and denominator. Exact source links, readable HTML tables and complete downloads allow another writer to verify the narrower statement that this dataset can actually support. (EIA, state generation workbook, Sep 2026).

Methodology and Sources

AMR selected Total Electric Power Industry rows for 2015 through 2025 from EIA’s September 2026 final annual workbook. All 52 geographies have a positive published Total in each year. Every share divides the reported fuel MWh by the same geography-year Total. Fuel rankings use only numeric reported rows, including literal zero observations; omitted rows are never assigned zero. Competition ranks compare volume and share separately. Endpoint changes require numeric fuel rows in both years. Negative source values remain signed, including pumped storage. Reconciliation retains reported fuel sums, published totals and their residuals. Public TWh and percentages are rounded, while downloads preserve whole MWh and six decimal derived shares. One current vintage supports offline reproduction. EIA reporting instructions and technical notes define the generating-facility scope and separate small solar estimates. (EIA, state generation workbook, Sep 2026).

Glossary

  • Net generation: Gross electricity output minus the electricity used to operate the generating facility, allowing a signed negative value in some records.
  • MWh: A megawatthour, a unit of electrical energy equal to 1,000 kWh.
  • TWh: A terawatthour, equal to one million MWh.
  • MW: A megawatt, a unit of power or capacity, not an annual electricity quantity.
  • Published Total: The all-source generation denominator supplied by EIA for the selected geography, year and producer category.
  • Reported fuel share: A numeric source fuel row divided by the matched published Total, multiplied by 100.
  • Largest reported fuel: The source fuel with the greatest reported MWh in a geography-year, which need not exceed half of the total.
  • Pumped storage: Storage using electricity to move water before later generation; annual net output can be negative.
  • Combined heat and power: A facility producing electricity and useful thermal output from a common energy source, with separate producer categories in the workbook.
  • Eligible comparison set: The explicitly counted geographies with numeric source observations needed for the particular ranking or matched endpoint calculation.

Sources

Cite a specific finding

Copy a finding with its exact period, denominator and primary source. The permanent link lands on the supporting evidence.

National gas generation share

Natural gas supplied 40.93% of U.S. net electricity generation in EIA’s final 2025 Total Electric Power Industry series, calculated from 1,811,003,580 MWh of gas output and the published 4,425,028,526 MWh all-source total.

American Mineral Registry. Natural gas supplied 40.93% of U.S. net electricity generation in EIA’s final 2025 Total Electric Power Industry series, calculated from 1,811,003,580 MWh of gas output and the published 4,425,028,526 MWh all-source total. Final 2025 EIA Total Electric Power Industry net generation, or the explicitly stated matched comparison years. State output is not state consumption, installed capacity, emissions or an individual customer’s supply mix. Omitted fuel rows are not measured zeros. https://americanmineralregistry.com/research/us-electricity-generation-fuel-mix-by-state#mix-national-gas-share Primary sources: https://www.eia.gov/electricity/data/state/annual_generation_state.xlsx; https://www.eia.gov/electricity/data/eia923/
Copy HTML attribution<a href="https://americanmineralregistry.com/research/us-electricity-generation-fuel-mix-by-state#mix-national-gas-share">American Mineral Registry</a>. Natural gas supplied 40.93% of U.S. net electricity generation in EIA’s final 2025 Total Electric Power Industry series, calculated from 1,811,003,580 MWh of gas output and the published 4,425,028,526 MWh all-source total. Final 2025 EIA Total Electric Power Industry net generation, or the explicitly stated matched comparison years. State output is not state consumption, installed capacity, emissions or an individual customer’s supply mix. Omitted fuel rows are not measured zeros. Primary sources: <a href="https://www.eia.gov/electricity/data/state/annual_generation_state.xlsx">EIA final annual state generation workbook</a>; <a href="https://www.eia.gov/electricity/data/eia923/">EIA annual data scope and release</a>.

Permanent finding link · Matching data (CSV) · Original producer source

EIA annual data scope and release

Largest reported source in every state and DC

In 2025, natural gas was the largest reported generation fuel in 28 of the 51 state and DC mixes; coal led in nine, wind in five, conventional hydro in four, nuclear in four and petroleum in one. Largest reported source does not necessarily mean a majority.

American Mineral Registry. In 2025, natural gas was the largest reported generation fuel in 28 of the 51 state and DC mixes; coal led in nine, wind in five, conventional hydro in four, nuclear in four and petroleum in one. Largest reported source does not necessarily mean a majority. Final 2025 EIA Total Electric Power Industry net generation, or the explicitly stated matched comparison years. State output is not state consumption, installed capacity, emissions or an individual customer’s supply mix. Omitted fuel rows are not measured zeros. https://americanmineralregistry.com/research/us-electricity-generation-fuel-mix-by-state#mix-complete-state-leader-inventory Primary sources: https://www.eia.gov/electricity/data/state/annual_generation_state.xlsx; https://www.eia.gov/electricity/data/eia923/
Copy HTML attribution<a href="https://americanmineralregistry.com/research/us-electricity-generation-fuel-mix-by-state#mix-complete-state-leader-inventory">American Mineral Registry</a>. In 2025, natural gas was the largest reported generation fuel in 28 of the 51 state and DC mixes; coal led in nine, wind in five, conventional hydro in four, nuclear in four and petroleum in one. Largest reported source does not necessarily mean a majority. Final 2025 EIA Total Electric Power Industry net generation, or the explicitly stated matched comparison years. State output is not state consumption, installed capacity, emissions or an individual customer’s supply mix. Omitted fuel rows are not measured zeros. Primary sources: <a href="https://www.eia.gov/electricity/data/state/annual_generation_state.xlsx">EIA final annual state generation workbook</a>; <a href="https://www.eia.gov/electricity/data/eia923/">EIA annual data scope and release</a>.

Permanent finding link · Matching data (CSV) · Original producer source

EIA annual data scope and release

Largest source versus majority

In 2025, 25 of the 51 state and DC generation mixes had a single reported fuel supplying more than half of the published all-source total. The largest reported fuel’s share did not exceed 50% in the other 26.

American Mineral Registry. In 2025, 25 of the 51 state and DC generation mixes had a single reported fuel supplying more than half of the published all-source total. The largest reported fuel’s share did not exceed 50% in the other 26. Final 2025 EIA Total Electric Power Industry net generation, or the explicitly stated matched comparison years. State output is not state consumption, installed capacity, emissions or an individual customer’s supply mix. Omitted fuel rows are not measured zeros. https://americanmineralregistry.com/research/us-electricity-generation-fuel-mix-by-state#mix-largest-is-not-majority Primary sources: https://www.eia.gov/electricity/data/state/annual_generation_state.xlsx; https://www.eia.gov/electricity/data/eia923/
Copy HTML attribution<a href="https://americanmineralregistry.com/research/us-electricity-generation-fuel-mix-by-state#mix-largest-is-not-majority">American Mineral Registry</a>. In 2025, 25 of the 51 state and DC generation mixes had a single reported fuel supplying more than half of the published all-source total. The largest reported fuel’s share did not exceed 50% in the other 26. Final 2025 EIA Total Electric Power Industry net generation, or the explicitly stated matched comparison years. State output is not state consumption, installed capacity, emissions or an individual customer’s supply mix. Omitted fuel rows are not measured zeros. Primary sources: <a href="https://www.eia.gov/electricity/data/state/annual_generation_state.xlsx">EIA final annual state generation workbook</a>; <a href="https://www.eia.gov/electricity/data/eia923/">EIA annual data scope and release</a>.

Permanent finding link · Matching data (CSV) · Original producer source

EIA annual data scope and release

Gas output and gas share have different leaders

Texas generated 290.25 TWh from natural gas in 2025, first by reported state volume but fifteenth by gas share at 48.30%. Rhode Island led reported gas share at 88.26%, while its 8.66 TWh ranked thirty sixth by volume. The comparison contains 50 of the 51 state/DC geographies with numeric gas rows; Hawaii has no gas row in the selected workbook.

American Mineral Registry. Texas generated 290.25 TWh from natural gas in 2025, first by reported state volume but fifteenth by gas share at 48.30%. Rhode Island led reported gas share at 88.26%, while its 8.66 TWh ranked thirty sixth by volume. The comparison contains 50 of the 51 state/DC geographies with numeric gas rows; Hawaii has no gas row in the selected workbook. Final 2025 EIA Total Electric Power Industry net generation, or the explicitly stated matched comparison years. State output is not state consumption, installed capacity, emissions or an individual customer’s supply mix. Omitted fuel rows are not measured zeros. https://americanmineralregistry.com/research/us-electricity-generation-fuel-mix-by-state#mix-gas-volume-versus-share Primary sources: https://www.eia.gov/electricity/data/state/annual_generation_state.xlsx; https://www.eia.gov/electricity/data/eia923/
Copy HTML attribution<a href="https://americanmineralregistry.com/research/us-electricity-generation-fuel-mix-by-state#mix-gas-volume-versus-share">American Mineral Registry</a>. Texas generated 290.25 TWh from natural gas in 2025, first by reported state volume but fifteenth by gas share at 48.30%. Rhode Island led reported gas share at 88.26%, while its 8.66 TWh ranked thirty sixth by volume. The comparison contains 50 of the 51 state/DC geographies with numeric gas rows; Hawaii has no gas row in the selected workbook. Final 2025 EIA Total Electric Power Industry net generation, or the explicitly stated matched comparison years. State output is not state consumption, installed capacity, emissions or an individual customer’s supply mix. Omitted fuel rows are not measured zeros. Primary sources: <a href="https://www.eia.gov/electricity/data/state/annual_generation_state.xlsx">EIA final annual state generation workbook</a>; <a href="https://www.eia.gov/electricity/data/eia923/">EIA annual data scope and release</a>.

Permanent finding link · Matching data (CSV) · Original producer source

EIA annual data scope and release

Coal output and coal share have different leaders

Texas generated 68.89 TWh from coal in 2025, first by reported state volume but twenty fifth by coal share at 11.46%. West Virginia led reported coal share at 86.67%, while its 46.27 TWh ranked fourth by volume. The comparison contains 47 of the 51 state/DC geographies with numeric coal rows.

American Mineral Registry. Texas generated 68.89 TWh from coal in 2025, first by reported state volume but twenty fifth by coal share at 11.46%. West Virginia led reported coal share at 86.67%, while its 46.27 TWh ranked fourth by volume. The comparison contains 47 of the 51 state/DC geographies with numeric coal rows. Final 2025 EIA Total Electric Power Industry net generation, or the explicitly stated matched comparison years. State output is not state consumption, installed capacity, emissions or an individual customer’s supply mix. Omitted fuel rows are not measured zeros. https://americanmineralregistry.com/research/us-electricity-generation-fuel-mix-by-state#mix-coal-volume-versus-share Primary sources: https://www.eia.gov/electricity/data/state/annual_generation_state.xlsx; https://www.eia.gov/electricity/data/eia923/
Copy HTML attribution<a href="https://americanmineralregistry.com/research/us-electricity-generation-fuel-mix-by-state#mix-coal-volume-versus-share">American Mineral Registry</a>. Texas generated 68.89 TWh from coal in 2025, first by reported state volume but twenty fifth by coal share at 11.46%. West Virginia led reported coal share at 86.67%, while its 46.27 TWh ranked fourth by volume. The comparison contains 47 of the 51 state/DC geographies with numeric coal rows. Final 2025 EIA Total Electric Power Industry net generation, or the explicitly stated matched comparison years. State output is not state consumption, installed capacity, emissions or an individual customer’s supply mix. Omitted fuel rows are not measured zeros. Primary sources: <a href="https://www.eia.gov/electricity/data/state/annual_generation_state.xlsx">EIA final annual state generation workbook</a>; <a href="https://www.eia.gov/electricity/data/eia923/">EIA annual data scope and release</a>.

Permanent finding link · Matching data (CSV) · Original producer source

EIA annual data scope and release

Wind output and wind share have different leaders

Texas generated 130.14 TWh from wind in 2025, first by reported state volume, but ranked twelfth by wind share at 21.65%. Iowa’s 43.57 TWh ranked second by volume and first by share at 58.48%. The comparison contains 44 of the 51 state/DC geographies with numeric wind rows.

American Mineral Registry. Texas generated 130.14 TWh from wind in 2025, first by reported state volume, but ranked twelfth by wind share at 21.65%. Iowa’s 43.57 TWh ranked second by volume and first by share at 58.48%. The comparison contains 44 of the 51 state/DC geographies with numeric wind rows. Final 2025 EIA Total Electric Power Industry net generation, or the explicitly stated matched comparison years. State output is not state consumption, installed capacity, emissions or an individual customer’s supply mix. Omitted fuel rows are not measured zeros. https://americanmineralregistry.com/research/us-electricity-generation-fuel-mix-by-state#mix-wind-volume-versus-share Primary sources: https://www.eia.gov/electricity/data/state/annual_generation_state.xlsx; https://www.eia.gov/electricity/data/eia923/
Copy HTML attribution<a href="https://americanmineralregistry.com/research/us-electricity-generation-fuel-mix-by-state#mix-wind-volume-versus-share">American Mineral Registry</a>. Texas generated 130.14 TWh from wind in 2025, first by reported state volume, but ranked twelfth by wind share at 21.65%. Iowa’s 43.57 TWh ranked second by volume and first by share at 58.48%. The comparison contains 44 of the 51 state/DC geographies with numeric wind rows. Final 2025 EIA Total Electric Power Industry net generation, or the explicitly stated matched comparison years. State output is not state consumption, installed capacity, emissions or an individual customer’s supply mix. Omitted fuel rows are not measured zeros. Primary sources: <a href="https://www.eia.gov/electricity/data/state/annual_generation_state.xlsx">EIA final annual state generation workbook</a>; <a href="https://www.eia.gov/electricity/data/eia923/">EIA annual data scope and release</a>.

Permanent finding link · Matching data (CSV) · Original producer source

EIA annual data scope and release

Reported solar output and share differ

Texas led reported 2025 Solar Thermal and Photovoltaic state volume at 66.06 TWh, while Nevada led the reported share at 30.79%, with 13.91 TWh. The eligible set contains 50 numeric state and DC source rows. Separate estimates for small solar systems are not added to this generating-facility series.

American Mineral Registry. Texas led reported 2025 Solar Thermal and Photovoltaic state volume at 66.06 TWh, while Nevada led the reported share at 30.79%, with 13.91 TWh. The eligible set contains 50 numeric state and DC source rows. Separate estimates for small solar systems are not added to this generating-facility series. Final 2025 EIA Total Electric Power Industry net generation, or the explicitly stated matched comparison years. State output is not state consumption, installed capacity, emissions or an individual customer’s supply mix. Omitted fuel rows are not measured zeros. https://americanmineralregistry.com/research/us-electricity-generation-fuel-mix-by-state#mix-solar-volume-versus-share Primary sources: https://www.eia.gov/electricity/data/state/annual_generation_state.xlsx; https://www.eia.gov/electricity/data/eia923/; https://www.eia.gov/survey/form/eia_923/instructions.pdf; https://www.eia.gov/electricity/monthly/pdf/technotes.pdf
Copy HTML attribution<a href="https://americanmineralregistry.com/research/us-electricity-generation-fuel-mix-by-state#mix-solar-volume-versus-share">American Mineral Registry</a>. Texas led reported 2025 Solar Thermal and Photovoltaic state volume at 66.06 TWh, while Nevada led the reported share at 30.79%, with 13.91 TWh. The eligible set contains 50 numeric state and DC source rows. Separate estimates for small solar systems are not added to this generating-facility series. Final 2025 EIA Total Electric Power Industry net generation, or the explicitly stated matched comparison years. State output is not state consumption, installed capacity, emissions or an individual customer’s supply mix. Omitted fuel rows are not measured zeros. Primary sources: <a href="https://www.eia.gov/electricity/data/state/annual_generation_state.xlsx">EIA final annual state generation workbook</a>; <a href="https://www.eia.gov/electricity/data/eia923/">EIA annual data scope and release</a>; <a href="https://www.eia.gov/survey/form/eia_923/instructions.pdf">EIA survey reporting scope</a>; <a href="https://www.eia.gov/electricity/monthly/pdf/technotes.pdf">EIA small solar estimation methods</a>.

Permanent finding link · Matching data (CSV) · Original producer source

EIA annual data scope and release · EIA survey reporting scope · EIA small solar estimation methods

National gas and coal share changes

Between 2015 and 2025, U.S. gas generation share increased from 32.72% to 40.93%, a gain of 8.20 percentage points, while coal fell from 33.16% to 16.61%, a decline of 16.55 percentage points. Shares use each year’s published national total from one current EIA historical edition. These trends do not establish causal substitution. Changes are calculated before rounding; displayed endpoints and changes are rounded independently.

American Mineral Registry. Between 2015 and 2025, U.S. gas generation share increased from 32.72% to 40.93%, a gain of 8.20 percentage points, while coal fell from 33.16% to 16.61%, a decline of 16.55 percentage points. Shares use each year’s published national total from one current EIA historical edition. These trends do not establish causal substitution. Changes are calculated before rounding; displayed endpoints and changes are rounded independently. Final 2025 EIA Total Electric Power Industry net generation, or the explicitly stated matched comparison years. State output is not state consumption, installed capacity, emissions or an individual customer’s supply mix. Omitted fuel rows are not measured zeros. https://americanmineralregistry.com/research/us-electricity-generation-fuel-mix-by-state#mix-national-gas-coal-share-change Primary sources: https://www.eia.gov/electricity/data/state/annual_generation_state.xlsx; https://www.eia.gov/electricity/data/eia923/
Copy HTML attribution<a href="https://americanmineralregistry.com/research/us-electricity-generation-fuel-mix-by-state#mix-national-gas-coal-share-change">American Mineral Registry</a>. Between 2015 and 2025, U.S. gas generation share increased from 32.72% to 40.93%, a gain of 8.20 percentage points, while coal fell from 33.16% to 16.61%, a decline of 16.55 percentage points. Shares use each year’s published national total from one current EIA historical edition. These trends do not establish causal substitution. Changes are calculated before rounding; displayed endpoints and changes are rounded independently. Final 2025 EIA Total Electric Power Industry net generation, or the explicitly stated matched comparison years. State output is not state consumption, installed capacity, emissions or an individual customer’s supply mix. Omitted fuel rows are not measured zeros. Primary sources: <a href="https://www.eia.gov/electricity/data/state/annual_generation_state.xlsx">EIA final annual state generation workbook</a>; <a href="https://www.eia.gov/electricity/data/eia923/">EIA annual data scope and release</a>.

Permanent finding link · Matching data (CSV) · Original producer source

EIA annual data scope and release

More gas output can accompany a lower share

Texas gas generation increased from 237.73 TWh in 2015 to 290.25 TWh in 2025, while its gas share fell from 52.85% to 48.30%, a decline of 4.55 percentage points. The share denominator is each year’s published Texas all-source generation total.

American Mineral Registry. Texas gas generation increased from 237.73 TWh in 2015 to 290.25 TWh in 2025, while its gas share fell from 52.85% to 48.30%, a decline of 4.55 percentage points. The share denominator is each year’s published Texas all-source generation total. Final 2025 EIA Total Electric Power Industry net generation, or the explicitly stated matched comparison years. State output is not state consumption, installed capacity, emissions or an individual customer’s supply mix. Omitted fuel rows are not measured zeros. https://americanmineralregistry.com/research/us-electricity-generation-fuel-mix-by-state#mix-texas-more-gas-lower-share Primary sources: https://www.eia.gov/electricity/data/state/annual_generation_state.xlsx; https://www.eia.gov/electricity/data/eia923/
Copy HTML attribution<a href="https://americanmineralregistry.com/research/us-electricity-generation-fuel-mix-by-state#mix-texas-more-gas-lower-share">American Mineral Registry</a>. Texas gas generation increased from 237.73 TWh in 2015 to 290.25 TWh in 2025, while its gas share fell from 52.85% to 48.30%, a decline of 4.55 percentage points. The share denominator is each year’s published Texas all-source generation total. Final 2025 EIA Total Electric Power Industry net generation, or the explicitly stated matched comparison years. State output is not state consumption, installed capacity, emissions or an individual customer’s supply mix. Omitted fuel rows are not measured zeros. Primary sources: <a href="https://www.eia.gov/electricity/data/state/annual_generation_state.xlsx">EIA final annual state generation workbook</a>; <a href="https://www.eia.gov/electricity/data/eia923/">EIA annual data scope and release</a>.

Permanent finding link · Matching data (CSV) · Original producer source

EIA annual data scope and release

Published totals and source rounding

Across all 572 geography-year reconciliations in the selected 2015 through 2025 industry series, the largest absolute difference between summed reported fuel rows and the published all-source total was 2 MWh. AMR retains signed negative source values, uses the published total as the share denominator and preserves every residual.

American Mineral Registry. Across all 572 geography-year reconciliations in the selected 2015 through 2025 industry series, the largest absolute difference between summed reported fuel rows and the published all-source total was 2 MWh. AMR retains signed negative source values, uses the published total as the share denominator and preserves every residual. Final 2025 EIA Total Electric Power Industry net generation, or the explicitly stated matched comparison years. State output is not state consumption, installed capacity, emissions or an individual customer’s supply mix. Omitted fuel rows are not measured zeros. https://americanmineralregistry.com/research/us-electricity-generation-fuel-mix-by-state#mix-published-total-residuals Primary sources: https://www.eia.gov/electricity/data/state/annual_generation_state.xlsx; https://www.eia.gov/electricity/data/eia923/
Copy HTML attribution<a href="https://americanmineralregistry.com/research/us-electricity-generation-fuel-mix-by-state#mix-published-total-residuals">American Mineral Registry</a>. Across all 572 geography-year reconciliations in the selected 2015 through 2025 industry series, the largest absolute difference between summed reported fuel rows and the published all-source total was 2 MWh. AMR retains signed negative source values, uses the published total as the share denominator and preserves every residual. Final 2025 EIA Total Electric Power Industry net generation, or the explicitly stated matched comparison years. State output is not state consumption, installed capacity, emissions or an individual customer’s supply mix. Omitted fuel rows are not measured zeros. Primary sources: <a href="https://www.eia.gov/electricity/data/state/annual_generation_state.xlsx">EIA final annual state generation workbook</a>; <a href="https://www.eia.gov/electricity/data/eia923/">EIA annual data scope and release</a>.

Permanent finding link · Matching data (CSV) · Original producer source

EIA annual data scope and release

Complete working tables

Open a working table to inspect every row or download its matching CSV. Each table states its period, units, scope and original sources. Display values follow the stated dataset precision, with long fractions shown to four decimal places. The dictionary explains every field, denominator and rounding rule. No account is required.

Every reported fuel sum against its published Total, all 572 rows

572 geography-year checks preserve signed fuel-sum minus producer Total residuals. Published totals are never replaced or adjusted, and no balancing fuel is invented.

Period: 2015 through 2025, one September 2026 final historical workbook edition. Units: Whole signed MWh; reported numeric component row count.

Original sources: EIA state historical generation workbook, source row and columns A:E

Every reported fuel sum against its published Total; 2015 through 2025, one September 2026 final historical workbook edition; Whole signed MWh; reported numeric component row count
yearstatestate nameall source total mwhsum reported fuel rows mwhsum minus total mwhreported component rowsnote
2015AKAlaska6,284,9376,284,93708Published total retained; signed pumped storage included; no absent fuel imputed
2015ALAlabama152,477,427152,477,426-19Published total retained; signed pumped storage included; no absent fuel imputed
2015ARArkansas55,559,42855,559,428010Published total retained; signed pumped storage included; no absent fuel imputed
2015AZArizona113,142,048113,142,047-110Published total retained; signed pumped storage included; no absent fuel imputed
2015CACalifornia196,703,858196,703,858013Published total retained; signed pumped storage included; no absent fuel imputed
2015COColorado52,393,07752,393,078110Published total retained; signed pumped storage included; no absent fuel imputed
2015CTConnecticut37,470,62237,470,622010Published total retained; signed pumped storage included; no absent fuel imputed
2015DCDistrict of Columbia53,75053,75003Published total retained; signed pumped storage included; no absent fuel imputed
2015DEDelaware7,810,0067,810,00607Published total retained; signed pumped storage included; no absent fuel imputed
2015FLFlorida237,412,633237,412,633010Published total retained; signed pumped storage included; no absent fuel imputed
2015GAGeorgia128,817,898128,817,897-110Published total retained; signed pumped storage included; no absent fuel imputed
2015HIHawaii10,119,50010,119,50009Published total retained; signed pumped storage included; no absent fuel imputed
2015IAIowa56,658,91856,658,91919Published total retained; signed pumped storage included; no absent fuel imputed
2015IDIdaho15,667,09515,667,09509Published total retained; signed pumped storage included; no absent fuel imputed
2015ILIllinois193,952,040193,952,040011Published total retained; signed pumped storage included; no absent fuel imputed
2015INIndiana104,019,275104,019,276110Published total retained; signed pumped storage included; no absent fuel imputed
2015KSKansas45,527,12445,527,123-19Published total retained; signed pumped storage included; no absent fuel imputed
2015KYKentucky83,543,67183,543,67217Published total retained; signed pumped storage included; no absent fuel imputed
2015LALouisiana107,812,354107,812,353-19Published total retained; signed pumped storage included; no absent fuel imputed
2015MAMassachusetts32,085,96932,085,969011Published total retained; signed pumped storage included; no absent fuel imputed
2015MDMaryland36,365,54436,365,544010Published total retained; signed pumped storage included; no absent fuel imputed
2015MEMaine11,741,26511,741,26508Published total retained; signed pumped storage included; no absent fuel imputed
2015MIMichigan113,008,050113,008,050012Published total retained; signed pumped storage included; no absent fuel imputed
2015MNMinnesota56,979,76856,979,767-110Published total retained; signed pumped storage included; no absent fuel imputed
2015MOMissouri83,640,06783,640,067011Published total retained; signed pumped storage included; no absent fuel imputed
2015MSMississippi64,757,86464,757,863-17Published total retained; signed pumped storage included; no absent fuel imputed
2015MTMontana29,302,40129,302,40108Published total retained; signed pumped storage included; no absent fuel imputed
2015NCNorth Carolina128,388,445128,388,444-110Published total retained; signed pumped storage included; no absent fuel imputed
2015NDNorth Dakota37,156,61237,156,61318Published total retained; signed pumped storage included; no absent fuel imputed
2015NENebraska39,883,39139,883,39109Published total retained; signed pumped storage included; no absent fuel imputed
2015NHNew Hampshire20,015,89320,015,89419Published total retained; signed pumped storage included; no absent fuel imputed
2015NJNew Jersey74,608,86074,608,860011Published total retained; signed pumped storage included; no absent fuel imputed
2015NMNew Mexico32,701,39832,701,39809Published total retained; signed pumped storage included; no absent fuel imputed
2015NVNevada39,046,78439,046,785110Published total retained; signed pumped storage included; no absent fuel imputed
2015NYNew York138,581,686138,581,686012Published total retained; signed pumped storage included; no absent fuel imputed
2015OHOhio123,079,294123,079,294011Published total retained; signed pumped storage included; no absent fuel imputed
2015OKOklahoma76,135,59676,135,597110Published total retained; signed pumped storage included; no absent fuel imputed
2015OROregon57,866,53557,866,533-210Published total retained; signed pumped storage included; no absent fuel imputed
2015PAPennsylvania214,545,267214,545,268112Published total retained; signed pumped storage included; no absent fuel imputed
2015RIRhode Island6,939,0196,939,02017Published total retained; signed pumped storage included; no absent fuel imputed
2015SCSouth Carolina96,532,21396,532,212-110Published total retained; signed pumped storage included; no absent fuel imputed
2015SDSouth Dakota9,633,0339,633,03307Published total retained; signed pumped storage included; no absent fuel imputed
2015TNTennessee75,214,63675,214,634-212Published total retained; signed pumped storage included; no absent fuel imputed
2015TXTexas449,826,336449,826,336011Published total retained; signed pumped storage included; no absent fuel imputed
2015US-TotalUnited States4,078,713,7724,078,713,774213Published total retained; signed pumped storage included; no absent fuel imputed
2015UTUtah41,949,12041,949,119-110Published total retained; signed pumped storage included; no absent fuel imputed
2015VAVirginia84,411,59284,411,59209Published total retained; signed pumped storage included; no absent fuel imputed
2015VTVermont1,982,0471,982,04707Published total retained; signed pumped storage included; no absent fuel imputed
2015WAWashington109,287,458109,287,458012Published total retained; signed pumped storage included; no absent fuel imputed
2015WIWisconsin66,360,18366,360,183010Published total retained; signed pumped storage included; no absent fuel imputed
2015WVWest Virginia72,295,26972,295,26908Published total retained; signed pumped storage included; no absent fuel imputed
2015WYWyoming48,966,51948,966,518-17Published total retained; signed pumped storage included; no absent fuel imputed
2016AKAlaska6,335,0346,335,03408Published total retained; signed pumped storage included; no absent fuel imputed
2016ALAlabama142,385,098142,385,098010Published total retained; signed pumped storage included; no absent fuel imputed
2016ARArkansas60,445,05960,445,059010Published total retained; signed pumped storage included; no absent fuel imputed
2016AZArizona108,763,449108,763,450110Published total retained; signed pumped storage included; no absent fuel imputed
2016CACalifornia196,963,215196,963,215013Published total retained; signed pumped storage included; no absent fuel imputed
2016COColorado54,418,48054,418,480010Published total retained; signed pumped storage included; no absent fuel imputed
2016CTConnecticut36,496,56036,496,560011Published total retained; signed pumped storage included; no absent fuel imputed
2016DCDistrict of Columbia76,47476,47403Published total retained; signed pumped storage included; no absent fuel imputed
2016DEDelaware8,731,2618,731,26107Published total retained; signed pumped storage included; no absent fuel imputed
2016FLFlorida238,262,150238,262,151110Published total retained; signed pumped storage included; no absent fuel imputed
2016GAGeorgia133,380,416133,380,415-110Published total retained; signed pumped storage included; no absent fuel imputed
2016HIHawaii9,948,8459,948,84619Published total retained; signed pumped storage included; no absent fuel imputed
2016IAIowa54,392,50754,392,507010Published total retained; signed pumped storage included; no absent fuel imputed
2016IDIdaho15,660,93815,660,937-110Published total retained; signed pumped storage included; no absent fuel imputed
2016ILIllinois187,289,131187,289,131011Published total retained; signed pumped storage included; no absent fuel imputed
2016INIndiana101,759,059101,759,058-110Published total retained; signed pumped storage included; no absent fuel imputed
2016KSKansas47,599,99147,599,99109Published total retained; signed pumped storage included; no absent fuel imputed
2016KYKentucky80,273,50180,273,50108Published total retained; signed pumped storage included; no absent fuel imputed
2016LALouisiana107,268,804107,268,80409Published total retained; signed pumped storage included; no absent fuel imputed
2016MAMassachusetts31,955,02231,955,021-111Published total retained; signed pumped storage included; no absent fuel imputed
2016MDMaryland37,166,68737,166,686-110Published total retained; signed pumped storage included; no absent fuel imputed
2016MEMaine11,514,42711,514,42708Published total retained; signed pumped storage included; no absent fuel imputed
2016MIMichigan112,121,790112,121,790012Published total retained; signed pumped storage included; no absent fuel imputed
2016MNMinnesota59,478,75359,478,752-110Published total retained; signed pumped storage included; no absent fuel imputed
2016MOMissouri78,611,51378,611,512-111Published total retained; signed pumped storage included; no absent fuel imputed
2016MSMississippi62,881,29562,881,294-18Published total retained; signed pumped storage included; no absent fuel imputed
2016MTMontana27,783,52927,783,53018Published total retained; signed pumped storage included; no absent fuel imputed
2016NCNorth Carolina130,779,157130,779,157011Published total retained; signed pumped storage included; no absent fuel imputed
2016NDNorth Dakota37,856,45237,856,45208Published total retained; signed pumped storage included; no absent fuel imputed
2016NENebraska36,524,86936,524,869010Published total retained; signed pumped storage included; no absent fuel imputed
2016NHNew Hampshire19,282,49319,282,49309Published total retained; signed pumped storage included; no absent fuel imputed
2016NJNew Jersey77,611,40377,611,404111Published total retained; signed pumped storage included; no absent fuel imputed
2016NMNew Mexico32,912,04532,912,04509Published total retained; signed pumped storage included; no absent fuel imputed
2016NVNevada39,787,00539,787,005010Published total retained; signed pumped storage included; no absent fuel imputed
2016NYNew York134,376,715134,376,715012Published total retained; signed pumped storage included; no absent fuel imputed
2016OHOhio119,886,066119,886,066011Published total retained; signed pumped storage included; no absent fuel imputed
2016OKOklahoma78,655,00778,655,007010Published total retained; signed pumped storage included; no absent fuel imputed
2016OROregon60,182,01360,182,012-110Published total retained; signed pumped storage included; no absent fuel imputed
2016PAPennsylvania215,041,730215,041,730012Published total retained; signed pumped storage included; no absent fuel imputed
2016RIRhode Island6,564,8856,564,88507Published total retained; signed pumped storage included; no absent fuel imputed
2016SCSouth Carolina96,985,76496,985,765110Published total retained; signed pumped storage included; no absent fuel imputed
2016SDSouth Dakota11,524,18411,524,183-18Published total retained; signed pumped storage included; no absent fuel imputed
2016TNTennessee79,340,63379,340,633012Published total retained; signed pumped storage included; no absent fuel imputed
2016TXTexas454,047,591454,047,590-111Published total retained; signed pumped storage included; no absent fuel imputed
2016US-TotalUnited States4,077,573,8014,077,573,800-113Published total retained; signed pumped storage included; no absent fuel imputed
2016UTUtah38,133,92838,133,928010Published total retained; signed pumped storage included; no absent fuel imputed
2016VAVirginia92,554,87692,554,876010Published total retained; signed pumped storage included; no absent fuel imputed
2016VTVermont1,911,2071,911,20708Published total retained; signed pumped storage included; no absent fuel imputed
2016WAWashington114,086,582114,086,581-112Published total retained; signed pumped storage included; no absent fuel imputed
2016WIWisconsin64,966,61164,966,611010Published total retained; signed pumped storage included; no absent fuel imputed
2016WVWest Virginia75,942,96875,942,96807Published total retained; signed pumped storage included; no absent fuel imputed
2016WYWyoming46,656,63046,656,63117Published total retained; signed pumped storage included; no absent fuel imputed
2017AKAlaska6,497,4666,497,465-18Published total retained; signed pumped storage included; no absent fuel imputed
2017ALAlabama139,964,250139,964,250010Published total retained; signed pumped storage included; no absent fuel imputed
2017ARArkansas60,775,21660,775,218210Published total retained; signed pumped storage included; no absent fuel imputed
2017AZArizona105,851,765105,851,765011Published total retained; signed pumped storage included; no absent fuel imputed
2017CACalifornia206,146,520206,146,519-113Published total retained; signed pumped storage included; no absent fuel imputed
2017COColorado53,844,00253,844,001-110Published total retained; signed pumped storage included; no absent fuel imputed
2017CTConnecticut34,562,65434,562,654011Published total retained; signed pumped storage included; no absent fuel imputed
2017DCDistrict of Columbia66,87166,87103Published total retained; signed pumped storage included; no absent fuel imputed
2017DEDelaware7,495,9767,495,97607Published total retained; signed pumped storage included; no absent fuel imputed
2017FLFlorida238,413,437238,413,436-110Published total retained; signed pumped storage included; no absent fuel imputed
2017GAGeorgia127,455,314127,455,314010Published total retained; signed pumped storage included; no absent fuel imputed
2017HIHawaii9,812,9689,812,96809Published total retained; signed pumped storage included; no absent fuel imputed
2017IAIowa57,909,56657,909,566010Published total retained; signed pumped storage included; no absent fuel imputed
2017IDIdaho17,396,02417,396,024010Published total retained; signed pumped storage included; no absent fuel imputed
2017ILIllinois183,591,571183,591,571011Published total retained; signed pumped storage included; no absent fuel imputed
2017INIndiana98,929,81898,929,820210Published total retained; signed pumped storage included; no absent fuel imputed
2017KSKansas50,933,29650,933,29719Published total retained; signed pumped storage included; no absent fuel imputed
2017KYKentucky73,179,19673,179,195-18Published total retained; signed pumped storage included; no absent fuel imputed
2017LALouisiana97,719,21397,719,213010Published total retained; signed pumped storage included; no absent fuel imputed
2017MAMassachusetts32,204,11532,204,114-111Published total retained; signed pumped storage included; no absent fuel imputed
2017MDMaryland34,104,08034,104,081110Published total retained; signed pumped storage included; no absent fuel imputed
2017MEMaine11,264,28011,264,279-19Published total retained; signed pumped storage included; no absent fuel imputed
2017MIMichigan112,313,501112,313,501012Published total retained; signed pumped storage included; no absent fuel imputed
2017MNMinnesota58,748,83158,748,832110Published total retained; signed pumped storage included; no absent fuel imputed
2017MOMissouri84,606,73184,606,731011Published total retained; signed pumped storage included; no absent fuel imputed
2017MSMississippi59,727,63759,727,63708Published total retained; signed pumped storage included; no absent fuel imputed
2017MTMontana28,220,94628,220,94609Published total retained; signed pumped storage included; no absent fuel imputed
2017NCNorth Carolina128,468,117128,468,117011Published total retained; signed pumped storage included; no absent fuel imputed
2017NDNorth Dakota41,505,07441,505,07408Published total retained; signed pumped storage included; no absent fuel imputed
2017NENebraska35,406,98235,406,982010Published total retained; signed pumped storage included; no absent fuel imputed
2017NHNew Hampshire17,446,84117,446,84109Published total retained; signed pumped storage included; no absent fuel imputed
2017NJNew Jersey75,644,51375,644,513011Published total retained; signed pumped storage included; no absent fuel imputed
2017NMNew Mexico33,597,41333,597,41309Published total retained; signed pumped storage included; no absent fuel imputed
2017NVNevada38,201,29438,201,294010Published total retained; signed pumped storage included; no absent fuel imputed
2017NYNew York128,025,386128,025,386012Published total retained; signed pumped storage included; no absent fuel imputed
2017OHOhio120,814,403120,814,403011Published total retained; signed pumped storage included; no absent fuel imputed
2017OKOklahoma73,731,65473,731,654010Published total retained; signed pumped storage included; no absent fuel imputed
2017OROregon62,713,74762,713,748110Published total retained; signed pumped storage included; no absent fuel imputed
2017PAPennsylvania213,591,294213,591,294012Published total retained; signed pumped storage included; no absent fuel imputed
2017RIRhode Island7,614,9417,614,94107Published total retained; signed pumped storage included; no absent fuel imputed
2017SCSouth Carolina93,080,93993,080,937-210Published total retained; signed pumped storage included; no absent fuel imputed
2017SDSouth Dakota10,935,71910,935,71907Published total retained; signed pumped storage included; no absent fuel imputed
2017TNTennessee79,046,22279,046,222012Published total retained; signed pumped storage included; no absent fuel imputed
2017TXTexas452,794,365452,794,366111Published total retained; signed pumped storage included; no absent fuel imputed
2017US-TotalUnited States4,035,442,8954,035,442,895013Published total retained; signed pumped storage included; no absent fuel imputed
2017UTUtah37,411,87637,411,876010Published total retained; signed pumped storage included; no absent fuel imputed
2017VAVirginia90,417,14990,417,148-110Published total retained; signed pumped storage included; no absent fuel imputed
2017VTVermont2,141,3882,141,38808Published total retained; signed pumped storage included; no absent fuel imputed
2017WAWashington115,912,078115,912,079112Published total retained; signed pumped storage included; no absent fuel imputed
2017WIWisconsin65,107,33365,107,331-210Published total retained; signed pumped storage included; no absent fuel imputed
2017WVWest Virginia73,357,08073,357,08007Published total retained; signed pumped storage included; no absent fuel imputed
2017WYWyoming46,741,84646,741,84607Published total retained; signed pumped storage included; no absent fuel imputed
2018AKAlaska6,247,3596,247,358-18Published total retained; signed pumped storage included; no absent fuel imputed
2018ALAlabama145,057,994145,057,995110Published total retained; signed pumped storage included; no absent fuel imputed
2018ARArkansas67,999,35267,999,351-110Published total retained; signed pumped storage included; no absent fuel imputed
2018AZArizona111,925,144111,925,145111Published total retained; signed pumped storage included; no absent fuel imputed
2018CACalifornia195,465,638195,465,638013Published total retained; signed pumped storage included; no absent fuel imputed
2018COColorado55,386,27955,386,277-210Published total retained; signed pumped storage included; no absent fuel imputed
2018CTConnecticut39,453,55239,453,550-211Published total retained; signed pumped storage included; no absent fuel imputed
2018DCDistrict of Columbia79,33179,33103Published total retained; signed pumped storage included; no absent fuel imputed
2018DEDelaware6,240,6446,240,64407Published total retained; signed pumped storage included; no absent fuel imputed
2018FLFlorida244,252,035244,252,035010Published total retained; signed pumped storage included; no absent fuel imputed
2018GAGeorgia129,239,371129,239,372110Published total retained; signed pumped storage included; no absent fuel imputed
2018HIHawaii9,796,7739,796,773010Published total retained; signed pumped storage included; no absent fuel imputed
2018IAIowa63,380,56963,380,570110Published total retained; signed pumped storage included; no absent fuel imputed
2018IDIdaho18,172,12018,172,119-110Published total retained; signed pumped storage included; no absent fuel imputed
2018ILIllinois188,003,357188,003,358111Published total retained; signed pumped storage included; no absent fuel imputed
2018INIndiana113,459,711113,459,712110Published total retained; signed pumped storage included; no absent fuel imputed
2018KSKansas51,710,21351,710,21309Published total retained; signed pumped storage included; no absent fuel imputed
2018KYKentucky78,804,49778,804,49708Published total retained; signed pumped storage included; no absent fuel imputed
2018LALouisiana102,128,485102,128,484-110Published total retained; signed pumped storage included; no absent fuel imputed
2018MAMassachusetts27,172,88227,172,881-111Published total retained; signed pumped storage included; no absent fuel imputed
2018MDMaryland43,809,64843,809,649110Published total retained; signed pumped storage included; no absent fuel imputed
2018MEMaine11,280,70011,280,70009Published total retained; signed pumped storage included; no absent fuel imputed
2018MIMichigan115,837,095115,837,095012Published total retained; signed pumped storage included; no absent fuel imputed
2018MNMinnesota61,517,44161,517,442110Published total retained; signed pumped storage included; no absent fuel imputed
2018MOMissouri85,095,38485,095,384011Published total retained; signed pumped storage included; no absent fuel imputed
2018MSMississippi63,473,77163,473,77218Published total retained; signed pumped storage included; no absent fuel imputed
2018MTMontana28,212,83128,212,83109Published total retained; signed pumped storage included; no absent fuel imputed
2018NCNorth Carolina134,249,497134,249,497011Published total retained; signed pumped storage included; no absent fuel imputed
2018NDNorth Dakota42,615,32142,615,32108Published total retained; signed pumped storage included; no absent fuel imputed
2018NENebraska36,966,21636,966,216010Published total retained; signed pumped storage included; no absent fuel imputed
2018NHNew Hampshire17,087,15617,087,15609Published total retained; signed pumped storage included; no absent fuel imputed
2018NJNew Jersey75,033,60075,033,601111Published total retained; signed pumped storage included; no absent fuel imputed
2018NMNew Mexico32,673,68232,673,68209Published total retained; signed pumped storage included; no absent fuel imputed
2018NVNevada39,640,24139,640,242110Published total retained; signed pumped storage included; no absent fuel imputed
2018NYNew York132,520,501132,520,500-112Published total retained; signed pumped storage included; no absent fuel imputed
2018OHOhio127,937,288127,937,289111Published total retained; signed pumped storage included; no absent fuel imputed
2018OKOklahoma87,181,40287,181,401-110Published total retained; signed pumped storage included; no absent fuel imputed
2018OROregon64,113,56064,113,561110Published total retained; signed pumped storage included; no absent fuel imputed
2018PAPennsylvania215,385,830215,385,830012Published total retained; signed pumped storage included; no absent fuel imputed
2018RIRhode Island8,375,2578,375,25707Published total retained; signed pumped storage included; no absent fuel imputed
2018SCSouth Carolina99,364,08899,364,089110Published total retained; signed pumped storage included; no absent fuel imputed
2018SDSouth Dakota12,616,39612,616,39608Published total retained; signed pumped storage included; no absent fuel imputed
2018TNTennessee81,554,91781,554,916-112Published total retained; signed pumped storage included; no absent fuel imputed
2018TXTexas477,352,425477,352,425011Published total retained; signed pumped storage included; no absent fuel imputed
2018US-TotalUnited States4,180,987,7034,180,987,705213Published total retained; signed pumped storage included; no absent fuel imputed
2018UTUtah39,375,42439,375,424010Published total retained; signed pumped storage included; no absent fuel imputed
2018VAVirginia95,509,12195,509,121010Published total retained; signed pumped storage included; no absent fuel imputed
2018VTVermont2,178,9152,178,91618Published total retained; signed pumped storage included; no absent fuel imputed
2018WAWashington116,756,729116,756,728-112Published total retained; signed pumped storage included; no absent fuel imputed
2018WIWisconsin65,936,80365,936,803010Published total retained; signed pumped storage included; no absent fuel imputed
2018WVWest Virginia67,249,02567,249,024-17Published total retained; signed pumped storage included; no absent fuel imputed
2018WYWyoming46,112,13646,112,13608Published total retained; signed pumped storage included; no absent fuel imputed
2019AKAlaska6,070,8436,070,84308Published total retained; signed pumped storage included; no absent fuel imputed
2019ALAlabama142,679,433142,679,433010Published total retained; signed pumped storage included; no absent fuel imputed
2019ARArkansas64,442,89864,442,899110Published total retained; signed pumped storage included; no absent fuel imputed
2019AZArizona113,551,987113,551,987011Published total retained; signed pumped storage included; no absent fuel imputed
2019CACalifornia201,784,204201,784,206213Published total retained; signed pumped storage included; no absent fuel imputed
2019COColorado56,337,73456,337,735110Published total retained; signed pumped storage included; no absent fuel imputed
2019CTConnecticut40,050,03840,050,037-111Published total retained; signed pumped storage included; no absent fuel imputed
2019DCDistrict of Columbia174,080174,08004Published total retained; signed pumped storage included; no absent fuel imputed
2019DEDelaware5,258,5385,258,537-17Published total retained; signed pumped storage included; no absent fuel imputed
2019FLFlorida245,603,485245,603,484-110Published total retained; signed pumped storage included; no absent fuel imputed
2019GAGeorgia128,691,569128,691,571210Published total retained; signed pumped storage included; no absent fuel imputed
2019HIHawaii9,749,9989,749,997-110Published total retained; signed pumped storage included; no absent fuel imputed
2019IAIowa62,649,56362,649,563010Published total retained; signed pumped storage included; no absent fuel imputed
2019IDIdaho18,407,81218,407,811-110Published total retained; signed pumped storage included; no absent fuel imputed
2019ILIllinois184,470,052184,470,052011Published total retained; signed pumped storage included; no absent fuel imputed
2019INIndiana102,505,381102,505,381010Published total retained; signed pumped storage included; no absent fuel imputed
2019KSKansas50,887,99250,887,99209Published total retained; signed pumped storage included; no absent fuel imputed
2019KYKentucky71,804,25471,804,253-18Published total retained; signed pumped storage included; no absent fuel imputed
2019LALouisiana100,174,762100,174,763110Published total retained; signed pumped storage included; no absent fuel imputed
2019MAMassachusetts21,515,63621,515,636011Published total retained; signed pumped storage included; no absent fuel imputed
2019MDMaryland39,325,59539,325,595010Published total retained; signed pumped storage included; no absent fuel imputed
2019MEMaine10,490,56210,490,56319Published total retained; signed pumped storage included; no absent fuel imputed
2019MIMichigan116,701,488116,701,487-112Published total retained; signed pumped storage included; no absent fuel imputed
2019MNMinnesota59,379,39059,379,390010Published total retained; signed pumped storage included; no absent fuel imputed
2019MOMissouri78,278,75178,278,751011Published total retained; signed pumped storage included; no absent fuel imputed
2019MSMississippi65,958,76065,958,76008Published total retained; signed pumped storage included; no absent fuel imputed
2019MTMontana27,797,07927,797,07909Published total retained; signed pumped storage included; no absent fuel imputed
2019NCNorth Carolina131,173,861131,173,861011Published total retained; signed pumped storage included; no absent fuel imputed
2019NDNorth Dakota41,147,32441,147,32408Published total retained; signed pumped storage included; no absent fuel imputed
2019NENebraska37,297,61537,297,615010Published total retained; signed pumped storage included; no absent fuel imputed
2019NHNew Hampshire18,026,59518,026,59509Published total retained; signed pumped storage included; no absent fuel imputed
2019NJNew Jersey71,018,77471,018,774011Published total retained; signed pumped storage included; no absent fuel imputed
2019NMNew Mexico35,174,51035,174,509-19Published total retained; signed pumped storage included; no absent fuel imputed
2019NVNevada39,889,66039,889,660010Published total retained; signed pumped storage included; no absent fuel imputed
2019NYNew York131,603,289131,603,290112Published total retained; signed pumped storage included; no absent fuel imputed
2019OHOhio121,550,123121,550,123011Published total retained; signed pumped storage included; no absent fuel imputed
2019OKOklahoma86,386,17086,386,171110Published total retained; signed pumped storage included; no absent fuel imputed
2019OROregon62,258,37862,258,378010Published total retained; signed pumped storage included; no absent fuel imputed
2019PAPennsylvania228,995,331228,995,330-112Published total retained; signed pumped storage included; no absent fuel imputed
2019RIRhode Island7,624,4037,624,40307Published total retained; signed pumped storage included; no absent fuel imputed
2019SCSouth Carolina100,107,504100,107,504010Published total retained; signed pumped storage included; no absent fuel imputed
2019SDSouth Dakota14,506,64714,506,64709Published total retained; signed pumped storage included; no absent fuel imputed
2019TNTennessee82,327,10982,327,109012Published total retained; signed pumped storage included; no absent fuel imputed
2019TXTexas483,201,031483,201,031011Published total retained; signed pumped storage included; no absent fuel imputed
2019US-TotalUnited States4,130,573,8794,130,573,879013Published total retained; signed pumped storage included; no absent fuel imputed
2019UTUtah39,117,03339,117,033010Published total retained; signed pumped storage included; no absent fuel imputed
2019VAVirginia96,827,63996,827,641210Published total retained; signed pumped storage included; no absent fuel imputed
2019VTVermont2,289,7982,289,79808Published total retained; signed pumped storage included; no absent fuel imputed
2019WAWashington106,463,608106,463,609112Published total retained; signed pumped storage included; no absent fuel imputed
2019WIWisconsin62,774,29962,774,298-110Published total retained; signed pumped storage included; no absent fuel imputed
2019WVWest Virginia63,925,63963,925,63908Published total retained; signed pumped storage included; no absent fuel imputed
2019WYWyoming42,145,65642,145,65718Published total retained; signed pumped storage included; no absent fuel imputed
2020AKAlaska6,276,4416,276,44218Published total retained; signed pumped storage included; no absent fuel imputed
2020ALAlabama137,547,377137,547,376-110Published total retained; signed pumped storage included; no absent fuel imputed
2020ARArkansas54,641,25954,641,259010Published total retained; signed pumped storage included; no absent fuel imputed
2020AZArizona109,305,057109,305,056-111Published total retained; signed pumped storage included; no absent fuel imputed
2020CACalifornia193,083,537193,083,537013Published total retained; signed pumped storage included; no absent fuel imputed
2020COColorado54,115,01154,115,011011Published total retained; signed pumped storage included; no absent fuel imputed
2020CTConnecticut41,190,57241,190,572011Published total retained; signed pumped storage included; no absent fuel imputed
2020DCDistrict of Columbia201,104201,10404Published total retained; signed pumped storage included; no absent fuel imputed
2020DEDelaware5,205,3725,205,37207Published total retained; signed pumped storage included; no absent fuel imputed
2020FLFlorida250,827,799250,827,799010Published total retained; signed pumped storage included; no absent fuel imputed
2020GAGeorgia120,128,938120,128,939110Published total retained; signed pumped storage included; no absent fuel imputed
2020HIHawaii9,079,0199,079,019010Published total retained; signed pumped storage included; no absent fuel imputed
2020IAIowa59,636,67159,636,672110Published total retained; signed pumped storage included; no absent fuel imputed
2020IDIdaho17,686,13517,686,135010Published total retained; signed pumped storage included; no absent fuel imputed
2020ILIllinois173,394,526173,394,525-111Published total retained; signed pumped storage included; no absent fuel imputed
2020INIndiana90,072,97990,072,979010Published total retained; signed pumped storage included; no absent fuel imputed
2020KSKansas54,541,83154,541,83219Published total retained; signed pumped storage included; no absent fuel imputed
2020KYKentucky63,539,82963,539,828-18Published total retained; signed pumped storage included; no absent fuel imputed
2020LALouisiana100,773,772100,773,772010Published total retained; signed pumped storage included; no absent fuel imputed
2020MAMassachusetts18,214,17518,214,175010Published total retained; signed pumped storage included; no absent fuel imputed
2020MDMaryland36,029,14636,029,146010Published total retained; signed pumped storage included; no absent fuel imputed
2020MEMaine10,001,87010,001,87119Published total retained; signed pumped storage included; no absent fuel imputed
2020MIMichigan106,624,721106,624,720-112Published total retained; signed pumped storage included; no absent fuel imputed
2020MNMinnesota56,510,14356,510,142-110Published total retained; signed pumped storage included; no absent fuel imputed
2020MOMissouri72,567,87972,567,880111Published total retained; signed pumped storage included; no absent fuel imputed
2020MSMississippi66,581,76666,581,76608Published total retained; signed pumped storage included; no absent fuel imputed
2020MTMontana23,353,29023,353,291110Published total retained; signed pumped storage included; no absent fuel imputed
2020NCNorth Carolina124,363,443124,363,443011Published total retained; signed pumped storage included; no absent fuel imputed
2020NDNorth Dakota42,176,42442,176,42408Published total retained; signed pumped storage included; no absent fuel imputed
2020NENebraska36,848,68136,848,681010Published total retained; signed pumped storage included; no absent fuel imputed
2020NHNew Hampshire16,350,57816,350,578010Published total retained; signed pumped storage included; no absent fuel imputed
2020NJNew Jersey61,106,45861,106,457-111Published total retained; signed pumped storage included; no absent fuel imputed
2020NMNew Mexico34,075,58434,075,58519Published total retained; signed pumped storage included; no absent fuel imputed
2020NVNevada40,424,74540,424,745010Published total retained; signed pumped storage included; no absent fuel imputed
2020NYNew York129,430,271129,430,271012Published total retained; signed pumped storage included; no absent fuel imputed
2020OHOhio122,538,182122,538,183111Published total retained; signed pumped storage included; no absent fuel imputed
2020OKOklahoma83,367,72983,367,728-110Published total retained; signed pumped storage included; no absent fuel imputed
2020OROregon63,624,78263,624,782010Published total retained; signed pumped storage included; no absent fuel imputed
2020PAPennsylvania230,143,279230,143,280112Published total retained; signed pumped storage included; no absent fuel imputed
2020RIRhode Island8,894,9408,894,94007Published total retained; signed pumped storage included; no absent fuel imputed
2020SCSouth Carolina98,528,79798,528,797010Published total retained; signed pumped storage included; no absent fuel imputed
2020SDSouth Dakota14,146,53914,146,53909Published total retained; signed pumped storage included; no absent fuel imputed
2020TNTennessee80,566,01080,566,009-112Published total retained; signed pumped storage included; no absent fuel imputed
2020TXTexas473,514,930473,514,929-111Published total retained; signed pumped storage included; no absent fuel imputed
2020US-TotalUnited States4,009,766,8464,009,766,845-113Published total retained; signed pumped storage included; no absent fuel imputed
2020UTUtah37,087,30937,087,308-110Published total retained; signed pumped storage included; no absent fuel imputed
2020VAVirginia103,056,001103,056,001010Published total retained; signed pumped storage included; no absent fuel imputed
2020VTVermont2,156,4072,156,40818Published total retained; signed pumped storage included; no absent fuel imputed
2020WAWashington116,114,468116,114,467-112Published total retained; signed pumped storage included; no absent fuel imputed
2020WIWisconsin61,448,54561,448,545010Published total retained; signed pumped storage included; no absent fuel imputed
2020WVWest Virginia56,661,53356,661,53418Published total retained; signed pumped storage included; no absent fuel imputed
2020WYWyoming42,010,98942,010,99018Published total retained; signed pumped storage included; no absent fuel imputed
2021AKAlaska6,595,8186,595,81809Published total retained; signed pumped storage included; no absent fuel imputed
2021ALAlabama142,733,330142,733,330010Published total retained; signed pumped storage included; no absent fuel imputed
2021ARArkansas61,100,06861,100,069110Published total retained; signed pumped storage included; no absent fuel imputed
2021AZArizona108,604,620108,604,619-111Published total retained; signed pumped storage included; no absent fuel imputed
2021CACalifornia197,165,106197,165,105-113Published total retained; signed pumped storage included; no absent fuel imputed
2021COColorado56,838,47256,838,471-111Published total retained; signed pumped storage included; no absent fuel imputed
2021CTConnecticut44,079,94344,079,944111Published total retained; signed pumped storage included; no absent fuel imputed
2021DCDistrict of Columbia211,101211,100-14Published total retained; signed pumped storage included; no absent fuel imputed
2021DEDelaware4,305,1264,305,125-17Published total retained; signed pumped storage included; no absent fuel imputed
2021FLFlorida247,906,982247,906,981-110Published total retained; signed pumped storage included; no absent fuel imputed
2021GAGeorgia124,200,528124,200,529110Published total retained; signed pumped storage included; no absent fuel imputed
2021HIHawaii9,182,1919,182,190-110Published total retained; signed pumped storage included; no absent fuel imputed
2021IAIowa67,207,00867,207,00809Published total retained; signed pumped storage included; no absent fuel imputed
2021IDIdaho16,836,47316,836,472-110Published total retained; signed pumped storage included; no absent fuel imputed
2021ILIllinois181,637,574181,637,575111Published total retained; signed pumped storage included; no absent fuel imputed
2021INIndiana94,164,79694,164,795-110Published total retained; signed pumped storage included; no absent fuel imputed
2021KSKansas56,630,70356,630,70419Published total retained; signed pumped storage included; no absent fuel imputed
2021KYKentucky69,908,41169,908,41108Published total retained; signed pumped storage included; no absent fuel imputed
2021LALouisiana98,715,31398,715,313010Published total retained; signed pumped storage included; no absent fuel imputed
2021MAMassachusetts19,477,34719,477,346-110Published total retained; signed pumped storage included; no absent fuel imputed
2021MDMaryland38,235,13738,235,138110Published total retained; signed pumped storage included; no absent fuel imputed
2021MEMaine10,908,15010,908,149-19Published total retained; signed pumped storage included; no absent fuel imputed
2021MIMichigan115,513,130115,513,130012Published total retained; signed pumped storage included; no absent fuel imputed
2021MNMinnesota59,195,76959,195,770110Published total retained; signed pumped storage included; no absent fuel imputed
2021MOMissouri76,941,41076,941,410011Published total retained; signed pumped storage included; no absent fuel imputed
2021MSMississippi67,723,49767,723,49818Published total retained; signed pumped storage included; no absent fuel imputed
2021MTMontana24,947,92324,947,923010Published total retained; signed pumped storage included; no absent fuel imputed
2021NCNorth Carolina129,923,364129,923,365111Published total retained; signed pumped storage included; no absent fuel imputed
2021NDNorth Dakota43,032,37843,032,37808Published total retained; signed pumped storage included; no absent fuel imputed
2021NENebraska37,910,89837,910,897-110Published total retained; signed pumped storage included; no absent fuel imputed
2021NHNew Hampshire17,193,25417,193,254010Published total retained; signed pumped storage included; no absent fuel imputed
2021NJNew Jersey61,433,79261,433,792011Published total retained; signed pumped storage included; no absent fuel imputed
2021NMNew Mexico35,192,36535,192,36509Published total retained; signed pumped storage included; no absent fuel imputed
2021NVNevada41,754,58441,754,584010Published total retained; signed pumped storage included; no absent fuel imputed
2021NYNew York124,772,248124,772,249112Published total retained; signed pumped storage included; no absent fuel imputed
2021OHOhio125,947,507125,947,507011Published total retained; signed pumped storage included; no absent fuel imputed
2021OKOklahoma80,754,58680,754,587110Published total retained; signed pumped storage included; no absent fuel imputed
2021OROregon61,016,87461,016,873-19Published total retained; signed pumped storage included; no absent fuel imputed
2021PAPennsylvania241,331,434241,331,434012Published total retained; signed pumped storage included; no absent fuel imputed
2021RIRhode Island9,322,6509,322,649-17Published total retained; signed pumped storage included; no absent fuel imputed
2021SCSouth Carolina98,390,44198,390,441010Published total retained; signed pumped storage included; no absent fuel imputed
2021SDSouth Dakota17,322,40917,322,408-19Published total retained; signed pumped storage included; no absent fuel imputed
2021TNTennessee79,057,20979,057,209012Published total retained; signed pumped storage included; no absent fuel imputed
2021TXTexas481,844,256481,844,257111Published total retained; signed pumped storage included; no absent fuel imputed
2021US-TotalUnited States4,109,699,3904,109,699,389-113Published total retained; signed pumped storage included; no absent fuel imputed
2021UTUtah42,565,64542,565,646110Published total retained; signed pumped storage included; no absent fuel imputed
2021VAVirginia93,478,18293,478,182011Published total retained; signed pumped storage included; no absent fuel imputed
2021VTVermont2,107,7032,107,70308Published total retained; signed pumped storage included; no absent fuel imputed
2021WAWashington110,808,401110,808,400-112Published total retained; signed pumped storage included; no absent fuel imputed
2021WIWisconsin64,276,48064,276,480010Published total retained; signed pumped storage included; no absent fuel imputed
2021WVWest Virginia65,836,06365,836,06308Published total retained; signed pumped storage included; no absent fuel imputed
2021WYWyoming43,460,74443,460,74408Published total retained; signed pumped storage included; no absent fuel imputed
2022AKAlaska6,694,1286,694,12919Published total retained; signed pumped storage included; no absent fuel imputed
2022ALAlabama144,788,893144,788,892-110Published total retained; signed pumped storage included; no absent fuel imputed
2022ARArkansas65,905,03065,905,030010Published total retained; signed pumped storage included; no absent fuel imputed
2022AZArizona104,698,773104,698,774111Published total retained; signed pumped storage included; no absent fuel imputed
2022CACalifornia203,383,857203,383,857013Published total retained; signed pumped storage included; no absent fuel imputed
2022COColorado58,044,00958,044,010111Published total retained; signed pumped storage included; no absent fuel imputed
2022CTConnecticut43,054,09943,054,099011Published total retained; signed pumped storage included; no absent fuel imputed
2022DCDistrict of Columbia160,237160,23704Published total retained; signed pumped storage included; no absent fuel imputed
2022DEDelaware5,308,3705,308,37007Published total retained; signed pumped storage included; no absent fuel imputed
2022FLFlorida258,910,357258,910,358110Published total retained; signed pumped storage included; no absent fuel imputed
2022GAGeorgia126,484,633126,484,633010Published total retained; signed pumped storage included; no absent fuel imputed
2022HIHawaii9,337,4349,337,434010Published total retained; signed pumped storage included; no absent fuel imputed
2022IAIowa72,982,19872,982,19809Published total retained; signed pumped storage included; no absent fuel imputed
2022IDIdaho16,278,41016,278,410010Published total retained; signed pumped storage included; no absent fuel imputed
2022ILIllinois185,223,322185,223,322011Published total retained; signed pumped storage included; no absent fuel imputed
2022INIndiana98,054,90598,054,906110Published total retained; signed pumped storage included; no absent fuel imputed
2022KSKansas62,197,51662,197,51609Published total retained; signed pumped storage included; no absent fuel imputed
2022KYKentucky69,147,32969,147,32908Published total retained; signed pumped storage included; no absent fuel imputed
2022LALouisiana105,504,849105,504,850110Published total retained; signed pumped storage included; no absent fuel imputed
2022MAMassachusetts21,026,16121,026,161010Published total retained; signed pumped storage included; no absent fuel imputed
2022MDMaryland37,139,36537,139,366110Published total retained; signed pumped storage included; no absent fuel imputed
2022MEMaine12,763,92012,763,92009Published total retained; signed pumped storage included; no absent fuel imputed
2022MIMichigan117,497,052117,497,053112Published total retained; signed pumped storage included; no absent fuel imputed
2022MNMinnesota58,966,89158,966,891010Published total retained; signed pumped storage included; no absent fuel imputed
2022MOMissouri79,361,03179,361,030-111Published total retained; signed pumped storage included; no absent fuel imputed
2022MSMississippi67,781,24067,781,239-18Published total retained; signed pumped storage included; no absent fuel imputed
2022MTMontana27,088,74027,088,741110Published total retained; signed pumped storage included; no absent fuel imputed
2022NCNorth Carolina134,257,088134,257,088011Published total retained; signed pumped storage included; no absent fuel imputed
2022NDNorth Dakota44,400,95644,400,95608Published total retained; signed pumped storage included; no absent fuel imputed
2022NENebraska40,692,71840,692,718010Published total retained; signed pumped storage included; no absent fuel imputed
2022NHNew Hampshire18,764,39318,764,394110Published total retained; signed pumped storage included; no absent fuel imputed
2022NJNew Jersey65,060,63665,060,637111Published total retained; signed pumped storage included; no absent fuel imputed
2022NMNew Mexico40,889,03640,889,03609Published total retained; signed pumped storage included; no absent fuel imputed
2022NVNevada42,591,83842,591,838010Published total retained; signed pumped storage included; no absent fuel imputed
2022NYNew York125,185,364125,185,365112Published total retained; signed pumped storage included; no absent fuel imputed
2022OHOhio135,810,459135,810,460111Published total retained; signed pumped storage included; no absent fuel imputed
2022OKOklahoma84,634,92284,634,922010Published total retained; signed pumped storage included; no absent fuel imputed
2022OROregon61,317,61661,317,61609Published total retained; signed pumped storage included; no absent fuel imputed
2022PAPennsylvania239,261,130239,261,130012Published total retained; signed pumped storage included; no absent fuel imputed
2022RIRhode Island7,819,4537,819,45308Published total retained; signed pumped storage included; no absent fuel imputed
2022SCSouth Carolina98,709,50198,709,501010Published total retained; signed pumped storage included; no absent fuel imputed
2022SDSouth Dakota17,900,46217,900,462010Published total retained; signed pumped storage included; no absent fuel imputed
2022TNTennessee78,036,04578,036,045012Published total retained; signed pumped storage included; no absent fuel imputed
2022TXTexas525,563,343525,563,343011Published total retained; signed pumped storage included; no absent fuel imputed
2022US-TotalUnited States4,230,667,5634,230,667,562-113Published total retained; signed pumped storage included; no absent fuel imputed
2022UTUtah39,386,04339,386,042-110Published total retained; signed pumped storage included; no absent fuel imputed
2022VAVirginia89,477,32589,477,325011Published total retained; signed pumped storage included; no absent fuel imputed
2022VTVermont2,183,8292,183,82908Published total retained; signed pumped storage included; no absent fuel imputed
2022WAWashington116,690,500116,690,500012Published total retained; signed pumped storage included; no absent fuel imputed
2022WIWisconsin61,239,30261,239,301-110Published total retained; signed pumped storage included; no absent fuel imputed
2022WVWest Virginia56,665,36056,665,36008Published total retained; signed pumped storage included; no absent fuel imputed
2022WYWyoming46,347,49246,347,49208Published total retained; signed pumped storage included; no absent fuel imputed
2023AKAlaska6,717,8256,717,824-19Published total retained; signed pumped storage included; no absent fuel imputed
2023ALAlabama139,435,011139,435,011010Published total retained; signed pumped storage included; no absent fuel imputed
2023ARArkansas63,195,64763,195,646-110Published total retained; signed pumped storage included; no absent fuel imputed
2023AZArizona111,838,736111,838,735-111Published total retained; signed pumped storage included; no absent fuel imputed
2023CACalifornia216,628,795216,628,794-113Published total retained; signed pumped storage included; no absent fuel imputed
2023COColorado57,541,71957,541,719011Published total retained; signed pumped storage included; no absent fuel imputed
2023CTConnecticut40,666,41840,666,419111Published total retained; signed pumped storage included; no absent fuel imputed
2023DCDistrict of Columbia171,870171,87004Published total retained; signed pumped storage included; no absent fuel imputed
2023DEDelaware4,772,0594,772,05907Published total retained; signed pumped storage included; no absent fuel imputed
2023FLFlorida259,798,332259,798,333110Published total retained; signed pumped storage included; no absent fuel imputed
2023GAGeorgia129,221,513129,221,514110Published total retained; signed pumped storage included; no absent fuel imputed
2023HIHawaii9,194,1649,194,16409Published total retained; signed pumped storage included; no absent fuel imputed
2023IAIowa69,836,97369,836,97419Published total retained; signed pumped storage included; no absent fuel imputed
2023IDIdaho17,842,44617,842,445-110Published total retained; signed pumped storage included; no absent fuel imputed
2023ILIllinois177,737,641177,737,642111Published total retained; signed pumped storage included; no absent fuel imputed
2023INIndiana90,046,88090,046,880010Published total retained; signed pumped storage included; no absent fuel imputed
2023KSKansas58,456,59858,456,59809Published total retained; signed pumped storage included; no absent fuel imputed
2023KYKentucky63,217,08063,217,079-18Published total retained; signed pumped storage included; no absent fuel imputed
2023LALouisiana97,784,56697,784,565-110Published total retained; signed pumped storage included; no absent fuel imputed
2023MAMassachusetts19,695,88419,695,885110Published total retained; signed pumped storage included; no absent fuel imputed
2023MDMaryland36,000,65036,000,648-210Published total retained; signed pumped storage included; no absent fuel imputed
2023MEMaine12,512,18112,512,18109Published total retained; signed pumped storage included; no absent fuel imputed
2023MIMichigan120,656,625120,656,626112Published total retained; signed pumped storage included; no absent fuel imputed
2023MNMinnesota57,276,86257,276,861-110Published total retained; signed pumped storage included; no absent fuel imputed
2023MOMissouri66,703,28566,703,285011Published total retained; signed pumped storage included; no absent fuel imputed
2023MSMississippi72,933,44072,933,439-18Published total retained; signed pumped storage included; no absent fuel imputed
2023MTMontana26,895,75826,895,759110Published total retained; signed pumped storage included; no absent fuel imputed
2023NCNorth Carolina126,553,381126,553,382111Published total retained; signed pumped storage included; no absent fuel imputed
2023NDNorth Dakota42,068,80742,068,80818Published total retained; signed pumped storage included; no absent fuel imputed
2023NENebraska39,445,95539,445,955010Published total retained; signed pumped storage included; no absent fuel imputed
2023NHNew Hampshire16,824,99916,824,998-110Published total retained; signed pumped storage included; no absent fuel imputed
2023NJNew Jersey64,228,91464,228,914011Published total retained; signed pumped storage included; no absent fuel imputed
2023NMNew Mexico39,269,07339,269,07309Published total retained; signed pumped storage included; no absent fuel imputed
2023NVNevada42,164,37542,164,375010Published total retained; signed pumped storage included; no absent fuel imputed
2023NYNew York124,039,988124,039,989112Published total retained; signed pumped storage included; no absent fuel imputed
2023OHOhio133,223,464133,223,464011Published total retained; signed pumped storage included; no absent fuel imputed
2023OKOklahoma89,236,01789,236,017010Published total retained; signed pumped storage included; no absent fuel imputed
2023OROregon61,691,86961,691,87019Published total retained; signed pumped storage included; no absent fuel imputed
2023PAPennsylvania235,924,936235,924,936012Published total retained; signed pumped storage included; no absent fuel imputed
2023RIRhode Island10,430,83710,430,83708Published total retained; signed pumped storage included; no absent fuel imputed
2023SCSouth Carolina100,853,387100,853,387010Published total retained; signed pumped storage included; no absent fuel imputed
2023SDSouth Dakota17,436,15817,436,157-110Published total retained; signed pumped storage included; no absent fuel imputed
2023TNTennessee77,791,20477,791,205112Published total retained; signed pumped storage included; no absent fuel imputed
2023TXTexas547,294,545547,294,545011Published total retained; signed pumped storage included; no absent fuel imputed
2023US-TotalUnited States4,183,270,4794,183,270,478-113Published total retained; signed pumped storage included; no absent fuel imputed
2023UTUtah33,496,55433,496,555110Published total retained; signed pumped storage included; no absent fuel imputed
2023VAVirginia91,059,34491,059,345111Published total retained; signed pumped storage included; no absent fuel imputed
2023VTVermont2,480,1992,480,19908Published total retained; signed pumped storage included; no absent fuel imputed
2023WAWashington102,960,605102,960,605012Published total retained; signed pumped storage included; no absent fuel imputed
2023WIWisconsin62,548,70562,548,706110Published total retained; signed pumped storage included; no absent fuel imputed
2023WVWest Virginia52,286,78452,286,78518Published total retained; signed pumped storage included; no absent fuel imputed
2023WYWyoming43,181,42043,181,42008Published total retained; signed pumped storage included; no absent fuel imputed
2024AKAlaska6,690,5066,690,50609Published total retained; signed pumped storage included; no absent fuel imputed
2024ALAlabama142,921,216142,921,216010Published total retained; signed pumped storage included; no absent fuel imputed
2024ARArkansas61,542,48461,542,484010Published total retained; signed pumped storage included; no absent fuel imputed
2024AZArizona116,026,511116,026,511011Published total retained; signed pumped storage included; no absent fuel imputed
2024CACalifornia214,191,383214,191,385213Published total retained; signed pumped storage included; no absent fuel imputed
2024COColorado58,798,39558,798,395010Published total retained; signed pumped storage included; no absent fuel imputed
2024CTConnecticut44,761,41244,761,412011Published total retained; signed pumped storage included; no absent fuel imputed
2024DCDistrict of Columbia187,195187,19614Published total retained; signed pumped storage included; no absent fuel imputed
2024DEDelaware4,799,2124,799,21207Published total retained; signed pumped storage included; no absent fuel imputed
2024FLFlorida266,119,236266,119,236010Published total retained; signed pumped storage included; no absent fuel imputed
2024GAGeorgia139,805,428139,805,429110Published total retained; signed pumped storage included; no absent fuel imputed
2024HIHawaii9,160,9799,160,97909Published total retained; signed pumped storage included; no absent fuel imputed
2024IAIowa70,464,14870,464,147-19Published total retained; signed pumped storage included; no absent fuel imputed
2024IDIdaho20,035,43820,035,438010Published total retained; signed pumped storage included; no absent fuel imputed
2024ILIllinois185,012,935185,012,935011Published total retained; signed pumped storage included; no absent fuel imputed
2024INIndiana97,012,88097,012,878-29Published total retained; signed pumped storage included; no absent fuel imputed
2024KSKansas57,696,15557,696,15509Published total retained; signed pumped storage included; no absent fuel imputed
2024KYKentucky66,950,84866,950,84918Published total retained; signed pumped storage included; no absent fuel imputed
2024LALouisiana99,622,83599,622,835010Published total retained; signed pumped storage included; no absent fuel imputed
2024MAMassachusetts20,914,89020,914,889-110Published total retained; signed pumped storage included; no absent fuel imputed
2024MDMaryland35,424,81635,424,817110Published total retained; signed pumped storage included; no absent fuel imputed
2024MEMaine14,655,17814,655,177-19Published total retained; signed pumped storage included; no absent fuel imputed
2024MIMichigan124,200,090124,200,091112Published total retained; signed pumped storage included; no absent fuel imputed
2024MNMinnesota58,595,22258,595,222010Published total retained; signed pumped storage included; no absent fuel imputed
2024MOMissouri66,875,71066,875,710011Published total retained; signed pumped storage included; no absent fuel imputed
2024MSMississippi77,336,71277,336,71209Published total retained; signed pumped storage included; no absent fuel imputed
2024MTMontana26,872,88326,872,884110Published total retained; signed pumped storage included; no absent fuel imputed
2024NCNorth Carolina134,965,396134,965,396011Published total retained; signed pumped storage included; no absent fuel imputed
2024NDNorth Dakota42,557,24342,557,242-18Published total retained; signed pumped storage included; no absent fuel imputed
2024NENebraska37,228,95037,228,949-110Published total retained; signed pumped storage included; no absent fuel imputed
2024NHNew Hampshire16,942,47916,942,480110Published total retained; signed pumped storage included; no absent fuel imputed
2024NJNew Jersey60,175,24560,175,245011Published total retained; signed pumped storage included; no absent fuel imputed
2024NMNew Mexico39,697,29439,697,29519Published total retained; signed pumped storage included; no absent fuel imputed
2024NVNevada45,528,42745,528,427010Published total retained; signed pumped storage included; no absent fuel imputed
2024NYNew York129,015,493129,015,494112Published total retained; signed pumped storage included; no absent fuel imputed
2024OHOhio142,746,706142,746,706011Published total retained; signed pumped storage included; no absent fuel imputed
2024OKOklahoma94,069,14594,069,146110Published total retained; signed pumped storage included; no absent fuel imputed
2024OROregon64,661,24964,661,24909Published total retained; signed pumped storage included; no absent fuel imputed
2024PAPennsylvania241,498,648241,498,649112Published total retained; signed pumped storage included; no absent fuel imputed
2024RIRhode Island9,777,0279,777,02708Published total retained; signed pumped storage included; no absent fuel imputed
2024SCSouth Carolina100,485,416100,485,416010Published total retained; signed pumped storage included; no absent fuel imputed
2024SDSouth Dakota20,871,99420,871,994010Published total retained; signed pumped storage included; no absent fuel imputed
2024TNTennessee76,166,76676,166,767112Published total retained; signed pumped storage included; no absent fuel imputed
2024TXTexas566,502,688566,502,687-111Published total retained; signed pumped storage included; no absent fuel imputed
2024US-TotalUnited States4,308,634,2974,308,634,297013Published total retained; signed pumped storage included; no absent fuel imputed
2024UTUtah35,133,90635,133,907110Published total retained; signed pumped storage included; no absent fuel imputed
2024VAVirginia102,698,615102,698,615011Published total retained; signed pumped storage included; no absent fuel imputed
2024VTVermont2,258,8912,258,89108Published total retained; signed pumped storage included; no absent fuel imputed
2024WAWashington102,397,711102,397,712112Published total retained; signed pumped storage included; no absent fuel imputed
2024WIWisconsin65,276,34465,276,343-110Published total retained; signed pumped storage included; no absent fuel imputed
2024WVWest Virginia50,594,81850,594,81809Published total retained; signed pumped storage included; no absent fuel imputed
2024WYWyoming40,709,15040,709,15118Published total retained; signed pumped storage included; no absent fuel imputed
2025AKAlaska7,537,7327,537,73319Published total retained; signed pumped storage included; no absent fuel imputed
2025ALAlabama142,994,795142,994,795010Published total retained; signed pumped storage included; no absent fuel imputed
2025ARArkansas68,607,24168,607,241011Published total retained; signed pumped storage included; no absent fuel imputed
2025AZArizona116,470,876116,470,876011Published total retained; signed pumped storage included; no absent fuel imputed
2025CACalifornia205,105,814205,105,813-113Published total retained; signed pumped storage included; no absent fuel imputed
2025COColorado56,644,90156,644,901010Published total retained; signed pumped storage included; no absent fuel imputed
2025CTConnecticut43,773,26643,773,267111Published total retained; signed pumped storage included; no absent fuel imputed
2025DCDistrict of Columbia198,159198,15904Published total retained; signed pumped storage included; no absent fuel imputed
2025DEDelaware5,461,6345,461,63407Published total retained; signed pumped storage included; no absent fuel imputed
2025FLFlorida268,262,996268,262,995-110Published total retained; signed pumped storage included; no absent fuel imputed
2025GAGeorgia145,688,391145,688,393210Published total retained; signed pumped storage included; no absent fuel imputed
2025HIHawaii9,323,1359,323,134-19Published total retained; signed pumped storage included; no absent fuel imputed
2025IAIowa74,504,73274,504,73209Published total retained; signed pumped storage included; no absent fuel imputed
2025IDIdaho20,285,34920,285,350110Published total retained; signed pumped storage included; no absent fuel imputed
2025ILIllinois191,820,799191,820,799011Published total retained; signed pumped storage included; no absent fuel imputed
2025INIndiana106,896,527106,896,52819Published total retained; signed pumped storage included; no absent fuel imputed
2025KSKansas61,984,54061,984,54119Published total retained; signed pumped storage included; no absent fuel imputed
2025KYKentucky74,373,40774,373,40708Published total retained; signed pumped storage included; no absent fuel imputed
2025LALouisiana102,391,851102,391,853210Published total retained; signed pumped storage included; no absent fuel imputed
2025MAMassachusetts22,455,56722,455,567010Published total retained; signed pumped storage included; no absent fuel imputed
2025MDMaryland37,605,84637,605,845-110Published total retained; signed pumped storage included; no absent fuel imputed
2025MEMaine14,843,05514,843,054-19Published total retained; signed pumped storage included; no absent fuel imputed
2025MIMichigan128,531,694128,531,695112Published total retained; signed pumped storage included; no absent fuel imputed
2025MNMinnesota58,830,39558,830,394-110Published total retained; signed pumped storage included; no absent fuel imputed
2025MOMissouri71,526,87571,526,875011Published total retained; signed pumped storage included; no absent fuel imputed
2025MSMississippi78,429,34878,429,34809Published total retained; signed pumped storage included; no absent fuel imputed
2025MTMontana26,725,20326,725,203010Published total retained; signed pumped storage included; no absent fuel imputed
2025NCNorth Carolina134,695,642134,695,642011Published total retained; signed pumped storage included; no absent fuel imputed
2025NDNorth Dakota42,873,33042,873,33008Published total retained; signed pumped storage included; no absent fuel imputed
2025NENebraska39,808,30439,808,303-110Published total retained; signed pumped storage included; no absent fuel imputed
2025NHNew Hampshire19,112,24619,112,245-110Published total retained; signed pumped storage included; no absent fuel imputed
2025NJNew Jersey60,963,38860,963,390211Published total retained; signed pumped storage included; no absent fuel imputed
2025NMNew Mexico39,439,51339,439,512-19Published total retained; signed pumped storage included; no absent fuel imputed
2025NVNevada45,192,78545,192,785010Published total retained; signed pumped storage included; no absent fuel imputed
2025NYNew York130,936,043130,936,043012Published total retained; signed pumped storage included; no absent fuel imputed
2025OHOhio145,331,002145,331,002011Published total retained; signed pumped storage included; no absent fuel imputed
2025OKOklahoma89,894,62089,894,621110Published total retained; signed pumped storage included; no absent fuel imputed
2025OROregon64,282,54564,282,54509Published total retained; signed pumped storage included; no absent fuel imputed
2025PAPennsylvania245,720,751245,720,750-112Published total retained; signed pumped storage included; no absent fuel imputed
2025RIRhode Island9,812,0109,812,01008Published total retained; signed pumped storage included; no absent fuel imputed
2025SCSouth Carolina103,942,990103,942,989-110Published total retained; signed pumped storage included; no absent fuel imputed
2025SDSouth Dakota21,865,72721,865,727010Published total retained; signed pumped storage included; no absent fuel imputed
2025TNTennessee75,446,35375,446,354112Published total retained; signed pumped storage included; no absent fuel imputed
2025TXTexas600,981,980600,981,978-211Published total retained; signed pumped storage included; no absent fuel imputed
2025US-TotalUnited States4,425,028,5264,425,028,525-113Published total retained; signed pumped storage included; no absent fuel imputed
2025UTUtah38,144,05538,144,055010Published total retained; signed pumped storage included; no absent fuel imputed
2025VAVirginia106,388,642106,388,643111Published total retained; signed pumped storage included; no absent fuel imputed
2025VTVermont2,033,0302,033,03008Published total retained; signed pumped storage included; no absent fuel imputed
2025WAWashington101,670,382101,670,382012Published total retained; signed pumped storage included; no absent fuel imputed
2025WIWisconsin66,253,08666,253,086010Published total retained; signed pumped storage included; no absent fuel imputed
2025WVWest Virginia53,389,45553,389,45509Published total retained; signed pumped storage included; no absent fuel imputed
2025WYWyoming45,576,51745,576,51708Published total retained; signed pumped storage included; no absent fuel imputed

Download the same complete table (CSV)

Matched gas and coal endpoint changes, all 99 rows

Same-source edition 2015 and 2025 endpoint records. Includes only geographies with numeric rows for the fuel in both years, with separate same-year all-source total denominators. Descriptive output and share changes, not causal displacement.

Period: 2015 through 2025, one September 2026 final historical workbook edition. Units: Whole MWh; percent; percentage point change.

Original sources: EIA state historical generation workbook, source row and columns A:E

Matched gas and coal endpoint changes; 2015 through 2025, one September 2026 final historical workbook edition; Whole MWh; percent; percentage point change
statestate namefuelbegin yearend yearbegin mwhend mwhchange mwhbegin share pctend share pctshare change percentage pointscomparison
AKAlaskaNatural Gas2,0152,0253,089,7133,769,651679,93849.160650.01040.8498Matched reported fuel observations and same-year state total denominators
AKAlaskaCoal2,0152,025667,549789,644122,09510.621410.4759-0.1455Matched reported fuel observations and same-year state total denominators
ALAlabamaNatural Gas2,0152,02555,844,45765,595,1549,750,69736.624745.87249.2477Matched reported fuel observations and same-year state total denominators
ALAlabamaCoal2,0152,02541,410,42921,661,512-19,748,91727.158415.1485-12.0099Matched reported fuel observations and same-year state total denominators
ARArkansasNatural Gas2,0152,02514,866,28623,227,4858,361,19926.757433.85577.0983Matched reported fuel observations and same-year state total denominators
ARArkansasCoal2,0152,02521,740,03320,379,592-1,360,44139.129329.7047-9.4246Matched reported fuel observations and same-year state total denominators
AZArizonaNatural Gas2,0152,02533,657,10252,670,48519,013,38329.747745.222015.4744Matched reported fuel observations and same-year state total denominators
AZArizonaCoal2,0152,02536,167,1699,218,820-26,948,34931.96627.9151-24.0510Matched reported fuel observations and same-year state total denominators
CACaliforniaNatural Gas2,0152,025116,139,60974,287,239-41,852,37059.042936.2190-22.8239Matched reported fuel observations and same-year state total denominators
CACaliforniaCoal2,0152,025297,874234,247-63,6270.15140.1142-0.0372Matched reported fuel observations and same-year state total denominators
COColoradoNatural Gas2,0152,02511,643,75018,137,7556,494,00522.223832.02019.7963Matched reported fuel observations and same-year state total denominators
COColoradoCoal2,0152,02531,540,89514,018,344-17,522,55160.200524.7478-35.4527Matched reported fuel observations and same-year state total denominators
CTConnecticutNatural Gas2,0152,02517,362,30924,712,2807,349,97146.335856.455210.1194Matched reported fuel observations and same-year state total denominators
CTConnecticutCoal2,0152,025600,4690-600,4691.60250-1.6025Matched reported fuel observations and same-year state total denominators
DCDistrict of ColumbiaNatural Gas2,0152,02522,653111,86889,21542.145156.453714.3085Matched reported fuel observations and same-year state total denominators
DEDelawareNatural Gas2,0152,0256,689,2674,699,834-1,989,43385.650086.05180.4018Matched reported fuel observations and same-year state total denominators
DEDelawareCoal2,0152,025598,588252,716-345,8727.66444.6271-3.0373Matched reported fuel observations and same-year state total denominators
FLFloridaNatural Gas2,0152,025155,824,152195,704,97839,880,82665.634372.95277.3183Matched reported fuel observations and same-year state total denominators
FLFloridaCoal2,0152,02542,904,00910,184,627-32,719,38218.07153.7965-14.2750Matched reported fuel observations and same-year state total denominators
GAGeorgiaNatural Gas2,0152,02550,469,26656,264,0035,794,73739.178838.6194-0.5594Matched reported fuel observations and same-year state total denominators
GAGeorgiaCoal2,0152,02537,130,63019,987,318-17,143,31228.824113.7192-15.1049Matched reported fuel observations and same-year state total denominators
IAIowaNatural Gas2,0152,0252,398,1359,123,9526,725,8174.232612.24618.0136Matched reported fuel observations and same-year state total denominators
IAIowaCoal2,0152,02529,811,07519,101,694-10,709,38152.615025.6382-26.9767Matched reported fuel observations and same-year state total denominators
IDIdahoNatural Gas2,0152,0253,803,5886,364,7982,561,21024.277631.37637.0988Matched reported fuel observations and same-year state total denominators
IDIdahoCoal2,0152,02578,9930-78,9930.50420-0.5042Matched reported fuel observations and same-year state total denominators
ILIllinoisNatural Gas2,0152,02510,863,88330,735,46619,871,5835.601316.023010.4217Matched reported fuel observations and same-year state total denominators
ILIllinoisCoal2,0152,02573,773,70630,891,205-42,882,50138.037116.1042-21.9329Matched reported fuel observations and same-year state total denominators
INIndianaNatural Gas2,0152,02516,262,98737,895,42821,632,44115.634635.450619.8160Matched reported fuel observations and same-year state total denominators
INIndianaCoal2,0152,02578,230,68849,223,259-29,007,42975.207946.0476-29.1603Matched reported fuel observations and same-year state total denominators
KSKansasNatural Gas2,0152,0251,173,9023,560,2472,386,3452.57855.74383.1653Matched reported fuel observations and same-year state total denominators
KSKansasCoal2,0152,02524,593,33419,341,910-5,251,42454.019131.2044-22.8147Matched reported fuel observations and same-year state total denominators
KYKentuckyNatural Gas2,0152,0255,949,72719,101,47013,151,7437.121725.683218.5615Matched reported fuel observations and same-year state total denominators
KYKentuckyCoal2,0152,02572,620,42948,660,318-23,960,11186.925165.4270-21.4981Matched reported fuel observations and same-year state total denominators
LALouisianaNatural Gas2,0152,02566,210,83273,947,0017,736,16961.413072.219610.8066Matched reported fuel observations and same-year state total denominators
LALouisianaCoal2,0152,02515,164,9585,531,206-9,633,75214.06615.4020-8.6641Matched reported fuel observations and same-year state total denominators
MAMassachusettsNatural Gas2,0152,02521,007,41117,695,959-3,311,45265.472378.804313.3321Matched reported fuel observations and same-year state total denominators
MAMassachusettsCoal2,0152,0252,252,6640-2,252,6647.02070-7.0207Matched reported fuel observations and same-year state total denominators
MDMarylandNatural Gas2,0152,0254,555,34516,008,68711,453,34212.526542.569730.0431Matched reported fuel observations and same-year state total denominators
MDMarylandCoal2,0152,02513,925,6042,293,558-11,632,04638.29346.0989-32.1945Matched reported fuel observations and same-year state total denominators
MEMaineNatural Gas2,0152,0252,951,9065,804,6852,852,77925.141339.107113.9658Matched reported fuel observations and same-year state total denominators
MEMaineCoal2,0152,02591,90131,777-60,1240.78270.2141-0.5686Matched reported fuel observations and same-year state total denominators
MIMichiganNatural Gas2,0152,02520,044,79854,286,71534,241,91717.737542.236124.4986Matched reported fuel observations and same-year state total denominators
MIMichiganCoal2,0152,02552,884,03329,291,205-23,592,82846.796722.7891-24.0076Matched reported fuel observations and same-year state total denominators
MNMinnesotaNatural Gas2,0152,0257,389,43811,350,2493,960,81112.968519.29326.3246Matched reported fuel observations and same-year state total denominators
MNMinnesotaCoal2,0152,02524,697,09814,153,495-10,543,60343.343624.0581-19.2855Matched reported fuel observations and same-year state total denominators
MOMissouriNatural Gas2,0152,0254,596,4138,835,6194,239,2065.495512.35296.8574Matched reported fuel observations and same-year state total denominators
MOMissouriCoal2,0152,02565,325,52145,993,177-19,332,34478.103164.3020-13.8012Matched reported fuel observations and same-year state total denominators
MSMississippiNatural Gas2,0152,02545,116,94357,699,27812,582,33569.670273.56853.8983Matched reported fuel observations and same-year state total denominators
MSMississippiCoal2,0152,0256,399,6054,181,315-2,218,2909.88245.3313-4.5510Matched reported fuel observations and same-year state total denominators
MTMontanaNatural Gas2,0152,025599,2061,315,853716,6472.04494.92362.8787Matched reported fuel observations and same-year state total denominators
MTMontanaCoal2,0152,02516,013,2069,616,551-6,396,65554.648135.9831-18.6650Matched reported fuel observations and same-year state total denominators
NCNorth CarolinaNatural Gas2,0152,02536,544,59654,727,03218,182,43628.464140.630112.1661Matched reported fuel observations and same-year state total denominators
NCNorth CarolinaCoal2,0152,02539,922,16817,898,860-22,023,30831.094813.2884-17.8065Matched reported fuel observations and same-year state total denominators
NDNorth DakotaNatural Gas2,0152,025711,0442,777,1292,066,0851.91366.47754.5639Matched reported fuel observations and same-year state total denominators
NDNorth DakotaCoal2,0152,02527,734,41322,598,048-5,136,36574.641952.7089-21.9331Matched reported fuel observations and same-year state total denominators
NENebraskaNatural Gas2,0152,025430,7311,546,5801,115,8491.08003.88512.8051Matched reported fuel observations and same-year state total denominators
NENebraskaCoal2,0152,02524,185,42118,102,000-6,083,42160.640345.4729-15.1674Matched reported fuel observations and same-year state total denominators
NHNew HampshireNatural Gas2,0152,0256,051,6955,319,191-732,50430.234427.8313-2.4031Matched reported fuel observations and same-year state total denominators
NHNew HampshireCoal2,0152,025936,662239,428-697,2344.67961.2527-3.4268Matched reported fuel observations and same-year state total denominators
NJNew JerseyNatural Gas2,0152,02536,974,45630,064,866-6,909,59049.557749.3163-0.2415Matched reported fuel observations and same-year state total denominators
NJNew JerseyCoal2,0152,0251,759,0960-1,759,0962.35780-2.3578Matched reported fuel observations and same-year state total denominators
NMNew MexicoNatural Gas2,0152,0259,364,62410,505,4001,140,77628.636826.6367-2.0000Matched reported fuel observations and same-year state total denominators
NMNew MexicoCoal2,0152,02520,439,5328,181,616-12,257,91662.503520.7447-41.7588Matched reported fuel observations and same-year state total denominators
NVNevadaNatural Gas2,0152,02528,999,51422,876,055-6,123,45974.268650.6188-23.6498Matched reported fuel observations and same-year state total denominators
NVNevadaCoal2,0152,0252,657,2892,588,728-68,5616.80545.7282-1.0772Matched reported fuel observations and same-year state total denominators
NYNew YorkNatural Gas2,0152,02556,923,41563,113,3266,189,91141.075748.20167.1259Matched reported fuel observations and same-year state total denominators
NYNew YorkCoal2,0152,0252,380,0660-2,380,0661.71740-1.7174Matched reported fuel observations and same-year state total denominators
OHOhioNatural Gas2,0152,02529,219,60978,784,99649,565,38723.740554.210730.4703Matched reported fuel observations and same-year state total denominators
OHOhioCoal2,0152,02571,709,53035,748,049-35,961,48158.262924.5977-33.6652Matched reported fuel observations and same-year state total denominators
OKOklahomaNatural Gas2,0152,02534,286,32739,725,1005,438,77345.033244.1907-0.8425Matched reported fuel observations and same-year state total denominators
OKOklahomaCoal2,0152,02524,867,0329,414,089-15,452,94332.661510.4724-22.1891Matched reported fuel observations and same-year state total denominators
OROregonNatural Gas2,0152,02516,237,09222,903,8026,666,71028.059635.62997.5703Matched reported fuel observations and same-year state total denominators
PAPennsylvaniaNatural Gas2,0152,02559,454,655143,124,18883,669,53327.711958.246730.5347Matched reported fuel observations and same-year state total denominators
PAPennsylvaniaCoal2,0152,02564,637,23317,283,134-47,354,09930.12767.0336-23.0939Matched reported fuel observations and same-year state total denominators
RIRhode IslandNatural Gas2,0152,0256,585,9438,660,0202,074,07794.911788.2594-6.6523Matched reported fuel observations and same-year state total denominators
RIRhode IslandCoal2,0152,025000000Matched reported fuel observations and same-year state total denominators
SCSouth CarolinaNatural Gas2,0152,02516,549,30622,658,6676,109,36117.143821.79914.6553Matched reported fuel observations and same-year state total denominators
SCSouth CarolinaCoal2,0152,02522,631,17318,177,808-4,453,36523.444217.4882-5.9559Matched reported fuel observations and same-year state total denominators
SDSouth DakotaNatural Gas2,0152,025772,7532,440,5851,667,8328.021911.16173.1398Matched reported fuel observations and same-year state total denominators
SDSouth DakotaCoal2,0152,0251,495,0792,026,133531,05415.52039.2662-6.2541Matched reported fuel observations and same-year state total denominators
TNTennesseeNatural Gas2,0152,0259,323,73017,903,1348,579,40412.396223.729611.3335Matched reported fuel observations and same-year state total denominators
TNTennesseeCoal2,0152,02530,586,33118,019,354-12,566,97740.665423.8837-16.7817Matched reported fuel observations and same-year state total denominators
TXTexasNatural Gas2,0152,025237,731,427290,245,56952,514,14252.849648.2952-4.5544Matched reported fuel observations and same-year state total denominators
TXTexasCoal2,0152,025121,554,28468,889,079-52,665,20527.022511.4628-15.5597Matched reported fuel observations and same-year state total denominators
US-TotalUnited StatesNatural Gas2,0152,0251,334,668,0031,811,003,580476,335,57732.722840.92648.2036Matched reported fuel observations and same-year state total denominators
US-TotalUnited StatesCoal2,0152,0251,352,398,197734,928,492-617,469,70533.157516.6084-16.5490Matched reported fuel observations and same-year state total denominators
UTUtahNatural Gas2,0152,0258,217,66511,518,6093,300,94419.589630.197710.6081Matched reported fuel observations and same-year state total denominators
UTUtahCoal2,0152,02531,656,48918,006,776-13,649,71375.464047.2073-28.2567Matched reported fuel observations and same-year state total denominators
VAVirginiaNatural Gas2,0152,02533,284,21661,597,18528,312,96939.430957.898318.4674Matched reported fuel observations and same-year state total denominators
VAVirginiaCoal2,0152,02517,231,4263,606,931-13,624,49520.41363.3903-17.0232Matched reported fuel observations and same-year state total denominators
VTVermontNatural Gas2,0152,0251,4931,094-3990.07530.0538-0.0215Matched reported fuel observations and same-year state total denominators
WAWashingtonNatural Gas2,0152,02513,045,92715,978,1662,932,23911.937315.71573.7784Matched reported fuel observations and same-year state total denominators
WAWashingtonCoal2,0152,0255,051,9153,160,338-1,891,5774.62263.1084-1.5142Matched reported fuel observations and same-year state total denominators
WIWisconsinNatural Gas2,0152,02513,398,77523,653,21810,254,44320.191035.701315.5103Matched reported fuel observations and same-year state total denominators
WIWisconsinCoal2,0152,02537,180,54723,317,940-13,862,60756.028435.1953-20.8331Matched reported fuel observations and same-year state total denominators
WVWest VirginiaNatural Gas2,0152,0251,303,6303,309,9432,006,3131.80326.19964.3964Matched reported fuel observations and same-year state total denominators
WVWest VirginiaCoal2,0152,02568,056,09346,271,672-21,784,42194.136386.6682-7.4681Matched reported fuel observations and same-year state total denominators
WYWyomingNatural Gas2,0152,025722,3044,663,5873,941,2831.475110.23248.7573Matched reported fuel observations and same-year state total denominators
WYWyomingCoal2,0152,02543,091,18926,361,018-16,730,17188.001357.8390-30.1623Matched reported fuel observations and same-year state total denominators

Download the same complete table (CSV)

Complete national fuel history in one source edition, all 143 rows

Every selected U.S. reported fuel row from 2015 through 2025, with each year’s published national all-source total. No separate small solar estimate added.

Period: 2015 through 2025, one September 2026 final historical workbook edition. Units: Whole signed MWh; percent; source row numbers.

Original sources: EIA state historical generation workbook, source row and columns A:E

Complete national fuel history in one source edition; 2015 through 2025, one September 2026 final historical workbook edition; Whole signed MWh; percent; source row numbers
yearstatefuelnet generation mwhsource rowproducerstate nametotal generation mwhshare pct
2015US-TotalCoal1,352,398,19745019Total Electric Power IndustryUnited States4,078,713,77233.1575
2015US-TotalGeothermal15,917,57545020Total Electric Power IndustryUnited States4,078,713,7720.3903
2015US-TotalPumped Storage-5,091,48845021Total Electric Power IndustryUnited States4,078,713,772-0.1248
2015US-TotalHydroelectric Conventional249,080,08545022Total Electric Power IndustryUnited States4,078,713,7726.1068
2015US-TotalNatural Gas1,334,668,00345023Total Electric Power IndustryUnited States4,078,713,77232.7228
2015US-TotalNuclear797,177,87745024Total Electric Power IndustryUnited States4,078,713,77219.5448
2015US-TotalOther Gases13,116,69845025Total Electric Power IndustryUnited States4,078,713,7720.3216
2015US-TotalOther13,954,74845026Total Electric Power IndustryUnited States4,078,713,7720.3421
2015US-TotalPetroleum28,248,74945027Total Electric Power IndustryUnited States4,078,713,7720.6926
2015US-TotalSolar Thermal and Photovoltaic24,892,90445028Total Electric Power IndustryUnited States4,078,713,7720.6103
2015US-TotalOther Biomass21,703,37245029Total Electric Power IndustryUnited States4,078,713,7720.5321
2015US-TotalWind190,718,54845030Total Electric Power IndustryUnited States4,078,713,7724.6759
2015US-TotalWood and Wood Derived Fuels41,928,50645031Total Electric Power IndustryUnited States4,078,713,7721.0280
2016US-TotalCoal1,239,148,65447090Total Electric Power IndustryUnited States4,077,573,80130.3894
2016US-TotalGeothermal15,825,80747091Total Electric Power IndustryUnited States4,077,573,8010.3881
2016US-TotalPumped Storage-6,686,12747092Total Electric Power IndustryUnited States4,077,573,801-0.1640
2016US-TotalHydroelectric Conventional267,812,15347093Total Electric Power IndustryUnited States4,077,573,8016.5679
2016US-TotalNatural Gas1,379,270,92247094Total Electric Power IndustryUnited States4,077,573,80133.8258
2016US-TotalNuclear805,693,94847095Total Electric Power IndustryUnited States4,077,573,80119.7592
2016US-TotalOther Gases12,807,43247096Total Electric Power IndustryUnited States4,077,573,8010.3141
2016US-TotalOther13,689,06447097Total Electric Power IndustryUnited States4,077,573,8010.3357
2016US-TotalPetroleum24,204,80647098Total Electric Power IndustryUnited States4,077,573,8010.5936
2016US-TotalSolar Thermal and Photovoltaic36,054,12147099Total Electric Power IndustryUnited States4,077,573,8010.8842
2016US-TotalOther Biomass21,813,23147100Total Electric Power IndustryUnited States4,077,573,8010.5350
2016US-TotalWind226,992,56247101Total Electric Power IndustryUnited States4,077,573,8015.5669
2016US-TotalWood and Wood Derived Fuels40,947,22747102Total Electric Power IndustryUnited States4,077,573,8011.0042
2017US-TotalCoal1,205,835,27649187Total Electric Power IndustryUnited States4,035,442,89529.8811
2017US-TotalGeothermal15,926,77449188Total Electric Power IndustryUnited States4,035,442,8950.3947
2017US-TotalPumped Storage-6,494,54849189Total Electric Power IndustryUnited States4,035,442,895-0.1609
2017US-TotalHydroelectric Conventional300,332,93049190Total Electric Power IndustryUnited States4,035,442,8957.4424
2017US-TotalNatural Gas1,297,702,52849191Total Electric Power IndustryUnited States4,035,442,89532.1576
2017US-TotalNuclear804,949,63549192Total Electric Power IndustryUnited States4,035,442,89519.9470
2017US-TotalOther Gases12,468,96749193Total Electric Power IndustryUnited States4,035,442,8950.3090
2017US-TotalOther13,008,41649194Total Electric Power IndustryUnited States4,035,442,8950.3224
2017US-TotalPetroleum21,389,94549195Total Electric Power IndustryUnited States4,035,442,8950.5301
2017US-TotalSolar Thermal and Photovoltaic53,286,86549196Total Electric Power IndustryUnited States4,035,442,8951.3205
2017US-TotalOther Biomass21,609,89449197Total Electric Power IndustryUnited States4,035,442,8950.5355
2017US-TotalWind254,302,69549198Total Electric Power IndustryUnited States4,035,442,8956.3017
2017US-TotalWood and Wood Derived Fuels41,123,51849199Total Electric Power IndustryUnited States4,035,442,8951.0191
2018US-TotalCoal1,149,487,33951299Total Electric Power IndustryUnited States4,180,987,70327.4932
2018US-TotalGeothermal15,967,13451300Total Electric Power IndustryUnited States4,180,987,7030.3819
2018US-TotalPumped Storage-5,904,53951301Total Electric Power IndustryUnited States4,180,987,703-0.1412
2018US-TotalHydroelectric Conventional292,523,98951302Total Electric Power IndustryUnited States4,180,987,7036.9965
2018US-TotalNatural Gas1,471,843,03151303Total Electric Power IndustryUnited States4,180,987,70335.2032
2018US-TotalNuclear807,084,47751304Total Electric Power IndustryUnited States4,180,987,70319.3037
2018US-TotalOther Gases13,462,74951305Total Electric Power IndustryUnited States4,180,987,7030.3220
2018US-TotalOther12,973,20451306Total Electric Power IndustryUnited States4,180,987,7030.3103
2018US-TotalPetroleum25,225,62851307Total Electric Power IndustryUnited States4,180,987,7030.6033
2018US-TotalSolar Thermal and Photovoltaic63,825,31551308Total Electric Power IndustryUnited States4,180,987,7031.5266
2018US-TotalOther Biomass20,895,76551309Total Electric Power IndustryUnited States4,180,987,7030.4998
2018US-TotalWind272,667,45451310Total Electric Power IndustryUnited States4,180,987,7036.5216
2018US-TotalWood and Wood Derived Fuels40,936,15951311Total Electric Power IndustryUnited States4,180,987,7030.9791
2019US-TotalCoal964,956,81253420Total Electric Power IndustryUnited States4,130,573,87923.3613
2019US-TotalGeothermal15,472,71753421Total Electric Power IndustryUnited States4,130,573,8790.3746
2019US-TotalPumped Storage-5,260,74453422Total Electric Power IndustryUnited States4,130,573,879-0.1274
2019US-TotalHydroelectric Conventional287,873,73153423Total Electric Power IndustryUnited States4,130,573,8796.9693
2019US-TotalNatural Gas1,588,532,83953424Total Electric Power IndustryUnited States4,130,573,87938.4579
2019US-TotalNuclear809,409,26253425Total Electric Power IndustryUnited States4,130,573,87919.5956
2019US-TotalOther Gases12,591,09453426Total Electric Power IndustryUnited States4,130,573,8790.3048
2019US-TotalOther13,331,16753427Total Electric Power IndustryUnited States4,130,573,8790.3227
2019US-TotalPetroleum18,340,74353428Total Electric Power IndustryUnited States4,130,573,8790.4440
2019US-TotalSolar Thermal and Photovoltaic71,936,82253429Total Electric Power IndustryUnited States4,130,573,8791.7416
2019US-TotalOther Biomass18,963,57153430Total Electric Power IndustryUnited States4,130,573,8790.4591
2019US-TotalWind295,882,48353431Total Electric Power IndustryUnited States4,130,573,8797.1632
2019US-TotalWood and Wood Derived Fuels38,543,38253432Total Electric Power IndustryUnited States4,130,573,8790.9331
2020US-TotalCoal773,392,89755547Total Electric Power IndustryUnited States4,009,766,84619.2877
2020US-TotalGeothermal15,889,69755548Total Electric Power IndustryUnited States4,009,766,8460.3963
2020US-TotalPumped Storage-5,321,20555549Total Electric Power IndustryUnited States4,009,766,846-0.1327
2020US-TotalHydroelectric Conventional285,273,89555550Total Electric Power IndustryUnited States4,009,766,8467.1145
2020US-TotalNatural Gas1,626,789,64055551Total Electric Power IndustryUnited States4,009,766,84640.5707
2020US-TotalNuclear789,878,86355552Total Electric Power IndustryUnited States4,009,766,84619.6989
2020US-TotalOther Gases11,818,47855553Total Electric Power IndustryUnited States4,009,766,8460.2947
2020US-TotalOther12,855,18555554Total Electric Power IndustryUnited States4,009,766,8460.3206
2020US-TotalPetroleum17,341,01555555Total Electric Power IndustryUnited States4,009,766,8460.4325
2020US-TotalSolar Thermal and Photovoltaic89,198,71555556Total Electric Power IndustryUnited States4,009,766,8462.2245
2020US-TotalOther Biomass18,492,67355557Total Electric Power IndustryUnited States4,009,766,8460.4612
2020US-TotalWind337,938,04955558Total Electric Power IndustryUnited States4,009,766,8468.4279
2020US-TotalWood and Wood Derived Fuels36,218,94355559Total Electric Power IndustryUnited States4,009,766,8460.9033
2021US-TotalCoal897,998,76057676Total Electric Power IndustryUnited States4,109,699,39021.8507
2021US-TotalGeothermal15,975,12757677Total Electric Power IndustryUnited States4,109,699,3900.3887
2021US-TotalPumped Storage-5,111,68457678Total Electric Power IndustryUnited States4,109,699,390-0.1244
2021US-TotalHydroelectric Conventional251,584,84257679Total Electric Power IndustryUnited States4,109,699,3906.1217
2021US-TotalNatural Gas1,579,189,98757680Total Electric Power IndustryUnited States4,109,699,39038.4259
2021US-TotalNuclear779,644,59557681Total Electric Power IndustryUnited States4,109,699,39018.9708
2021US-TotalOther Gases11,397,23757682Total Electric Power IndustryUnited States4,109,699,3900.2773
2021US-TotalOther12,140,06657683Total Electric Power IndustryUnited States4,109,699,3900.2954
2021US-TotalPetroleum19,173,21057684Total Electric Power IndustryUnited States4,109,699,3900.4665
2021US-TotalSolar Thermal and Photovoltaic115,258,24857685Total Electric Power IndustryUnited States4,109,699,3902.8045
2021US-TotalOther Biomass17,789,55357686Total Electric Power IndustryUnited States4,109,699,3900.4329
2021US-TotalWind378,196,77557687Total Electric Power IndustryUnited States4,109,699,3909.2025
2021US-TotalWood and Wood Derived Fuels36,462,67357688Total Electric Power IndustryUnited States4,109,699,3900.8872
2022US-TotalCoal831,511,61259809Total Electric Power IndustryUnited States4,230,667,56319.6544
2022US-TotalGeothermal16,086,92959810Total Electric Power IndustryUnited States4,230,667,5630.3802
2022US-TotalPumped Storage-6,027,85859811Total Electric Power IndustryUnited States4,230,667,563-0.1425
2022US-TotalHydroelectric Conventional254,788,66759812Total Electric Power IndustryUnited States4,230,667,5636.0224
2022US-TotalNatural Gas1,687,064,73959813Total Electric Power IndustryUnited States4,230,667,56339.8770
2022US-TotalNuclear771,537,17659814Total Electric Power IndustryUnited States4,230,667,56318.2368
2022US-TotalOther Gases11,722,27359815Total Electric Power IndustryUnited States4,230,667,5630.2771
2022US-TotalOther11,114,22059816Total Electric Power IndustryUnited States4,230,667,5630.2627
2022US-TotalPetroleum22,931,24259817Total Electric Power IndustryUnited States4,230,667,5630.5420
2022US-TotalSolar Thermal and Photovoltaic143,791,88859818Total Electric Power IndustryUnited States4,230,667,5633.3988
2022US-TotalOther Biomass16,383,40859819Total Electric Power IndustryUnited States4,230,667,5630.3873
2022US-TotalWind434,297,35859820Total Electric Power IndustryUnited States4,230,667,56310.2655
2022US-TotalWood and Wood Derived Fuels35,465,90859821Total Electric Power IndustryUnited States4,230,667,5630.8383
2023US-TotalCoal675,115,27761944Total Electric Power IndustryUnited States4,183,270,47916.1385
2023US-TotalGeothermal16,367,39861945Total Electric Power IndustryUnited States4,183,270,4790.3913
2023US-TotalPumped Storage-5,990,02861946Total Electric Power IndustryUnited States4,183,270,479-0.1432
2023US-TotalHydroelectric Conventional245,002,33861947Total Electric Power IndustryUnited States4,183,270,4795.8567
2023US-TotalNatural Gas1,806,062,91161948Total Electric Power IndustryUnited States4,183,270,47943.1735
2023US-TotalNuclear774,873,16961949Total Electric Power IndustryUnited States4,183,270,47918.5231
2023US-TotalOther Gases11,777,79461950Total Electric Power IndustryUnited States4,183,270,4790.2815
2023US-TotalOther9,957,42161951Total Electric Power IndustryUnited States4,183,270,4790.2380
2023US-TotalPetroleum16,233,02161952Total Electric Power IndustryUnited States4,183,270,4790.3880
2023US-TotalSolar Thermal and Photovoltaic165,530,34961953Total Electric Power IndustryUnited States4,183,270,4793.9570
2023US-TotalOther Biomass15,584,90661954Total Electric Power IndustryUnited States4,183,270,4790.3726
2023US-TotalWind421,141,33561955Total Electric Power IndustryUnited States4,183,270,47910.0673
2023US-TotalWood and Wood Derived Fuels31,614,58761956Total Electric Power IndustryUnited States4,183,270,4790.7557
2024US-TotalCoal652,155,92164076Total Electric Power IndustryUnited States4,308,634,29715.1360
2024US-TotalGeothermal15,407,14064077Total Electric Power IndustryUnited States4,308,634,2970.3576
2024US-TotalPumped Storage-5,851,86264078Total Electric Power IndustryUnited States4,308,634,297-0.1358
2024US-TotalHydroelectric Conventional242,896,05464079Total Electric Power IndustryUnited States4,308,634,2975.6374
2024US-TotalNatural Gas1,869,902,14664080Total Electric Power IndustryUnited States4,308,634,29743.3990
2024US-TotalNuclear781,865,31064081Total Electric Power IndustryUnited States4,308,634,29718.1465
2024US-TotalOther Gases10,845,05564082Total Electric Power IndustryUnited States4,308,634,2970.2517
2024US-TotalOther8,170,14164083Total Electric Power IndustryUnited States4,308,634,2970.1896
2024US-TotalPetroleum15,084,45364084Total Electric Power IndustryUnited States4,308,634,2970.3501
2024US-TotalSolar Thermal and Photovoltaic219,833,91364085Total Electric Power IndustryUnited States4,308,634,2975.1022
2024US-TotalOther Biomass14,857,72464086Total Electric Power IndustryUnited States4,308,634,2970.3448
2024US-TotalWind451,904,35764087Total Electric Power IndustryUnited States4,308,634,29710.4883
2024US-TotalWood and Wood Derived Fuels31,563,94564088Total Electric Power IndustryUnited States4,308,634,2970.7326
2025US-TotalCoal734,928,49266219Total Electric Power IndustryUnited States4,425,028,52616.6084
2025US-TotalGeothermal15,627,50266220Total Electric Power IndustryUnited States4,425,028,5260.3532
2025US-TotalPumped Storage-5,361,95866221Total Electric Power IndustryUnited States4,425,028,526-0.1212
2025US-TotalHydroelectric Conventional241,302,57666222Total Electric Power IndustryUnited States4,425,028,5265.4531
2025US-TotalNatural Gas1,811,003,58066223Total Electric Power IndustryUnited States4,425,028,52640.9264
2025US-TotalNuclear785,304,39266224Total Electric Power IndustryUnited States4,425,028,52617.7469
2025US-TotalOther Gases9,528,16666225Total Electric Power IndustryUnited States4,425,028,5260.2153
2025US-TotalOther6,278,76166226Total Electric Power IndustryUnited States4,425,028,5260.1419
2025US-TotalPetroleum19,244,77166227Total Electric Power IndustryUnited States4,425,028,5260.4349
2025US-TotalSolar Thermal and Photovoltaic300,302,85966228Total Electric Power IndustryUnited States4,425,028,5266.7865
2025US-TotalOther Biomass14,113,65866229Total Electric Power IndustryUnited States4,425,028,5260.3190
2025US-TotalWind461,576,63266230Total Electric Power IndustryUnited States4,425,028,52610.4310
2025US-TotalWood and Wood Derived Fuels31,179,09466231Total Electric Power IndustryUnited States4,425,028,5260.7046

Download the same complete table (CSV)

Separate volume and share ranks for five fuels, all 224 rows

Fuel-specific numeric reporting sets: gas 50, coal 47, nuclear 28, wind 44 and solar 50 state/DC geographies. Each national row is explicitly not ranked. Literal numeric zeros are eligible, omitted source rows are not imputed.

Period: 2025 final observations, released September 2026. Units: Whole signed MWh; percent; descending competition ranks; eligible geography count.

Original sources: EIA state historical generation workbook, source row and columns A:E

Separate volume and share ranks for five fuels; 2025 final observations, released September 2026; Whole signed MWh; percent; descending competition ranks; eligible geography count
statestate namefuelnet generation mwhtotal generation mwhshare pctvolume rank reportedshare rank reportedreporting state count
AKAlaskaNatural Gas3,769,6517,537,73250.0104421350
AKAlaskaCoal789,6447,537,73210.4759372647
AKAlaskaWind123,8127,537,7321.6426393344
AKAlaskaSolar Thermal and Photovoltaic8,0247,537,7320.1065494950
ALAlabamaNatural Gas65,595,154142,994,79545.872471750
ALAlabamaCoal21,661,512142,994,79515.1485122247
ALAlabamaNuclear42,672,668142,994,79529.842161128
ALAlabamaSolar Thermal and Photovoltaic1,323,287142,994,7950.9254314250
ARArkansasNatural Gas23,227,48568,607,24133.8557212950
ARArkansasCoal20,379,59268,607,24129.7047131247
ARArkansasNuclear15,193,05068,607,24122.1450191528
ARArkansasWind176,21368,607,2410.2568383944
ARArkansasSolar Thermal and Photovoltaic4,737,10168,607,2416.9047151950
AZArizonaNatural Gas52,670,485116,470,87645.2220141850
AZArizonaCoal9,218,820116,470,8767.9151282947
AZArizonaNuclear31,321,808116,470,87626.892481228
AZArizonaWind3,149,874116,470,8762.7044222744
AZArizonaSolar Thermal and Photovoltaic15,504,450116,470,87613.31194650
CACaliforniaNatural Gas74,287,239205,105,81436.219052550
CACaliforniaCoal234,247205,105,8140.1142404147
CACaliforniaNuclear17,558,394205,105,8148.5607152628
CACaliforniaWind15,094,716205,105,8147.359582244
CACaliforniaSolar Thermal and Photovoltaic54,887,978205,105,81426.76082250
COColoradoNatural Gas18,137,75556,644,90132.0201263050
COColoradoCoal14,018,34456,644,90124.7478241447
COColoradoWind17,017,08856,644,90130.04176744
COColoradoSolar Thermal and Photovoltaic5,611,79556,644,9019.9070141150
CTConnecticutNatural Gas24,712,28043,773,26656.455219950
CTConnecticutCoal043,773,2660424247
CTConnecticutNuclear16,708,71743,773,26638.171117728
CTConnecticutWind12,25043,773,2660.0280424344
CTConnecticutSolar Thermal and Photovoltaic669,73243,773,2661.5300383950
DCDistrict of ColumbiaNatural Gas111,868198,15956.4537491050
DCDistrict of ColumbiaSolar Thermal and Photovoltaic36,371198,15918.354548350
DEDelawareNatural Gas4,699,8345,461,63486.051840250
DEDelawareCoal252,7165,461,6344.6271383547
DEDelawareWind4,9525,461,6340.0907434044
DEDelawareSolar Thermal and Photovoltaic168,5595,461,6343.0862473050
FLFloridaNatural Gas195,704,978268,262,99672.95272550
FLFloridaCoal10,184,627268,262,9963.7965253647
FLFloridaNuclear30,587,612268,262,99611.402192428
FLFloridaSolar Thermal and Photovoltaic24,915,797268,262,9969.287831350
GAGeorgiaNatural Gas56,264,003145,688,39138.6194112450
GAGeorgiaCoal19,987,318145,688,39113.7192142347
GAGeorgiaNuclear51,224,793145,688,39135.16054828
GAGeorgiaSolar Thermal and Photovoltaic11,186,761145,688,3917.678671750
HIHawaiiWind579,2689,323,1356.2132312344
HIHawaiiSolar Thermal and Photovoltaic952,9329,323,13510.221235950
IAIowaNatural Gas9,123,95274,504,73212.2461344250
IAIowaCoal19,101,69474,504,73225.6382161347
IAIowaWind43,572,98074,504,73258.48352144
IAIowaSolar Thermal and Photovoltaic1,285,66974,504,7321.7256333750
IDIdahoNatural Gas6,364,79820,285,34931.3763373150
IDIdahoCoal020,285,3490424247
IDIdahoWind2,825,41820,285,34913.9284251644
IDIdahoSolar Thermal and Photovoltaic1,627,95620,285,3498.0253261650
ILIllinoisNatural Gas30,735,466191,820,79916.0230173950
ILIllinoisCoal30,891,205191,820,79916.104272147
ILIllinoisNuclear97,670,262191,820,79950.91751328
ILIllinoisWind25,109,430191,820,79913.090051744
ILIllinoisSolar Thermal and Photovoltaic6,679,726191,820,7993.4823102650
INIndianaNatural Gas37,895,428106,896,52735.4506162850
INIndianaCoal49,223,259106,896,52746.04762747
INIndianaWind10,186,258106,896,5279.5291141844
INIndianaSolar Thermal and Photovoltaic6,637,361106,896,5276.2091112050
KSKansasNatural Gas3,560,24761,984,5405.7438434750
KSKansasCoal19,341,91061,984,54031.2044151147
KSKansasNuclear9,269,04061,984,54014.9538252128
KSKansasWind29,220,85261,984,54047.14224344
KSKansasSolar Thermal and Photovoltaic430,29761,984,5400.6942424450
KYKentuckyNatural Gas19,101,47074,373,40725.6832253550
KYKentuckyCoal48,660,31874,373,40765.42703247
KYKentuckySolar Thermal and Photovoltaic1,623,97374,373,4072.1835273450
LALouisianaNatural Gas73,947,001102,391,85172.21966650
LALouisianaCoal5,531,206102,391,8515.4020303347
LALouisianaNuclear15,254,572102,391,85114.8982182228
LALouisianaSolar Thermal and Photovoltaic2,392,193102,391,8512.3363233250
MAMassachusettsNatural Gas17,695,95922,455,56778.804328350
MAMassachusettsCoal022,455,5670424247
MAMassachusettsWind194,00922,455,5670.8640363544
MAMassachusettsSolar Thermal and Photovoltaic2,115,45122,455,5679.4206241250
MDMarylandNatural Gas16,008,68737,605,84642.5697292050
MDMarylandCoal2,293,55837,605,8466.0989353147
MDMarylandNuclear14,795,15037,605,84639.342720528
MDMarylandWind684,99637,605,8461.8215303244
MDMarylandSolar Thermal and Photovoltaic1,289,84537,605,8463.4299322750
MEMaineNatural Gas5,804,68514,843,05539.1071382350
MEMaineCoal31,77714,843,0550.2141414047
MEMaineWind2,916,09514,843,05519.6462241344
MEMaineSolar Thermal and Photovoltaic1,489,07514,843,05510.0321301050
MIMichiganNatural Gas54,286,715128,531,69442.2361132150
MIMichiganCoal29,291,205128,531,69422.789181847
MIMichiganNuclear27,533,963128,531,69421.4219141728
MIMichiganWind10,125,161128,531,6947.8776152144
MIMichiganSolar Thermal and Photovoltaic2,785,776128,531,6942.1674213550
MNMinnesotaNatural Gas11,350,24958,830,39519.2932323850
MNMinnesotaCoal14,153,49558,830,39524.0581231647
MNMinnesotaNuclear13,213,32158,830,39522.4600211428
MNMinnesotaWind14,973,56758,830,39525.452191044
MNMinnesotaSolar Thermal and Photovoltaic2,969,18058,830,3955.0470192350
MOMissouriNatural Gas8,835,61971,526,87512.3529354150
MOMissouriCoal45,993,17771,526,87564.30205347
MOMissouriNuclear7,116,16171,526,8759.9489272528
MOMissouriWind6,483,47671,526,8759.0644191944
MOMissouriSolar Thermal and Photovoltaic1,577,05971,526,8752.2048293350
MSMississippiNatural Gas57,699,27878,429,34873.568510450
MSMississippiCoal4,181,31578,429,3485.3313313447
MSMississippiNuclear11,807,22178,429,34815.0546222028
MSMississippiWind500,17778,429,3480.6377323844
MSMississippiSolar Thermal and Photovoltaic2,881,01078,429,3483.6734202550
MTMontanaNatural Gas1,315,85326,725,2034.9236484850
MTMontanaCoal9,616,55126,725,20335.983126947
MTMontanaWind6,231,94826,725,20323.3186201144
MTMontanaSolar Thermal and Photovoltaic349,74726,725,2031.3087434050
NCNorth CarolinaNatural Gas54,727,032134,695,64240.6301122250
NCNorth CarolinaCoal17,898,860134,695,64213.2884212447
NCNorth CarolinaNuclear43,046,739134,695,64231.95855928
NCNorth CarolinaWind936,254134,695,6420.6951283744
NCNorth CarolinaSolar Thermal and Photovoltaic12,011,706134,695,6428.917761450
NDNorth DakotaNatural Gas2,777,12942,873,3306.4775454550
NDNorth DakotaCoal22,598,04842,873,33052.708911547
NDNorth DakotaWind15,394,89542,873,33035.90797644
NENebraskaNatural Gas1,546,58039,808,3043.8851474950
NENebraskaCoal18,102,00039,808,30445.472918847
NENebraskaNuclear6,921,97939,808,30417.3883281828
NENebraskaWind11,676,80239,808,30429.332613844
NENebraskaSolar Thermal and Photovoltaic265,54139,808,3040.6670444650
NHNew HampshireNatural Gas5,319,19119,112,24627.8313393350
NHNew HampshireCoal239,42819,112,2461.2527393947
NHNew HampshireNuclear10,910,16519,112,24657.084723128
NHNew HampshireWind476,03819,112,2462.4907332844
NHNew HampshireSolar Thermal and Photovoltaic3,29419,112,2460.0172505050
NJNew JerseyNatural Gas30,064,86660,963,38849.3163181450
NJNew JerseyCoal060,963,3880424247
NJNew JerseyNuclear27,917,71860,963,38845.794213428
NJNew JerseyWind20,30960,963,3880.0333414244
NJNew JerseySolar Thermal and Photovoltaic1,592,69560,963,3882.6125283150
NMNew MexicoNatural Gas10,505,40039,439,51326.6367333450
NMNew MexicoCoal8,181,61639,439,51320.7447291947
NMNew MexicoWind14,389,28439,439,51336.484410544
NMNew MexicoSolar Thermal and Photovoltaic6,264,67539,439,51315.884313550
NVNevadaNatural Gas22,876,05545,192,78550.6188231250
NVNevadaCoal2,588,72845,192,7855.7282343247
NVNevadaWind350,63645,192,7850.7759353644
NVNevadaSolar Thermal and Photovoltaic13,913,06245,192,78530.78605150
NYNew YorkNatural Gas63,113,326130,936,04348.201681650
NYNew YorkCoal0130,936,0430424247
NYNew YorkNuclear28,407,580130,936,04321.6958111628
NYNew YorkWind7,068,160130,936,0435.3982182444
NYNew YorkSolar Thermal and Photovoltaic4,276,875130,936,0433.2664162850
OHOhioNatural Gas78,784,996145,331,00254.210741150
OHOhioCoal35,748,049145,331,00224.597761547
OHOhioNuclear17,141,858145,331,00211.7950162328
OHOhioWind2,949,852145,331,0022.0297233044
OHOhioSolar Thermal and Photovoltaic8,020,415145,331,0025.518792250
OKOklahomaNatural Gas39,725,10089,894,62044.1907151950
OKOklahomaCoal9,414,08989,894,62010.4724272747
OKOklahomaWind37,273,07689,894,62041.46313444
OKOklahomaSolar Thermal and Photovoltaic712,38889,894,6200.7925364350
OROregonNatural Gas22,903,80264,282,54535.6299222750
OROregonWind8,965,30964,282,54513.9467161544
OROregonSolar Thermal and Photovoltaic2,682,34964,282,5454.1727222450
PAPennsylvaniaNatural Gas143,124,188245,720,75158.24673750
PAPennsylvaniaCoal17,283,134245,720,7517.0336223047
PAPennsylvaniaNuclear75,049,210245,720,75130.542521028
PAPennsylvaniaWind3,852,325245,720,7511.5678213444
PAPennsylvaniaSolar Thermal and Photovoltaic1,669,135245,720,7510.6793254550
RIRhode IslandNatural Gas8,660,0209,812,01088.259436150
RIRhode IslandCoal09,812,0100424247
RIRhode IslandWind192,4989,812,0101.9619373144
RIRhode IslandSolar Thermal and Photovoltaic695,2719,812,0107.0859371850
SCSouth CarolinaNatural Gas22,658,667103,942,99021.7991243750
SCSouth CarolinaCoal18,177,808103,942,99017.4882172047
SCSouth CarolinaNuclear56,670,524103,942,99054.52083228
SCSouth CarolinaSolar Thermal and Photovoltaic3,226,354103,942,9903.1040182950
SDSouth DakotaNatural Gas2,440,58521,865,72711.1617464350
SDSouth DakotaCoal2,026,13321,865,7279.2662362847
SDSouth DakotaWind12,727,93221,865,72758.209511244
SDSouth DakotaSolar Thermal and Photovoltaic448,84621,865,7272.0527413650
TNTennesseeNatural Gas17,903,13475,446,35323.7296273650
TNTennesseeCoal18,019,35475,446,35323.8837191747
TNTennesseeNuclear29,333,22575,446,35338.879610628
TNTennesseeWind075,446,3530444444
TNTennesseeSolar Thermal and Photovoltaic1,274,85475,446,3531.6897343850
TXTexasNatural Gas290,245,569600,981,98048.295211550
TXTexasCoal68,889,079600,981,98011.462812547
TXTexasNuclear41,840,814600,981,9806.962172828
TXTexasWind130,135,820600,981,98021.653911244
TXTexasSolar Thermal and Photovoltaic66,058,270600,981,98010.99171750
US-TotalUnited StatesNatural Gas1,811,003,5804,425,028,52640.9264Not ranked, U.S. totalNot ranked, U.S. total50
US-TotalUnited StatesCoal734,928,4924,425,028,52616.6084Not ranked, U.S. totalNot ranked, U.S. total47
US-TotalUnited StatesNuclear785,304,3924,425,028,52617.7469Not ranked, U.S. totalNot ranked, U.S. total28
US-TotalUnited StatesWind461,576,6324,425,028,52610.4310Not ranked, U.S. totalNot ranked, U.S. total44
US-TotalUnited StatesSolar Thermal and Photovoltaic300,302,8594,425,028,5266.7865Not ranked, U.S. totalNot ranked, U.S. total50
UTUtahNatural Gas11,518,60938,144,05530.1977313250
UTUtahCoal18,006,77638,144,05547.207320647
UTUtahWind793,70638,144,0552.0808292944
UTUtahSolar Thermal and Photovoltaic6,619,35838,144,05517.353612450
VAVirginiaNatural Gas61,597,185106,388,64257.89839850
VAVirginiaCoal3,606,931106,388,6423.3903323747
VAVirginiaNuclear28,214,205106,388,64226.5199121328
VAVirginiaWind49,933106,388,6420.0469404144
VAVirginiaSolar Thermal and Photovoltaic8,875,449106,388,6428.342581550
VTVermontNatural Gas1,0942,033,0300.0538505050
VTVermontWind384,3152,033,03018.9036341444
VTVermontSolar Thermal and Photovoltaic209,3352,033,03010.296746850
WAWashingtonNatural Gas15,978,166101,670,38215.7157304050
WAWashingtonCoal3,160,338101,670,3823.1084333847
WAWashingtonNuclear7,748,114101,670,3827.6208262728
WAWashingtonWind8,080,924101,670,3827.9482172044
WAWashingtonSolar Thermal and Photovoltaic628,797101,670,3820.6185394750
WIWisconsinNatural Gas23,653,21866,253,08635.7013202650
WIWisconsinCoal23,317,94066,253,08635.1953101047
WIWisconsinNuclear10,175,52966,253,08615.3586241928
WIWisconsinWind1,959,76166,253,0862.9580272644
WIWisconsinSolar Thermal and Photovoltaic3,987,65666,253,0866.0188172150
WVWest VirginiaNatural Gas3,309,94353,389,4556.1996444650
WVWest VirginiaCoal46,271,67253,389,45586.66824147
WVWest VirginiaWind1,991,20553,389,4553.7296262544
WVWest VirginiaSolar Thermal and Photovoltaic233,42953,389,4550.4372454850
WYWyomingNatural Gas4,663,58745,576,51710.2324414450
WYWyomingCoal26,361,01845,576,51757.83909447
WYWyomingWind12,725,05745,576,51727.920212944
WYWyomingSolar Thermal and Photovoltaic495,99745,576,5171.0883404150

Download the same complete table (CSV)

Every reported 2025 fuel row and matched total, all 517 rows

517 numeric source fuel rows across all 52 geographies. No rows are manufactured for omitted fuels. Signed negative values and literal zeros remain. All-source denominator is the producer Total, not the rounded fuel sum.

Period: 2025 final observations, released September 2026. Units: Whole signed MWh; percent; workbook row numbers.

Original sources: EIA state historical generation workbook, source row and columns A:E

Every reported 2025 fuel row and matched total; 2025 final observations, released September 2026; Whole signed MWh; percent; workbook row numbers
yearstatefuelnet generation mwhsource rowproducerstate nametotal generation mwhshare pct
2025AKCoal789,64464421Total Electric Power IndustryAlaska7,537,73210.4759
2025AKHydroelectric Conventional1,772,60764422Total Electric Power IndustryAlaska7,537,73223.5164
2025AKNatural Gas3,769,65164423Total Electric Power IndustryAlaska7,537,73250.0104
2025AKOther-7,75364424Total Electric Power IndustryAlaska7,537,732-0.1029
2025AKPetroleum1,041,27564425Total Electric Power IndustryAlaska7,537,73213.8142
2025AKSolar Thermal and Photovoltaic8,02464426Total Electric Power IndustryAlaska7,537,7320.1065
2025AKOther Biomass40,47364427Total Electric Power IndustryAlaska7,537,7320.5369
2025AKWind123,81264428Total Electric Power IndustryAlaska7,537,7321.6426
2025AKWood and Wood Derived Fuels064429Total Electric Power IndustryAlaska7,537,7320
2025ALCoal21,661,51264459Total Electric Power IndustryAlabama142,994,79515.1485
2025ALHydroelectric Conventional8,582,85664460Total Electric Power IndustryAlabama142,994,7956.0022
2025ALNatural Gas65,595,15464461Total Electric Power IndustryAlabama142,994,79545.8724
2025ALNuclear42,672,66864462Total Electric Power IndustryAlabama142,994,79529.8421
2025ALOther Gases064463Total Electric Power IndustryAlabama142,994,7950
2025ALOther6,52664464Total Electric Power IndustryAlabama142,994,7950.0046
2025ALPetroleum10,44564465Total Electric Power IndustryAlabama142,994,7950.0073
2025ALSolar Thermal and Photovoltaic1,323,28764466Total Electric Power IndustryAlabama142,994,7950.9254
2025ALOther Biomass24,31964467Total Electric Power IndustryAlabama142,994,7950.0170
2025ALWood and Wood Derived Fuels3,118,02864468Total Electric Power IndustryAlabama142,994,7952.1805
2025ARCoal20,379,59264491Total Electric Power IndustryArkansas68,607,24129.7047
2025ARPumped Storage105,39364492Total Electric Power IndustryArkansas68,607,2410.1536
2025ARHydroelectric Conventional3,920,30464493Total Electric Power IndustryArkansas68,607,2415.7141
2025ARNatural Gas23,227,48564494Total Electric Power IndustryArkansas68,607,24133.8557
2025ARNuclear15,193,05064495Total Electric Power IndustryArkansas68,607,24122.1450
2025AROther5,79264496Total Electric Power IndustryArkansas68,607,2410.0084
2025ARPetroleum44,35564497Total Electric Power IndustryArkansas68,607,2410.0647
2025ARSolar Thermal and Photovoltaic4,737,10164498Total Electric Power IndustryArkansas68,607,2416.9047
2025AROther Biomass29,84464499Total Electric Power IndustryArkansas68,607,2410.0435
2025ARWind176,21364500Total Electric Power IndustryArkansas68,607,2410.2568
2025ARWood and Wood Derived Fuels788,11264501Total Electric Power IndustryArkansas68,607,2411.1487
2025AZCoal9,218,82064536Total Electric Power IndustryArizona116,470,8767.9151
2025AZPumped Storage71,39364537Total Electric Power IndustryArizona116,470,8760.0613
2025AZHydroelectric Conventional4,782,57564538Total Electric Power IndustryArizona116,470,8764.1062
2025AZNatural Gas52,670,48564539Total Electric Power IndustryArizona116,470,87645.2220
2025AZNuclear31,321,80864540Total Electric Power IndustryArizona116,470,87626.8924
2025AZOther-512,80864541Total Electric Power IndustryArizona116,470,876-0.4403
2025AZPetroleum40,82064542Total Electric Power IndustryArizona116,470,8760.0350
2025AZSolar Thermal and Photovoltaic15,504,45064543Total Electric Power IndustryArizona116,470,87613.3119
2025AZOther Biomass21,23664544Total Electric Power IndustryArizona116,470,8760.0182
2025AZWind3,149,87464545Total Electric Power IndustryArizona116,470,8762.7044
2025AZWood and Wood Derived Fuels202,22364546Total Electric Power IndustryArizona116,470,8760.1736
2025CACoal234,24764573Total Electric Power IndustryCalifornia205,105,8140.1142
2025CAGeothermal10,898,66764574Total Electric Power IndustryCalifornia205,105,8145.3137
2025CAPumped Storage219,02564575Total Electric Power IndustryCalifornia205,105,8140.1068
2025CAHydroelectric Conventional28,146,48064576Total Electric Power IndustryCalifornia205,105,81413.7229
2025CANatural Gas74,287,23964577Total Electric Power IndustryCalifornia205,105,81436.2190
2025CANuclear17,558,39464578Total Electric Power IndustryCalifornia205,105,8148.5607
2025CAOther Gases1,113,79464579Total Electric Power IndustryCalifornia205,105,8140.5430
2025CAOther-1,694,57364580Total Electric Power IndustryCalifornia205,105,814-0.8262
2025CAPetroleum54,30764581Total Electric Power IndustryCalifornia205,105,8140.0265
2025CASolar Thermal and Photovoltaic54,887,97864582Total Electric Power IndustryCalifornia205,105,81426.7608
2025CAOther Biomass2,243,63364583Total Electric Power IndustryCalifornia205,105,8141.0939
2025CAWind15,094,71664584Total Electric Power IndustryCalifornia205,105,8147.3595
2025CAWood and Wood Derived Fuels2,061,90664585Total Electric Power IndustryCalifornia205,105,8141.0053
2025COCoal14,018,34464635Total Electric Power IndustryColorado56,644,90124.7478
2025COPumped Storage56,78464636Total Electric Power IndustryColorado56,644,9010.1002
2025COHydroelectric Conventional1,725,37564637Total Electric Power IndustryColorado56,644,9013.0459
2025CONatural Gas18,137,75564638Total Electric Power IndustryColorado56,644,90132.0201
2025COOther-9,83264639Total Electric Power IndustryColorado56,644,901-0.0174
2025COPetroleum13,62164640Total Electric Power IndustryColorado56,644,9010.0240
2025COSolar Thermal and Photovoltaic5,611,79564641Total Electric Power IndustryColorado56,644,9019.9070
2025COOther Biomass73,97164642Total Electric Power IndustryColorado56,644,9010.1306
2025COWind17,017,08864643Total Electric Power IndustryColorado56,644,90130.0417
2025COWood and Wood Derived Fuels064644Total Electric Power IndustryColorado56,644,9010
2025CTCoal064681Total Electric Power IndustryConnecticut43,773,2660
2025CTPumped Storage-2,44864682Total Electric Power IndustryConnecticut43,773,266-0.0056
2025CTHydroelectric Conventional295,17364683Total Electric Power IndustryConnecticut43,773,2660.6743
2025CTNatural Gas24,712,28064684Total Electric Power IndustryConnecticut43,773,26656.4552
2025CTNuclear16,708,71764685Total Electric Power IndustryConnecticut43,773,26638.1711
2025CTOther436,89264686Total Electric Power IndustryConnecticut43,773,2660.9981
2025CTPetroleum334,11264687Total Electric Power IndustryConnecticut43,773,2660.7633
2025CTSolar Thermal and Photovoltaic669,73264688Total Electric Power IndustryConnecticut43,773,2661.5300
2025CTOther Biomass363,21564689Total Electric Power IndustryConnecticut43,773,2660.8298
2025CTWind12,25064690Total Electric Power IndustryConnecticut43,773,2660.0280
2025CTWood and Wood Derived Fuels243,34464691Total Electric Power IndustryConnecticut43,773,2660.5559
2025DCNatural Gas111,86864722Total Electric Power IndustryDistrict of Columbia198,15956.4537
2025DCPetroleum77264723Total Electric Power IndustryDistrict of Columbia198,1590.3896
2025DCSolar Thermal and Photovoltaic36,37164724Total Electric Power IndustryDistrict of Columbia198,15918.3545
2025DCOther Biomass49,14864725Total Electric Power IndustryDistrict of Columbia198,15924.8023
2025DECoal252,71664735Total Electric Power IndustryDelaware5,461,6344.6271
2025DENatural Gas4,699,83464736Total Electric Power IndustryDelaware5,461,63486.0518
2025DEOther Gases206,83164737Total Electric Power IndustryDelaware5,461,6343.7870
2025DEPetroleum71,44364738Total Electric Power IndustryDelaware5,461,6341.3081
2025DESolar Thermal and Photovoltaic168,55964739Total Electric Power IndustryDelaware5,461,6343.0862
2025DEOther Biomass57,29964740Total Electric Power IndustryDelaware5,461,6341.0491
2025DEWind4,95264741Total Electric Power IndustryDelaware5,461,6340.0907
2025FLCoal10,184,62764766Total Electric Power IndustryFlorida268,262,9963.7965
2025FLHydroelectric Conventional228,45964767Total Electric Power IndustryFlorida268,262,9960.0852
2025FLNatural Gas195,704,97864768Total Electric Power IndustryFlorida268,262,99672.9527
2025FLNuclear30,587,61264769Total Electric Power IndustryFlorida268,262,99611.4021
2025FLOther Gases2364770Total Electric Power IndustryFlorida268,262,9960.0000
2025FLOther2,154,91964771Total Electric Power IndustryFlorida268,262,9960.8033
2025FLPetroleum1,223,89964772Total Electric Power IndustryFlorida268,262,9960.4562
2025FLSolar Thermal and Photovoltaic24,915,79764773Total Electric Power IndustryFlorida268,262,9969.2878
2025FLOther Biomass1,717,26764774Total Electric Power IndustryFlorida268,262,9960.6401
2025FLWood and Wood Derived Fuels1,545,41464775Total Electric Power IndustryFlorida268,262,9960.5761
2025GACoal19,987,31864814Total Electric Power IndustryGeorgia145,688,39113.7192
2025GAPumped Storage-847,57264815Total Electric Power IndustryGeorgia145,688,391-0.5818
2025GAHydroelectric Conventional2,740,44664816Total Electric Power IndustryGeorgia145,688,3911.8810
2025GANatural Gas56,264,00364817Total Electric Power IndustryGeorgia145,688,39138.6194
2025GANuclear51,224,79364818Total Electric Power IndustryGeorgia145,688,39135.1605
2025GAOther47,20464819Total Electric Power IndustryGeorgia145,688,3910.0324
2025GAPetroleum260,93964820Total Electric Power IndustryGeorgia145,688,3910.1791
2025GASolar Thermal and Photovoltaic11,186,76164821Total Electric Power IndustryGeorgia145,688,3917.6786
2025GAOther Biomass273,58864822Total Electric Power IndustryGeorgia145,688,3910.1878
2025GAWood and Wood Derived Fuels4,550,91364823Total Electric Power IndustryGeorgia145,688,3913.1237
2025HIGeothermal207,92764859Total Electric Power IndustryHawaii9,323,1352.2302
2025HIHydroelectric Conventional70,27964860Total Electric Power IndustryHawaii9,323,1350.7538
2025HIOther Gases064861Total Electric Power IndustryHawaii9,323,1350
2025HIOther320,01864862Total Electric Power IndustryHawaii9,323,1353.4325
2025HIPetroleum6,978,74064863Total Electric Power IndustryHawaii9,323,13574.8540
2025HISolar Thermal and Photovoltaic952,93264864Total Electric Power IndustryHawaii9,323,13510.2212
2025HIOther Biomass213,97064865Total Electric Power IndustryHawaii9,323,1352.2950
2025HIWind579,26864866Total Electric Power IndustryHawaii9,323,1356.2132
2025HIWood and Wood Derived Fuels064867Total Electric Power IndustryHawaii9,323,1350
2025IACoal19,101,69464895Total Electric Power IndustryIowa74,504,73225.6382
2025IAHydroelectric Conventional1,149,74264896Total Electric Power IndustryIowa74,504,7321.5432
2025IANatural Gas9,123,95264897Total Electric Power IndustryIowa74,504,73212.2461
2025IAOther-59264898Total Electric Power IndustryIowa74,504,732-0.0008
2025IAPetroleum69,06864899Total Electric Power IndustryIowa74,504,7320.0927
2025IASolar Thermal and Photovoltaic1,285,66964900Total Electric Power IndustryIowa74,504,7321.7256
2025IAOther Biomass202,21964901Total Electric Power IndustryIowa74,504,7320.2714
2025IAWind43,572,98064902Total Electric Power IndustryIowa74,504,73258.4835
2025IAWood and Wood Derived Fuels064903Total Electric Power IndustryIowa74,504,7320
2025IDCoal064939Total Electric Power IndustryIdaho20,285,3490
2025IDGeothermal88,14164940Total Electric Power IndustryIdaho20,285,3490.4345
2025IDHydroelectric Conventional8,850,66564941Total Electric Power IndustryIdaho20,285,34943.6308
2025IDNatural Gas6,364,79864942Total Electric Power IndustryIdaho20,285,34931.3763
2025IDOther25,88164943Total Electric Power IndustryIdaho20,285,3490.1276
2025IDPetroleum17164944Total Electric Power IndustryIdaho20,285,3490.0008
2025IDSolar Thermal and Photovoltaic1,627,95664945Total Electric Power IndustryIdaho20,285,3498.0253
2025IDOther Biomass94,18364946Total Electric Power IndustryIdaho20,285,3490.4643
2025IDWind2,825,41864947Total Electric Power IndustryIdaho20,285,34913.9284
2025IDWood and Wood Derived Fuels408,13764948Total Electric Power IndustryIdaho20,285,3492.0120
2025ILCoal30,891,20564980Total Electric Power IndustryIllinois191,820,79916.1042
2025ILHydroelectric Conventional99,23164981Total Electric Power IndustryIllinois191,820,7990.0517
2025ILNatural Gas30,735,46664982Total Electric Power IndustryIllinois191,820,79916.0230
2025ILNuclear97,670,26264983Total Electric Power IndustryIllinois191,820,79950.9175
2025ILOther Gases185,26464984Total Electric Power IndustryIllinois191,820,7990.0966
2025ILOther209,62264985Total Electric Power IndustryIllinois191,820,7990.1093
2025ILPetroleum34,23364986Total Electric Power IndustryIllinois191,820,7990.0178
2025ILSolar Thermal and Photovoltaic6,679,72664987Total Electric Power IndustryIllinois191,820,7993.4823
2025ILOther Biomass206,36064988Total Electric Power IndustryIllinois191,820,7990.1076
2025ILWind25,109,43064989Total Electric Power IndustryIllinois191,820,79913.0900
2025ILWood and Wood Derived Fuels064990Total Electric Power IndustryIllinois191,820,7990
2025INCoal49,223,25965030Total Electric Power IndustryIndiana106,896,52746.0476
2025INHydroelectric Conventional304,99865031Total Electric Power IndustryIndiana106,896,5270.2853
2025INNatural Gas37,895,42865032Total Electric Power IndustryIndiana106,896,52735.4506
2025INOther Gases1,955,89665033Total Electric Power IndustryIndiana106,896,5271.8297
2025INOther390,37865034Total Electric Power IndustryIndiana106,896,5270.3652
2025INPetroleum130,04665035Total Electric Power IndustryIndiana106,896,5270.1217
2025INSolar Thermal and Photovoltaic6,637,36165036Total Electric Power IndustryIndiana106,896,5276.2091
2025INOther Biomass172,90465037Total Electric Power IndustryIndiana106,896,5270.1617
2025INWind10,186,25865038Total Electric Power IndustryIndiana106,896,5279.5291
2025KSCoal19,341,91065074Total Electric Power IndustryKansas61,984,54031.2044
2025KSHydroelectric Conventional23,33065075Total Electric Power IndustryKansas61,984,5400.0376
2025KSNatural Gas3,560,24765076Total Electric Power IndustryKansas61,984,5405.7438
2025KSNuclear9,269,04065077Total Electric Power IndustryKansas61,984,54014.9538
2025KSOther4,99065078Total Electric Power IndustryKansas61,984,5400.0080
2025KSPetroleum74,86565079Total Electric Power IndustryKansas61,984,5400.1208
2025KSSolar Thermal and Photovoltaic430,29765080Total Electric Power IndustryKansas61,984,5400.6942
2025KSOther Biomass59,01065081Total Electric Power IndustryKansas61,984,5400.0952
2025KSWind29,220,85265082Total Electric Power IndustryKansas61,984,54047.1422
2025KYCoal48,660,31865102Total Electric Power IndustryKentucky74,373,40765.4270
2025KYHydroelectric Conventional4,441,15765103Total Electric Power IndustryKentucky74,373,4075.9714
2025KYNatural Gas19,101,47065104Total Electric Power IndustryKentucky74,373,40725.6832
2025KYOther33,49365105Total Electric Power IndustryKentucky74,373,4070.0450
2025KYPetroleum76,83965106Total Electric Power IndustryKentucky74,373,4070.1033
2025KYSolar Thermal and Photovoltaic1,623,97365107Total Electric Power IndustryKentucky74,373,4072.1835
2025KYOther Biomass90,94365108Total Electric Power IndustryKentucky74,373,4070.1223
2025KYWood and Wood Derived Fuels345,21465109Total Electric Power IndustryKentucky74,373,4070.4642
2025LACoal5,531,20665130Total Electric Power IndustryLouisiana102,391,8515.4020
2025LAHydroelectric Conventional989,48765131Total Electric Power IndustryLouisiana102,391,8510.9664
2025LANatural Gas73,947,00165132Total Electric Power IndustryLouisiana102,391,85172.2196
2025LANuclear15,254,57265133Total Electric Power IndustryLouisiana102,391,85114.8982
2025LAOther Gases1,362,18165134Total Electric Power IndustryLouisiana102,391,8511.3304
2025LAOther595,61065135Total Electric Power IndustryLouisiana102,391,8510.5817
2025LAPetroleum451,46365136Total Electric Power IndustryLouisiana102,391,8510.4409
2025LASolar Thermal and Photovoltaic2,392,19365137Total Electric Power IndustryLouisiana102,391,8512.3363
2025LAOther Biomass83,24565138Total Electric Power IndustryLouisiana102,391,8510.0813
2025LAWood and Wood Derived Fuels1,784,89565139Total Electric Power IndustryLouisiana102,391,8511.7432
2025MACoal065166Total Electric Power IndustryMassachusetts22,455,5670
2025MAPumped Storage-439,00665167Total Electric Power IndustryMassachusetts22,455,567-1.9550
2025MAHydroelectric Conventional764,84965168Total Electric Power IndustryMassachusetts22,455,5673.4061
2025MANatural Gas17,695,95965169Total Electric Power IndustryMassachusetts22,455,56778.8043
2025MAOther825,81665170Total Electric Power IndustryMassachusetts22,455,5673.6776
2025MAPetroleum430,14365171Total Electric Power IndustryMassachusetts22,455,5671.9155
2025MASolar Thermal and Photovoltaic2,115,45165172Total Electric Power IndustryMassachusetts22,455,5679.4206
2025MAOther Biomass790,73265173Total Electric Power IndustryMassachusetts22,455,5673.5213
2025MAWind194,00965174Total Electric Power IndustryMassachusetts22,455,5670.8640
2025MAWood and Wood Derived Fuels77,61465175Total Electric Power IndustryMassachusetts22,455,5670.3456
2025MDCoal2,293,55865211Total Electric Power IndustryMaryland37,605,8466.0989
2025MDHydroelectric Conventional1,563,34665212Total Electric Power IndustryMaryland37,605,8464.1572
2025MDNatural Gas16,008,68765213Total Electric Power IndustryMaryland37,605,84642.5697
2025MDNuclear14,795,15065214Total Electric Power IndustryMaryland37,605,84639.3427
2025MDOther298,69165215Total Electric Power IndustryMaryland37,605,8460.7943
2025MDPetroleum371,81165216Total Electric Power IndustryMaryland37,605,8460.9887
2025MDSolar Thermal and Photovoltaic1,289,84565217Total Electric Power IndustryMaryland37,605,8463.4299
2025MDOther Biomass299,76165218Total Electric Power IndustryMaryland37,605,8460.7971
2025MDWind684,99665219Total Electric Power IndustryMaryland37,605,8461.8215
2025MDWood and Wood Derived Fuels065220Total Electric Power IndustryMaryland37,605,8460
2025MECoal31,77765253Total Electric Power IndustryMaine14,843,0550.2141
2025MEHydroelectric Conventional2,548,65465254Total Electric Power IndustryMaine14,843,05517.1707
2025MENatural Gas5,804,68565255Total Electric Power IndustryMaine14,843,05539.1071
2025MEOther260,86465256Total Electric Power IndustryMaine14,843,0551.7575
2025MEPetroleum166,84865257Total Electric Power IndustryMaine14,843,0551.1241
2025MESolar Thermal and Photovoltaic1,489,07565258Total Electric Power IndustryMaine14,843,05510.0321
2025MEOther Biomass73,71965259Total Electric Power IndustryMaine14,843,0550.4967
2025MEWind2,916,09565260Total Electric Power IndustryMaine14,843,05519.6462
2025MEWood and Wood Derived Fuels1,551,33765261Total Electric Power IndustryMaine14,843,05510.4516
2025MICoal29,291,20565295Total Electric Power IndustryMichigan128,531,69422.7891
2025MIPumped Storage-637,52365296Total Electric Power IndustryMichigan128,531,694-0.4960
2025MIHydroelectric Conventional1,285,68465297Total Electric Power IndustryMichigan128,531,6941.0003
2025MINatural Gas54,286,71565298Total Electric Power IndustryMichigan128,531,69442.2361
2025MINuclear27,533,96365299Total Electric Power IndustryMichigan128,531,69421.4219
2025MIOther Gases97,90765300Total Electric Power IndustryMichigan128,531,6940.0762
2025MIOther60,32565301Total Electric Power IndustryMichigan128,531,6940.0469
2025MIPetroleum1,734,44565302Total Electric Power IndustryMichigan128,531,6941.3494
2025MISolar Thermal and Photovoltaic2,785,77665303Total Electric Power IndustryMichigan128,531,6942.1674
2025MIOther Biomass649,12165304Total Electric Power IndustryMichigan128,531,6940.5050
2025MIWind10,125,16165305Total Electric Power IndustryMichigan128,531,6947.8776
2025MIWood and Wood Derived Fuels1,318,91665306Total Electric Power IndustryMichigan128,531,6941.0261
2025MNCoal14,153,49565351Total Electric Power IndustryMinnesota58,830,39524.0581
2025MNHydroelectric Conventional774,71565352Total Electric Power IndustryMinnesota58,830,3951.3169
2025MNNatural Gas11,350,24965353Total Electric Power IndustryMinnesota58,830,39519.2932
2025MNNuclear13,213,32165354Total Electric Power IndustryMinnesota58,830,39522.4600
2025MNOther287,88265355Total Electric Power IndustryMinnesota58,830,3950.4893
2025MNPetroleum22,74365356Total Electric Power IndustryMinnesota58,830,3950.0387
2025MNSolar Thermal and Photovoltaic2,969,18065357Total Electric Power IndustryMinnesota58,830,3955.0470
2025MNOther Biomass273,53265358Total Electric Power IndustryMinnesota58,830,3950.4650
2025MNWind14,973,56765359Total Electric Power IndustryMinnesota58,830,39525.4521
2025MNWood and Wood Derived Fuels811,71065360Total Electric Power IndustryMinnesota58,830,3951.3797
2025MOCoal45,993,17765404Total Electric Power IndustryMissouri71,526,87564.3020
2025MOPumped Storage119,29165405Total Electric Power IndustryMissouri71,526,8750.1668
2025MOHydroelectric Conventional1,170,10065406Total Electric Power IndustryMissouri71,526,8751.6359
2025MONatural Gas8,835,61965407Total Electric Power IndustryMissouri71,526,87512.3529
2025MONuclear7,116,16165408Total Electric Power IndustryMissouri71,526,8759.9489
2025MOOther065409Total Electric Power IndustryMissouri71,526,8750
2025MOPetroleum133,56565410Total Electric Power IndustryMissouri71,526,8750.1867
2025MOSolar Thermal and Photovoltaic1,577,05965411Total Electric Power IndustryMissouri71,526,8752.2048
2025MOOther Biomass55,29765412Total Electric Power IndustryMissouri71,526,8750.0773
2025MOWind6,483,47665413Total Electric Power IndustryMissouri71,526,8759.0644
2025MOWood and Wood Derived Fuels43,13065414Total Electric Power IndustryMissouri71,526,8750.0603
2025MSCoal4,181,31565447Total Electric Power IndustryMississippi78,429,3485.3313
2025MSNatural Gas57,699,27865448Total Electric Power IndustryMississippi78,429,34873.5685
2025MSNuclear11,807,22165449Total Electric Power IndustryMississippi78,429,34815.0546
2025MSOther-12,88265450Total Electric Power IndustryMississippi78,429,348-0.0164
2025MSPetroleum10,57765451Total Electric Power IndustryMississippi78,429,3480.0135
2025MSSolar Thermal and Photovoltaic2,881,01065452Total Electric Power IndustryMississippi78,429,3483.6734
2025MSOther Biomass4,98365453Total Electric Power IndustryMississippi78,429,3480.0064
2025MSWind500,17765454Total Electric Power IndustryMississippi78,429,3480.6377
2025MSWood and Wood Derived Fuels1,357,66965455Total Electric Power IndustryMississippi78,429,3481.7311
2025MTCoal9,616,55165480Total Electric Power IndustryMontana26,725,20335.9831
2025MTHydroelectric Conventional8,441,04865481Total Electric Power IndustryMontana26,725,20331.5846
2025MTNatural Gas1,315,85365482Total Electric Power IndustryMontana26,725,2034.9236
2025MTOther Gases2,91565483Total Electric Power IndustryMontana26,725,2030.0109
2025MTOther261,00765484Total Electric Power IndustryMontana26,725,2030.9766
2025MTPetroleum468,03365485Total Electric Power IndustryMontana26,725,2031.7513
2025MTSolar Thermal and Photovoltaic349,74765486Total Electric Power IndustryMontana26,725,2031.3087
2025MTOther Biomass17,14065487Total Electric Power IndustryMontana26,725,2030.0641
2025MTWind6,231,94865488Total Electric Power IndustryMontana26,725,20323.3186
2025MTWood and Wood Derived Fuels20,96165489Total Electric Power IndustryMontana26,725,2030.0784
2025NCCoal17,898,86065516Total Electric Power IndustryNorth Carolina134,695,64213.2884
2025NCPumped Storage065517Total Electric Power IndustryNorth Carolina134,695,6420
2025NCHydroelectric Conventional4,153,18365518Total Electric Power IndustryNorth Carolina134,695,6423.0834
2025NCNatural Gas54,727,03265519Total Electric Power IndustryNorth Carolina134,695,64240.6301
2025NCNuclear43,046,73965520Total Electric Power IndustryNorth Carolina134,695,64231.9585
2025NCOther194,99865521Total Electric Power IndustryNorth Carolina134,695,6420.1448
2025NCPetroleum250,77265522Total Electric Power IndustryNorth Carolina134,695,6420.1862
2025NCSolar Thermal and Photovoltaic12,011,70665523Total Electric Power IndustryNorth Carolina134,695,6428.9177
2025NCOther Biomass349,64465524Total Electric Power IndustryNorth Carolina134,695,6420.2596
2025NCWind936,25465525Total Electric Power IndustryNorth Carolina134,695,6420.6951
2025NCWood and Wood Derived Fuels1,126,45465526Total Electric Power IndustryNorth Carolina134,695,6420.8363
2025NDCoal22,598,04865565Total Electric Power IndustryNorth Dakota42,873,33052.7089
2025NDHydroelectric Conventional2,004,51165566Total Electric Power IndustryNorth Dakota42,873,3304.6754
2025NDNatural Gas2,777,12965567Total Electric Power IndustryNorth Dakota42,873,3306.4775
2025NDOther Gases34,85265568Total Electric Power IndustryNorth Dakota42,873,3300.0813
2025NDOther32,34365569Total Electric Power IndustryNorth Dakota42,873,3300.0754
2025NDPetroleum31,55265570Total Electric Power IndustryNorth Dakota42,873,3300.0736
2025NDOther Biomass065571Total Electric Power IndustryNorth Dakota42,873,3300
2025NDWind15,394,89565572Total Electric Power IndustryNorth Dakota42,873,33035.9079
2025NECoal18,102,00065591Total Electric Power IndustryNebraska39,808,30445.4729
2025NEHydroelectric Conventional1,151,44065592Total Electric Power IndustryNebraska39,808,3042.8925
2025NENatural Gas1,546,58065593Total Electric Power IndustryNebraska39,808,3043.8851
2025NENuclear6,921,97965594Total Electric Power IndustryNebraska39,808,30417.3883
2025NEOther-22765595Total Electric Power IndustryNebraska39,808,304-0.0006
2025NEPetroleum76,10965596Total Electric Power IndustryNebraska39,808,3040.1912
2025NESolar Thermal and Photovoltaic265,54165597Total Electric Power IndustryNebraska39,808,3040.6670
2025NEOther Biomass68,07965598Total Electric Power IndustryNebraska39,808,3040.1710
2025NEWind11,676,80265599Total Electric Power IndustryNebraska39,808,30429.3326
2025NEWood and Wood Derived Fuels065600Total Electric Power IndustryNebraska39,808,3040
2025NHCoal239,42865625Total Electric Power IndustryNew Hampshire19,112,2461.2527
2025NHHydroelectric Conventional1,097,98365626Total Electric Power IndustryNew Hampshire19,112,2465.7449
2025NHNatural Gas5,319,19165627Total Electric Power IndustryNew Hampshire19,112,24627.8313
2025NHNuclear10,910,16565628Total Electric Power IndustryNew Hampshire19,112,24657.0847
2025NHOther50,41165629Total Electric Power IndustryNew Hampshire19,112,2460.2638
2025NHPetroleum179,89965630Total Electric Power IndustryNew Hampshire19,112,2460.9413
2025NHSolar Thermal and Photovoltaic3,29465631Total Electric Power IndustryNew Hampshire19,112,2460.0172
2025NHOther Biomass132,58165632Total Electric Power IndustryNew Hampshire19,112,2460.6937
2025NHWind476,03865633Total Electric Power IndustryNew Hampshire19,112,2462.4907
2025NHWood and Wood Derived Fuels703,25565634Total Electric Power IndustryNew Hampshire19,112,2463.6796
2025NJCoal065656Total Electric Power IndustryNew Jersey60,963,3880
2025NJPumped Storage-235,28765657Total Electric Power IndustryNew Jersey60,963,388-0.3859
2025NJHydroelectric Conventional6,34265658Total Electric Power IndustryNew Jersey60,963,3880.0104
2025NJNatural Gas30,064,86665659Total Electric Power IndustryNew Jersey60,963,38849.3163
2025NJNuclear27,917,71865660Total Electric Power IndustryNew Jersey60,963,38845.7942
2025NJOther Gases209,72765661Total Electric Power IndustryNew Jersey60,963,3880.3440
2025NJOther611,90765662Total Electric Power IndustryNew Jersey60,963,3881.0037
2025NJPetroleum165,08465663Total Electric Power IndustryNew Jersey60,963,3880.2708
2025NJSolar Thermal and Photovoltaic1,592,69565664Total Electric Power IndustryNew Jersey60,963,3882.6125
2025NJOther Biomass610,02965665Total Electric Power IndustryNew Jersey60,963,3881.0006
2025NJWind20,30965666Total Electric Power IndustryNew Jersey60,963,3880.0333
2025NMCoal8,181,61665702Total Electric Power IndustryNew Mexico39,439,51320.7447
2025NMGeothermal58,11365703Total Electric Power IndustryNew Mexico39,439,5130.1473
2025NMHydroelectric Conventional125,04965704Total Electric Power IndustryNew Mexico39,439,5130.3171
2025NMNatural Gas10,505,40065705Total Electric Power IndustryNew Mexico39,439,51326.6367
2025NMOther-100,02465706Total Electric Power IndustryNew Mexico39,439,513-0.2536
2025NMPetroleum42365707Total Electric Power IndustryNew Mexico39,439,5130.0011
2025NMSolar Thermal and Photovoltaic6,264,67565708Total Electric Power IndustryNew Mexico39,439,51315.8843
2025NMOther Biomass14,97665709Total Electric Power IndustryNew Mexico39,439,5130.0380
2025NMWind14,389,28465710Total Electric Power IndustryNew Mexico39,439,51336.4844
2025NVCoal2,588,72865738Total Electric Power IndustryNevada45,192,7855.7282
2025NVGeothermal3,752,70765739Total Electric Power IndustryNevada45,192,7858.3038
2025NVHydroelectric Conventional1,880,94765740Total Electric Power IndustryNevada45,192,7854.1621
2025NVNatural Gas22,876,05565741Total Electric Power IndustryNevada45,192,78550.6188
2025NVOther Gases065742Total Electric Power IndustryNevada45,192,7850
2025NVOther-227,37465743Total Electric Power IndustryNevada45,192,785-0.5031
2025NVPetroleum7,31865744Total Electric Power IndustryNevada45,192,7850.0162
2025NVSolar Thermal and Photovoltaic13,913,06265745Total Electric Power IndustryNevada45,192,78530.7860
2025NVOther Biomass50,70665746Total Electric Power IndustryNevada45,192,7850.1122
2025NVWind350,63665747Total Electric Power IndustryNevada45,192,7850.7759
2025NYCoal065776Total Electric Power IndustryNew York130,936,0430
2025NYPumped Storage-490,04765777Total Electric Power IndustryNew York130,936,043-0.3743
2025NYHydroelectric Conventional24,935,14165778Total Electric Power IndustryNew York130,936,04319.0438
2025NYNatural Gas63,113,32665779Total Electric Power IndustryNew York130,936,04348.2016
2025NYNuclear28,407,58065780Total Electric Power IndustryNew York130,936,04321.6958
2025NYOther Gases065781Total Electric Power IndustryNew York130,936,0430
2025NYOther923,95465782Total Electric Power IndustryNew York130,936,0430.7057
2025NYPetroleum1,231,20665783Total Electric Power IndustryNew York130,936,0430.9403
2025NYSolar Thermal and Photovoltaic4,276,87565784Total Electric Power IndustryNew York130,936,0433.2664
2025NYOther Biomass1,320,61365785Total Electric Power IndustryNew York130,936,0431.0086
2025NYWind7,068,16065786Total Electric Power IndustryNew York130,936,0435.3982
2025NYWood and Wood Derived Fuels149,23565787Total Electric Power IndustryNew York130,936,0430.1140
2025OHCoal35,748,04965832Total Electric Power IndustryOhio145,331,00224.5977
2025OHHydroelectric Conventional482,81065833Total Electric Power IndustryOhio145,331,0020.3322
2025OHNatural Gas78,784,99665834Total Electric Power IndustryOhio145,331,00254.2107
2025OHNuclear17,141,85865835Total Electric Power IndustryOhio145,331,00211.7950
2025OHOther Gases756,30665836Total Electric Power IndustryOhio145,331,0020.5204
2025OHOther-1,86265837Total Electric Power IndustryOhio145,331,002-0.0013
2025OHPetroleum1,162,11065838Total Electric Power IndustryOhio145,331,0020.7996
2025OHSolar Thermal and Photovoltaic8,020,41565839Total Electric Power IndustryOhio145,331,0025.5187
2025OHOther Biomass142,42065840Total Electric Power IndustryOhio145,331,0020.0980
2025OHWind2,949,85265841Total Electric Power IndustryOhio145,331,0022.0297
2025OHWood and Wood Derived Fuels144,04865842Total Electric Power IndustryOhio145,331,0020.0991
2025OKCoal9,414,08965886Total Electric Power IndustryOklahoma89,894,62010.4724
2025OKPumped Storage-33,75265887Total Electric Power IndustryOklahoma89,894,620-0.0375
2025OKHydroelectric Conventional2,455,64565888Total Electric Power IndustryOklahoma89,894,6202.7317
2025OKNatural Gas39,725,10065889Total Electric Power IndustryOklahoma89,894,62044.1907
2025OKOther-1,58065890Total Electric Power IndustryOklahoma89,894,620-0.0018
2025OKPetroleum34,91265891Total Electric Power IndustryOklahoma89,894,6200.0388
2025OKSolar Thermal and Photovoltaic712,38865892Total Electric Power IndustryOklahoma89,894,6200.7925
2025OKOther Biomass76,95565893Total Electric Power IndustryOklahoma89,894,6200.0856
2025OKWind37,273,07665894Total Electric Power IndustryOklahoma89,894,62041.4631
2025OKWood and Wood Derived Fuels237,78865895Total Electric Power IndustryOklahoma89,894,6200.2645
2025ORGeothermal152,26765924Total Electric Power IndustryOregon64,282,5450.2369
2025ORHydroelectric Conventional28,706,26065925Total Electric Power IndustryOregon64,282,54544.6564
2025ORNatural Gas22,903,80265926Total Electric Power IndustryOregon64,282,54535.6299
2025OROther-69,64665927Total Electric Power IndustryOregon64,282,545-0.1083
2025ORPetroleum15765928Total Electric Power IndustryOregon64,282,5450.0002
2025ORSolar Thermal and Photovoltaic2,682,34965929Total Electric Power IndustryOregon64,282,5454.1727
2025OROther Biomass179,79765930Total Electric Power IndustryOregon64,282,5450.2797
2025ORWind8,965,30965931Total Electric Power IndustryOregon64,282,54513.9467
2025ORWood and Wood Derived Fuels762,25065932Total Electric Power IndustryOregon64,282,5451.1858
2025PACoal17,283,13465966Total Electric Power IndustryPennsylvania245,720,7517.0336
2025PAPumped Storage-943,94565967Total Electric Power IndustryPennsylvania245,720,751-0.3842
2025PAHydroelectric Conventional2,532,69865968Total Electric Power IndustryPennsylvania245,720,7511.0307
2025PANatural Gas143,124,18865969Total Electric Power IndustryPennsylvania245,720,75158.2467
2025PANuclear75,049,21065970Total Electric Power IndustryPennsylvania245,720,75130.5425
2025PAOther Gases588,15565971Total Electric Power IndustryPennsylvania245,720,7510.2394
2025PAOther824,03765972Total Electric Power IndustryPennsylvania245,720,7510.3354
2025PAPetroleum294,32465973Total Electric Power IndustryPennsylvania245,720,7510.1198
2025PASolar Thermal and Photovoltaic1,669,13565974Total Electric Power IndustryPennsylvania245,720,7510.6793
2025PAOther Biomass1,166,00365975Total Electric Power IndustryPennsylvania245,720,7510.4745
2025PAWind3,852,32565976Total Electric Power IndustryPennsylvania245,720,7511.5678
2025PAWood and Wood Derived Fuels281,48665977Total Electric Power IndustryPennsylvania245,720,7510.1146
2025RICoal066019Total Electric Power IndustryRhode Island9,812,0100
2025RIHydroelectric Conventional10,32466020Total Electric Power IndustryRhode Island9,812,0100.1052
2025RINatural Gas8,660,02066021Total Electric Power IndustryRhode Island9,812,01088.2594
2025RIOther-33666022Total Electric Power IndustryRhode Island9,812,010-0.0034
2025RIPetroleum68,93066023Total Electric Power IndustryRhode Island9,812,0100.7025
2025RISolar Thermal and Photovoltaic695,27166024Total Electric Power IndustryRhode Island9,812,0107.0859
2025RIOther Biomass185,30366025Total Electric Power IndustryRhode Island9,812,0101.8885
2025RIWind192,49866026Total Electric Power IndustryRhode Island9,812,0101.9619
2025SCCoal18,177,80866046Total Electric Power IndustrySouth Carolina103,942,99017.4882
2025SCPumped Storage-283,33866047Total Electric Power IndustrySouth Carolina103,942,990-0.2726
2025SCHydroelectric Conventional1,782,57966048Total Electric Power IndustrySouth Carolina103,942,9901.7150
2025SCNatural Gas22,658,66766049Total Electric Power IndustrySouth Carolina103,942,99021.7991
2025SCNuclear56,670,52466050Total Electric Power IndustrySouth Carolina103,942,99054.5208
2025SCOther5,22766051Total Electric Power IndustrySouth Carolina103,942,9900.0050
2025SCPetroleum115,98966052Total Electric Power IndustrySouth Carolina103,942,9900.1116
2025SCSolar Thermal and Photovoltaic3,226,35466053Total Electric Power IndustrySouth Carolina103,942,9903.1040
2025SCOther Biomass61,82866054Total Electric Power IndustrySouth Carolina103,942,9900.0595
2025SCWood and Wood Derived Fuels1,527,35166055Total Electric Power IndustrySouth Carolina103,942,9901.4694
2025SDCoal2,026,13366090Total Electric Power IndustrySouth Dakota21,865,7279.2662
2025SDHydroelectric Conventional4,194,37466091Total Electric Power IndustrySouth Dakota21,865,72719.1824
2025SDNatural Gas2,440,58566092Total Electric Power IndustrySouth Dakota21,865,72711.1617
2025SDOther Gases066093Total Electric Power IndustrySouth Dakota21,865,7270
2025SDOther066094Total Electric Power IndustrySouth Dakota21,865,7270
2025SDPetroleum7,39866095Total Electric Power IndustrySouth Dakota21,865,7270.0338
2025SDSolar Thermal and Photovoltaic448,84666096Total Electric Power IndustrySouth Dakota21,865,7272.0527
2025SDOther Biomass1,03866097Total Electric Power IndustrySouth Dakota21,865,7270.0047
2025SDWind12,727,93266098Total Electric Power IndustrySouth Dakota21,865,72758.2095
2025SDWood and Wood Derived Fuels19,42166099Total Electric Power IndustrySouth Dakota21,865,7270.0888
2025TNCoal18,019,35466123Total Electric Power IndustryTennessee75,446,35323.8837
2025TNPumped Storage-537,50566124Total Electric Power IndustryTennessee75,446,353-0.7124
2025TNHydroelectric Conventional8,839,98866125Total Electric Power IndustryTennessee75,446,35311.7169
2025TNNatural Gas17,903,13466126Total Electric Power IndustryTennessee75,446,35323.7296
2025TNNuclear29,333,22566127Total Electric Power IndustryTennessee75,446,35338.8796
2025TNOther Gases10,28866128Total Electric Power IndustryTennessee75,446,3530.0136
2025TNOther21066129Total Electric Power IndustryTennessee75,446,3530.0003
2025TNPetroleum127,00066130Total Electric Power IndustryTennessee75,446,3530.1683
2025TNSolar Thermal and Photovoltaic1,274,85466131Total Electric Power IndustryTennessee75,446,3531.6897
2025TNOther Biomass92,64066132Total Electric Power IndustryTennessee75,446,3530.1228
2025TNWind066133Total Electric Power IndustryTennessee75,446,3530
2025TNWood and Wood Derived Fuels383,16666134Total Electric Power IndustryTennessee75,446,3530.5079
2025TXCoal68,889,07966166Total Electric Power IndustryTexas600,981,98011.4628
2025TXHydroelectric Conventional884,88966167Total Electric Power IndustryTexas600,981,9800.1472
2025TXNatural Gas290,245,56966168Total Electric Power IndustryTexas600,981,98048.2952
2025TXNuclear41,840,81466169Total Electric Power IndustryTexas600,981,9806.9621
2025TXOther Gases2,361,84166170Total Electric Power IndustryTexas600,981,9800.3930
2025TXOther-717,15766171Total Electric Power IndustryTexas600,981,980-0.1193
2025TXPetroleum244,67366172Total Electric Power IndustryTexas600,981,9800.0407
2025TXSolar Thermal and Photovoltaic66,058,27066173Total Electric Power IndustryTexas600,981,98010.9917
2025TXOther Biomass139,03166174Total Electric Power IndustryTexas600,981,9800.0231
2025TXWind130,135,82066175Total Electric Power IndustryTexas600,981,98021.6539
2025TXWood and Wood Derived Fuels899,14966176Total Electric Power IndustryTexas600,981,9800.1496
2025US-TotalCoal734,928,49266219Total Electric Power IndustryUnited States4,425,028,52616.6084
2025US-TotalGeothermal15,627,50266220Total Electric Power IndustryUnited States4,425,028,5260.3532
2025US-TotalPumped Storage-5,361,95866221Total Electric Power IndustryUnited States4,425,028,526-0.1212
2025US-TotalHydroelectric Conventional241,302,57666222Total Electric Power IndustryUnited States4,425,028,5265.4531
2025US-TotalNatural Gas1,811,003,58066223Total Electric Power IndustryUnited States4,425,028,52640.9264
2025US-TotalNuclear785,304,39266224Total Electric Power IndustryUnited States4,425,028,52617.7469
2025US-TotalOther Gases9,528,16666225Total Electric Power IndustryUnited States4,425,028,5260.2153
2025US-TotalOther6,278,76166226Total Electric Power IndustryUnited States4,425,028,5260.1419
2025US-TotalPetroleum19,244,77166227Total Electric Power IndustryUnited States4,425,028,5260.4349
2025US-TotalSolar Thermal and Photovoltaic300,302,85966228Total Electric Power IndustryUnited States4,425,028,5266.7865
2025US-TotalOther Biomass14,113,65866229Total Electric Power IndustryUnited States4,425,028,5260.3190
2025US-TotalWind461,576,63266230Total Electric Power IndustryUnited States4,425,028,52610.4310
2025US-TotalWood and Wood Derived Fuels31,179,09466231Total Electric Power IndustryUnited States4,425,028,5260.7046
2025UTCoal18,006,77666293Total Electric Power IndustryUtah38,144,05547.2073
2025UTGeothermal469,68066294Total Electric Power IndustryUtah38,144,0551.2313
2025UTHydroelectric Conventional527,50966295Total Electric Power IndustryUtah38,144,0551.3829
2025UTNatural Gas11,518,60966296Total Electric Power IndustryUtah38,144,05530.1977
2025UTOther Gases2,10566297Total Electric Power IndustryUtah38,144,0550.0055
2025UTOther127,41666298Total Electric Power IndustryUtah38,144,0550.3340
2025UTPetroleum31,07366299Total Electric Power IndustryUtah38,144,0550.0815
2025UTSolar Thermal and Photovoltaic6,619,35866300Total Electric Power IndustryUtah38,144,05517.3536
2025UTOther Biomass47,82366301Total Electric Power IndustryUtah38,144,0550.1254
2025UTWind793,70666302Total Electric Power IndustryUtah38,144,0552.0808
2025VACoal3,606,93166334Total Electric Power IndustryVirginia106,388,6423.3903
2025VAPumped Storage-1,480,78466335Total Electric Power IndustryVirginia106,388,642-1.3919
2025VAHydroelectric Conventional1,035,57266336Total Electric Power IndustryVirginia106,388,6420.9734
2025VANatural Gas61,597,18566337Total Electric Power IndustryVirginia106,388,64257.8983
2025VANuclear28,214,20566338Total Electric Power IndustryVirginia106,388,64226.5199
2025VAOther463,44666339Total Electric Power IndustryVirginia106,388,6420.4356
2025VAPetroleum644,51566340Total Electric Power IndustryVirginia106,388,6420.6058
2025VASolar Thermal and Photovoltaic8,875,44966341Total Electric Power IndustryVirginia106,388,6428.3425
2025VAOther Biomass753,65066342Total Electric Power IndustryVirginia106,388,6420.7084
2025VAWind49,93366343Total Electric Power IndustryVirginia106,388,6420.0469
2025VAWood and Wood Derived Fuels2,628,54166344Total Electric Power IndustryVirginia106,388,6422.4707
2025VTHydroelectric Conventional1,010,94766385Total Electric Power IndustryVermont2,033,03049.7261
2025VTNatural Gas1,09466386Total Electric Power IndustryVermont2,033,0300.0538
2025VTOther-1,59966387Total Electric Power IndustryVermont2,033,030-0.0787
2025VTPetroleum3,89166388Total Electric Power IndustryVermont2,033,0300.1914
2025VTSolar Thermal and Photovoltaic209,33566389Total Electric Power IndustryVermont2,033,03010.2967
2025VTOther Biomass57,38766390Total Electric Power IndustryVermont2,033,0302.8227
2025VTWind384,31566391Total Electric Power IndustryVermont2,033,03018.9036
2025VTWood and Wood Derived Fuels367,66066392Total Electric Power IndustryVermont2,033,03018.0843
2025WACoal3,160,33866413Total Electric Power IndustryWashington101,670,3823.1084
2025WAPumped Storage-2,63766414Total Electric Power IndustryWashington101,670,382-0.0026
2025WAHydroelectric Conventional64,661,72266415Total Electric Power IndustryWashington101,670,38263.5994
2025WANatural Gas15,978,16666416Total Electric Power IndustryWashington101,670,38215.7157
2025WANuclear7,748,11466417Total Electric Power IndustryWashington101,670,3827.6208
2025WAOther Gases259,52566418Total Electric Power IndustryWashington101,670,3820.2553
2025WAOther73,66666419Total Electric Power IndustryWashington101,670,3820.0725
2025WAPetroleum13,63766420Total Electric Power IndustryWashington101,670,3820.0134
2025WASolar Thermal and Photovoltaic628,79766421Total Electric Power IndustryWashington101,670,3820.6185
2025WAOther Biomass116,75066422Total Electric Power IndustryWashington101,670,3820.1148
2025WAWind8,080,92466423Total Electric Power IndustryWashington101,670,3827.9482
2025WAWood and Wood Derived Fuels951,38066424Total Electric Power IndustryWashington101,670,3820.9357
2025WICoal23,317,94066456Total Electric Power IndustryWisconsin66,253,08635.1953
2025WIHydroelectric Conventional1,898,72766457Total Electric Power IndustryWisconsin66,253,0862.8659
2025WINatural Gas23,653,21866458Total Electric Power IndustryWisconsin66,253,08635.7013
2025WINuclear10,175,52966459Total Electric Power IndustryWisconsin66,253,08615.3586
2025WIOther23,78066460Total Electric Power IndustryWisconsin66,253,0860.0359
2025WIPetroleum109,58766461Total Electric Power IndustryWisconsin66,253,0860.1654
2025WISolar Thermal and Photovoltaic3,987,65666462Total Electric Power IndustryWisconsin66,253,0866.0188
2025WIOther Biomass358,50166463Total Electric Power IndustryWisconsin66,253,0860.5411
2025WIWind1,959,76166464Total Electric Power IndustryWisconsin66,253,0862.9580
2025WIWood and Wood Derived Fuels768,38766465Total Electric Power IndustryWisconsin66,253,0861.1598
2025WVCoal46,271,67266507Total Electric Power IndustryWest Virginia53,389,45586.6682
2025WVHydroelectric Conventional1,422,75366508Total Electric Power IndustryWest Virginia53,389,4552.6649
2025WVNatural Gas3,309,94366509Total Electric Power IndustryWest Virginia53,389,4556.1996
2025WVOther Gases17,31466510Total Electric Power IndustryWest Virginia53,389,4550.0324
2025WVOther-5,58866511Total Electric Power IndustryWest Virginia53,389,455-0.0105
2025WVPetroleum141,93366512Total Electric Power IndustryWest Virginia53,389,4550.2658
2025WVSolar Thermal and Photovoltaic233,42966513Total Electric Power IndustryWest Virginia53,389,4550.4372
2025WVOther Biomass6,79466514Total Electric Power IndustryWest Virginia53,389,4550.0127
2025WVWind1,991,20566515Total Electric Power IndustryWest Virginia53,389,4553.7296
2025WYCoal26,361,01866536Total Electric Power IndustryWyoming45,576,51757.8390
2025WYHydroelectric Conventional829,62366537Total Electric Power IndustryWyoming45,576,5171.8203
2025WYNatural Gas4,663,58766538Total Electric Power IndustryWyoming45,576,51710.2324
2025WYOther Gases363,24366539Total Electric Power IndustryWyoming45,576,5170.7970
2025WYOther85,29066540Total Electric Power IndustryWyoming45,576,5170.1871
2025WYPetroleum52,70266541Total Electric Power IndustryWyoming45,576,5170.1156
2025WYSolar Thermal and Photovoltaic495,99766542Total Electric Power IndustryWyoming45,576,5171.0883
2025WYWind12,725,05766543Total Electric Power IndustryWyoming45,576,51727.9202

Download the same complete table (CSV)

Complete state totals and largest reported fuels, all 572 rows

All 50 states, DC and the U.S. for every year, 572 complete geography-year totals. Largest reported fuel is the maximum numeric source fuel row, not necessarily a majority.

Period: 2015 through 2025, one September 2026 final historical workbook edition. Units: Whole MWh; percent of published same-year total.

Original sources: EIA state historical generation workbook, source row and columns A:E

Complete state totals and largest reported fuels; 2015 through 2025, one September 2026 final historical workbook edition; Whole MWh; percent of published same-year total
yearstatestate nametotal generation mwhlargest reported fuellargest fuel mwhlargest fuel pct total
2015AKAlaska6,284,937Natural Gas3,089,71349.1606
2015ALAlabama152,477,427Natural Gas55,844,45736.6247
2015ARArkansas55,559,428Coal21,740,03339.1293
2015AZArizona113,142,048Coal36,167,16931.9662
2015CACalifornia196,703,858Natural Gas116,139,60959.0429
2015COColorado52,393,077Coal31,540,89560.2005
2015CTConnecticut37,470,622Nuclear17,410,91746.4655
2015DCDistrict of Columbia53,750Other Biomass30,99957.6726
2015DEDelaware7,810,006Natural Gas6,689,26785.6500
2015FLFlorida237,412,633Natural Gas155,824,15265.6343
2015GAGeorgia128,817,898Natural Gas50,469,26639.1788
2015HIHawaii10,119,500Petroleum7,023,15069.4021
2015IAIowa56,658,918Coal29,811,07552.6150
2015IDIdaho15,667,095Hydroelectric Conventional8,756,62255.8918
2015ILIllinois193,952,040Nuclear97,282,13950.1578
2015INIndiana104,019,275Coal78,230,68875.2079
2015KSKansas45,527,124Coal24,593,33454.0191
2015KYKentucky83,543,671Coal72,620,42986.9251
2015LALouisiana107,812,354Natural Gas66,210,83261.4130
2015MAMassachusetts32,085,969Natural Gas21,007,41165.4723
2015MDMaryland36,365,544Nuclear14,643,32540.2670
2015MEMaine11,741,265Hydroelectric Conventional3,360,52728.6215
2015MIMichigan113,008,050Coal52,884,03346.7967
2015MNMinnesota56,979,768Coal24,697,09843.3436
2015MOMissouri83,640,067Coal65,325,52178.1031
2015MSMississippi64,757,864Natural Gas45,116,94369.6702
2015MTMontana29,302,401Coal16,013,20654.6481
2015NCNorth Carolina128,388,445Nuclear42,096,76132.7886
2015NDNorth Dakota37,156,612Coal27,734,41374.6419
2015NENebraska39,883,391Coal24,185,42160.6403
2015NHNew Hampshire20,015,893Nuclear9,484,20447.3834
2015NJNew Jersey74,608,860Natural Gas36,974,45649.5577
2015NMNew Mexico32,701,398Coal20,439,53262.5035
2015NVNevada39,046,784Natural Gas28,999,51474.2686
2015NYNew York138,581,686Natural Gas56,923,41541.0757
2015OHOhio123,079,294Coal71,709,53058.2629
2015OKOklahoma76,135,596Natural Gas34,286,32745.0332
2015OROregon57,866,535Hydroelectric Conventional31,253,85154.0102
2015PAPennsylvania214,545,267Nuclear80,516,75237.5290
2015RIRhode Island6,939,019Natural Gas6,585,94394.9117
2015SCSouth Carolina96,532,213Nuclear53,156,32055.0659
2015SDSouth Dakota9,633,033Hydroelectric Conventional4,850,48550.3526
2015TNTennessee75,214,636Coal30,586,33140.6654
2015TXTexas449,826,336Natural Gas237,731,42752.8496
2015US-TotalUnited States4,078,713,772Coal1,352,398,19733.1575
2015UTUtah41,949,120Coal31,656,48975.4640
2015VAVirginia84,411,592Natural Gas33,284,21639.4309
2015VTVermont1,982,047Hydroelectric Conventional1,139,49857.4910
2015WAWashington109,287,458Hydroelectric Conventional73,404,91667.1668
2015WIWisconsin66,360,183Coal37,180,54756.0284
2015WVWest Virginia72,295,269Coal68,056,09394.1363
2015WYWyoming48,966,519Coal43,091,18988.0013
2016AKAlaska6,335,034Natural Gas3,040,48747.9948
2016ALAlabama142,385,098Natural Gas57,803,61840.5967
2016ARArkansas60,445,059Coal23,800,07039.3747
2016AZArizona108,763,449Natural Gas34,182,80831.4286
2016CACalifornia196,963,215Natural Gas97,073,66449.2852
2016COColorado54,418,480Coal29,948,67555.0340
2016CTConnecticut36,496,560Natural Gas17,951,50349.1868
2016DCDistrict of Columbia76,474Other Biomass52,77169.0052
2016DEDelaware8,731,261Natural Gas7,787,46989.1907
2016FLFlorida238,262,150Natural Gas158,495,44566.5215
2016GAGeorgia133,380,416Natural Gas52,862,46439.6329
2016HIHawaii9,948,845Petroleum6,640,31666.7446
2016IAIowa54,392,507Coal25,198,34746.3269
2016IDIdaho15,660,938Hydroelectric Conventional9,033,27257.6803
2016ILIllinois187,289,131Nuclear98,607,03852.6496
2016INIndiana101,759,059Coal72,533,08071.2792
2016KSKansas47,599,991Coal23,096,06448.5212
2016KYKentucky80,273,501Coal66,822,05883.2430
2016LALouisiana107,268,804Natural Gas66,479,14261.9743
2016MAMassachusetts31,955,022Natural Gas21,143,93666.1678
2016MDMaryland37,166,687Nuclear14,760,17739.7135
2016MEMaine11,514,427Natural Gas3,498,34030.3822
2016MIMichigan112,121,790Coal40,526,87236.1454
2016MNMinnesota59,478,753Coal23,206,28939.0161
2016MOMissouri78,611,513Coal60,321,89076.7342
2016MSMississippi62,881,295Natural Gas50,094,73979.6656
2016MTMontana27,783,529Coal14,269,22251.3586
2016NCNorth Carolina130,779,157Nuclear42,786,08732.7163
2016NDNorth Dakota37,856,452Coal26,580,35070.2135
2016NENebraska36,524,869Coal21,897,71559.9529
2016NHNew Hampshire19,282,493Nuclear10,761,16355.8079
2016NJNew Jersey77,611,403Natural Gas43,807,45356.4446
2016NMNew Mexico32,912,045Coal18,365,27055.8011
2016NVNevada39,787,005Natural Gas28,921,61272.6911
2016NYNew York134,376,715Natural Gas56,793,33642.2643
2016OHOhio119,886,066Coal68,775,16457.3671
2016OKOklahoma78,655,007Natural Gas36,529,08646.4422
2016OROregon60,182,013Hydroelectric Conventional34,549,36657.4081
2016PAPennsylvania215,041,730Nuclear82,924,01138.5618
2016RIRhode Island6,564,885Natural Gas6,290,50395.8205
2016SCSouth Carolina96,985,764Nuclear55,825,91657.5609
2016SDSouth Dakota11,524,184Hydroelectric Conventional4,805,52641.6995
2016TNTennessee79,340,633Coal31,167,63439.2833
2016TXTexas454,047,591Natural Gas225,976,26049.7693
2016US-TotalUnited States4,077,573,801Natural Gas1,379,270,92233.8258
2016UTUtah38,133,928Coal25,939,44368.0220
2016VAVirginia92,554,876Natural Gas40,904,84344.1952
2016VTVermont1,911,207Hydroelectric Conventional1,077,51756.3789
2016WAWashington114,086,582Hydroelectric Conventional78,345,80968.6722
2016WIWisconsin64,966,611Coal33,362,84151.3538
2016WVWest Virginia75,942,968Coal71,512,96194.1667
2016WYWyoming46,656,630Coal40,026,87485.7903
2017AKAlaska6,497,466Natural Gas3,234,86849.7866
2017ALAlabama139,964,250Natural Gas52,983,66337.8551
2017ARArkansas60,775,216Coal26,285,43543.2503
2017AZArizona105,851,765Nuclear32,340,13830.5523
2017CACalifornia206,146,520Natural Gas88,350,15842.8579
2017COColorado53,844,002Coal29,242,21654.3091
2017CTConnecticut34,562,654Nuclear16,499,62147.7383
2017DCDistrict of Columbia66,871Other Biomass47,16770.5343
2017DEDelaware7,495,976Natural Gas6,723,18889.6906
2017FLFlorida238,413,437Natural Gas161,104,58867.5736
2017GAGeorgia127,455,314Natural Gas52,722,50041.3655
2017HIHawaii9,812,968Petroleum6,633,59667.6003
2017IAIowa57,909,566Coal25,358,23043.7894
2017IDIdaho17,396,024Hydroelectric Conventional10,670,40961.3382
2017ILIllinois183,591,571Nuclear97,191,14252.9388
2017INIndiana98,929,818Coal72,384,95773.1680
2017KSKansas50,933,296Coal19,389,77138.0690
2017KYKentucky73,179,196Coal57,236,50978.2142
2017LALouisiana97,719,213Natural Gas59,001,09260.3782
2017MAMassachusetts32,204,115Natural Gas22,152,55868.7880
2017MDMaryland34,104,080Nuclear15,106,98844.2967
2017MEMaine11,264,280Hydroelectric Conventional3,388,77730.0843
2017MIMichigan112,313,501Coal42,020,54837.4136
2017MNMinnesota58,748,831Coal22,781,89838.7785
2017MOMissouri84,606,731Coal67,518,94379.8033
2017MSMississippi59,727,637Natural Gas46,158,47377.2816
2017MTMontana28,220,946Coal13,864,09949.1270
2017NCNorth Carolina128,468,117Nuclear42,374,26432.9843
2017NDNorth Dakota41,505,074Coal26,756,46564.4655
2017NENebraska35,406,982Coal21,173,56359.8005
2017NHNew Hampshire17,446,841Nuclear9,990,70457.2637
2017NJNew Jersey75,644,513Natural Gas37,707,84849.8488
2017NMNew Mexico33,597,413Coal18,414,48354.8092
2017NVNevada38,201,294Natural Gas26,625,90469.6990
2017NYNew York128,025,386Natural Gas47,271,75636.9237
2017OHOhio120,814,403Coal68,343,63656.5691
2017OKOklahoma73,731,654Natural Gas30,450,56941.2992
2017OROregon62,713,747Hydroelectric Conventional38,293,93861.0615
2017PAPennsylvania213,591,294Nuclear83,199,83238.9528
2017RIRhode Island7,614,941Natural Gas7,188,19294.3959
2017SCSouth Carolina93,080,939Nuclear54,344,55458.3842
2017SDSouth Dakota10,935,719Hydroelectric Conventional5,255,52048.0583
2017TNTennessee79,046,222Nuclear31,817,50240.2518
2017TXTexas452,794,365Natural Gas204,511,99645.1666
2017US-TotalUnited States4,035,442,895Natural Gas1,297,702,52832.1576
2017UTUtah37,411,876Coal26,389,56770.5379
2017VAVirginia90,417,149Natural Gas44,506,88549.2239
2017VTVermont2,141,388Hydroelectric Conventional1,280,36859.7915
2017WAWashington115,912,078Hydroelectric Conventional82,182,85570.9010
2017WIWisconsin65,107,333Coal35,852,22255.0663
2017WVWest Virginia73,357,080Coal68,349,00993.1730
2017WYWyoming46,741,846Coal40,068,56685.7231
2018AKAlaska6,247,359Natural Gas2,947,90247.1864
2018ALAlabama145,057,994Natural Gas58,800,41940.5358
2018ARArkansas67,999,352Coal29,996,10144.1123
2018AZArizona111,925,144Natural Gas37,168,07533.2080
2018CACalifornia195,465,638Natural Gas89,804,70345.9440
2018COColorado55,386,279Coal26,382,06047.6328
2018CTConnecticut39,453,552Natural Gas20,006,45750.7089
2018DCDistrict of Columbia79,331Other Biomass56,56171.2975
2018DEDelaware6,240,644Natural Gas5,400,15586.5320
2018FLFlorida244,252,035Natural Gas171,872,21470.3667
2018GAGeorgia129,239,371Natural Gas51,972,11040.2138
2018HIHawaii9,796,773Petroleum6,748,94768.8895
2018IAIowa63,380,569Coal28,552,99945.0501
2018IDIdaho18,172,120Hydroelectric Conventional11,024,34260.6662
2018ILIllinois188,003,357Nuclear98,101,52752.1807
2018INIndiana113,459,711Coal77,455,22968.2667
2018KSKansas51,710,213Coal20,473,98339.5937
2018KYKentucky78,804,497Coal59,168,14375.0822
2018LALouisiana102,128,485Natural Gas61,781,77460.4942
2018MAMassachusetts27,172,882Natural Gas18,385,82167.6624
2018MDMaryland43,809,648Nuclear14,987,93134.2115
2018MEMaine11,280,700Hydroelectric Conventional3,261,05428.9083
2018MIMichigan115,837,095Coal42,330,86436.5434
2018MNMinnesota61,517,441Coal23,455,35638.1280
2018MOMissouri85,095,384Coal63,355,13574.4519
2018MSMississippi63,473,771Natural Gas49,481,81177.9563
2018MTMontana28,212,831Coal13,360,02647.3544
2018NCNorth Carolina134,249,497Natural Gas43,445,74932.3619
2018NDNorth Dakota42,615,321Coal27,540,66564.6262
2018NENebraska36,966,216Coal23,305,20863.0446
2018NHNew Hampshire17,087,156Nuclear10,061,69658.8846
2018NJNew Jersey75,033,600Natural Gas38,863,49251.7948
2018NMNew Mexico32,673,682Coal13,401,53241.0163
2018NVNevada39,640,241Natural Gas26,688,61267.3271
2018NYNew York132,520,501Natural Gas50,810,42638.3416
2018OHOhio127,937,288Coal58,726,96245.9029
2018OKOklahoma87,181,402Natural Gas42,570,65748.8300
2018OROregon64,113,560Hydroelectric Conventional35,442,77355.2812
2018PAPennsylvania215,385,830Nuclear83,476,74438.7568
2018RIRhode Island8,375,257Natural Gas7,896,94094.2889
2018SCSouth Carolina99,364,088Nuclear52,716,46953.0538
2018SDSouth Dakota12,616,396Hydroelectric Conventional6,266,27049.6677
2018TNTennessee81,554,917Nuclear36,176,38244.3583
2018TXTexas477,352,425Natural Gas239,713,08450.2172
2018US-TotalUnited States4,180,987,703Natural Gas1,471,843,03135.2032
2018UTUtah39,375,424Coal25,912,47465.8087
2018VAVirginia95,509,121Natural Gas50,160,30152.5189
2018VTVermont2,178,915Hydroelectric Conventional1,268,18958.2028
2018WAWashington116,756,729Hydroelectric Conventional80,883,37769.2751
2018WIWisconsin65,936,803Coal33,322,37950.5368
2018WVWest Virginia67,249,025Coal62,038,83592.2524
2018WYWyoming46,112,136Coal39,679,28786.0496
2019AKAlaska6,070,843Natural Gas2,686,99044.2606
2019ALAlabama142,679,433Natural Gas57,197,37040.0880
2019ARArkansas64,442,898Coal23,313,20136.1765
2019AZArizona113,551,987Natural Gas46,084,36740.5844
2019CACalifornia201,784,204Natural Gas85,840,77542.5409
2019COColorado56,337,734Coal25,320,50344.9441
2019CTConnecticut40,050,038Natural Gas21,343,09553.2911
2019DCDistrict of Columbia174,080Natural Gas110,12363.2600
2019DEDelaware5,258,538Natural Gas4,806,23991.3988
2019FLFlorida245,603,485Natural Gas182,006,84274.1060
2019GAGeorgia128,691,569Natural Gas58,619,99745.5508
2019HIHawaii9,749,998Petroleum6,864,16970.4017
2019IAIowa62,649,563Wind26,304,99041.9875
2019IDIdaho18,407,812Hydroelectric Conventional10,333,23556.1351
2019ILIllinois184,470,052Nuclear98,735,48853.5239
2019INIndiana102,505,381Coal60,761,80659.2767
2019KSKansas50,887,992Wind21,123,53941.5099
2019KYKentucky71,804,254Coal51,714,43072.0214
2019LALouisiana100,174,762Natural Gas69,522,95469.4017
2019MAMassachusetts21,515,636Natural Gas15,406,57371.6064
2019MDMaryland39,325,595Nuclear15,012,92238.1760
2019MEMaine10,490,562Hydroelectric Conventional3,499,34133.3570
2019MIMichigan116,701,488Coal37,341,48931.9974
2019MNMinnesota59,379,390Coal17,804,53829.9844
2019MOMissouri78,278,751Coal55,686,28571.1384
2019MSMississippi65,958,760Natural Gas48,780,50573.9561
2019MTMontana27,797,079Coal14,100,66250.7271
2019NCNorth Carolina131,173,861Nuclear41,915,60531.9542
2019NDNorth Dakota41,147,324Coal25,151,43761.1253
2019NENebraska37,297,615Coal20,385,42354.6561
2019NHNew Hampshire18,026,595Nuclear10,906,92360.5046
2019NJNew Jersey71,018,774Natural Gas40,449,13356.9556
2019NMNew Mexico35,174,510Coal14,691,66541.7679
2019NVNevada39,889,660Natural Gas25,774,96664.6157
2019NYNew York131,603,289Natural Gas47,612,13436.1785
2019OHOhio121,550,123Natural Gas52,874,45143.5001
2019OKOklahoma86,386,170Natural Gas45,357,63252.5057
2019OROregon62,258,378Hydroelectric Conventional30,322,00348.7035
2019PAPennsylvania228,995,331Natural Gas98,040,34442.8132
2019RIRhode Island7,624,403Natural Gas7,141,02693.6601
2019SCSouth Carolina100,107,504Nuclear56,103,04356.0428
2019SDSouth Dakota14,506,647Hydroelectric Conventional7,915,15554.5623
2019TNTennessee82,327,109Nuclear35,720,40543.3884
2019TXTexas483,201,031Natural Gas255,630,02152.9035
2019US-TotalUnited States4,130,573,879Natural Gas1,588,532,83938.4579
2019UTUtah39,117,033Coal25,241,02664.5269
2019VAVirginia96,827,639Natural Gas57,985,15159.8849
2019VTVermont2,289,798Hydroelectric Conventional1,337,01758.3902
2019WAWashington106,463,608Hydroelectric Conventional66,018,32362.0102
2019WIWisconsin62,774,299Coal26,335,39041.9525
2019WVWest Virginia63,925,639Coal58,181,62991.0145
2019WYWyoming42,145,656Coal35,375,82883.9371
2020AKAlaska6,276,441Natural Gas2,640,76042.0742
2020ALAlabama137,547,377Natural Gas55,229,67440.1532
2020ARArkansas54,641,259Natural Gas18,307,32733.5046
2020AZArizona109,305,057Natural Gas50,777,57046.4549
2020CACalifornia193,083,537Natural Gas92,046,68547.6719
2020COColorado54,115,011Coal19,478,40535.9945
2020CTConnecticut41,190,572Natural Gas23,536,81357.1413
2020DCDistrict of Columbia201,104Natural Gas133,53666.4015
2020DEDelaware5,205,372Natural Gas4,818,09492.5600
2020FLFlorida250,827,799Natural Gas189,420,46275.5181
2020GAGeorgia120,128,938Natural Gas59,177,96449.2620
2020HIHawaii9,079,019Petroleum6,149,20567.7298
2020IAIowa59,636,671Wind34,182,30257.3176
2020IDIdaho17,686,135Hydroelectric Conventional9,508,11353.7603
2020ILIllinois173,394,526Nuclear100,246,06857.8139
2020INIndiana90,072,979Coal47,772,88553.0380
2020KSKansas54,541,831Wind23,963,74443.9364
2020KYKentucky63,539,829Coal43,638,31368.6787
2020LALouisiana100,773,772Natural Gas70,781,54770.2381
2020MAMassachusetts18,214,175Natural Gas14,177,40677.8372
2020MDMaryland36,029,146Nuclear15,080,55741.8565
2020MEMaine10,001,870Hydroelectric Conventional3,158,19531.5760
2020MIMichigan106,624,721Natural Gas36,433,83934.1702
2020MNMinnesota56,510,143Nuclear14,677,28825.9728
2020MOMissouri72,567,879Coal51,755,69071.3204
2020MSMississippi66,581,766Natural Gas53,661,58080.5950
2020MTMontana23,353,290Hydroelectric Conventional10,747,53546.0215
2020NCNorth Carolina124,363,443Nuclear42,328,76234.0363
2020NDNorth Dakota42,176,424Coal24,496,80758.0818
2020NENebraska36,848,681Coal18,788,64750.9887
2020NHNew Hampshire16,350,578Nuclear9,865,19660.3355
2020NJNew Jersey61,106,458Natural Gas30,630,98250.1272
2020NMNew Mexico34,075,584Coal12,788,18437.5289
2020NVNevada40,424,745Natural Gas26,801,32166.2993
2020NYNew York129,430,271Natural Gas52,965,59340.9221
2020OHOhio122,538,182Natural Gas53,927,04244.0084
2020OKOklahoma83,367,729Natural Gas44,828,78653.7723
2020OROregon63,624,782Hydroelectric Conventional31,920,64350.1701
2020PAPennsylvania230,143,279Natural Gas120,766,86052.4746
2020RIRhode Island8,894,940Natural Gas8,272,36593.0008
2020SCSouth Carolina98,528,797Nuclear54,751,08855.5686
2020SDSouth Dakota14,146,539Hydroelectric Conventional5,830,61341.2158
2020TNTennessee80,566,010Nuclear36,688,19545.5381
2020TXTexas473,514,930Natural Gas246,629,50852.0848
2020US-TotalUnited States4,009,766,846Natural Gas1,626,789,64040.5707
2020UTUtah37,087,309Coal22,806,02161.4928
2020VAVirginia103,056,001Natural Gas62,622,88860.7659
2020VTVermont2,156,407Hydroelectric Conventional1,129,67352.3868
2020WAWashington116,114,468Hydroelectric Conventional76,409,65965.8055
2020WIWisconsin61,448,545Coal23,761,09738.6683
2020WVWest Virginia56,661,533Coal50,216,39888.6252
2020WYWyoming42,010,989Coal33,359,10479.4057
2021AKAlaska6,595,818Natural Gas3,085,39646.7781
2021ALAlabama142,733,330Natural Gas54,447,87538.1466
2021ARArkansas61,100,068Coal21,418,87735.0554
2021AZArizona108,604,620Natural Gas48,053,13344.2459
2021CACalifornia197,165,106Natural Gas97,427,09249.4140
2021COColorado56,838,472Coal23,602,04241.5248
2021CTConnecticut44,079,943Natural Gas24,488,90255.5557
2021DCDistrict of Columbia211,101Natural Gas137,07264.9320
2021DEDelaware4,305,126Natural Gas3,734,20386.7385
2021FLFlorida247,906,982Natural Gas182,619,84673.6647
2021GAGeorgia124,200,528Natural Gas56,673,11545.6303
2021HIHawaii9,182,191Petroleum6,155,20767.0342
2021IAIowa67,207,008Wind37,098,27455.2000
2021IDIdaho16,836,473Hydroelectric Conventional7,995,21747.4875
2021ILIllinois181,637,574Nuclear96,994,45853.4000
2021INIndiana94,164,796Coal54,447,94357.8220
2021KSKansas56,630,703Wind25,693,69545.3706
2021KYKentucky69,908,411Coal49,862,72971.3258
2021LALouisiana98,715,313Natural Gas63,961,17464.7936
2021MAMassachusetts19,477,347Natural Gas15,009,93277.0635
2021MDMaryland38,235,137Nuclear14,993,63339.2143
2021MEMaine10,908,150Natural Gas3,347,67230.6896
2021MIMichigan115,513,130Coal37,053,90332.0777
2021MNMinnesota59,195,769Coal15,764,27526.6307
2021MOMissouri76,941,410Coal57,858,26875.1978
2021MSMississippi67,723,497Natural Gas48,621,02571.7934
2021MTMontana24,947,923Coal10,876,45443.5966
2021NCNorth Carolina129,923,364Natural Gas47,444,63436.5174
2021NDNorth Dakota43,032,378Coal24,402,79156.7080
2021NENebraska37,910,898Coal18,933,61749.9424
2021NHNew Hampshire17,193,254Nuclear9,856,11757.3255
2021NJNew Jersey61,433,792Natural Gas29,542,81548.0889
2021NMNew Mexico35,192,365Coal12,536,31935.6223
2021NVNevada41,754,584Natural Gas26,129,91862.5798
2021NYNew York124,772,248Natural Gas56,342,70745.1564
2021OHOhio125,947,507Natural Gas56,380,78244.7653
2021OKOklahoma80,754,586Natural Gas33,857,23841.9261
2021OROregon61,016,874Hydroelectric Conventional27,659,57345.3310
2021PAPennsylvania241,331,434Natural Gas126,664,87852.4859
2021RIRhode Island9,322,650Natural Gas8,641,18792.6902
2021SCSouth Carolina98,390,441Nuclear53,771,42854.6511
2021SDSouth Dakota17,322,409Wind9,326,61753.8413
2021TNTennessee79,057,209Nuclear35,330,40744.6897
2021TXTexas481,844,256Natural Gas233,120,82548.3809
2021US-TotalUnited States4,109,699,390Natural Gas1,579,189,98738.4259
2021UTUtah42,565,645Coal26,375,56561.9644
2021VAVirginia93,478,182Natural Gas53,611,27457.3516
2021VTVermont2,107,703Hydroelectric Conventional1,092,77151.8465
2021WAWashington110,808,401Hydroelectric Conventional71,379,35764.4169
2021WIWisconsin64,276,480Coal27,441,58742.6930
2021WVWest Virginia65,836,063Coal59,667,58990.6306
2021WYWyoming43,460,744Coal32,038,12873.7174
2022AKAlaska6,694,128Natural Gas3,229,37648.2419
2022ALAlabama144,788,893Natural Gas62,217,44542.9711
2022ARArkansas65,905,030Natural Gas26,037,43339.5075
2022AZArizona104,698,773Natural Gas45,053,24543.0313
2022CACalifornia203,383,857Natural Gas96,371,55747.3841
2022COColorado58,044,009Coal21,723,00437.4251
2022CTConnecticut43,054,099Natural Gas24,530,68756.9764
2022DCDistrict of Columbia160,237Natural Gas80,27250.0958
2022DEDelaware5,308,370Natural Gas4,749,64589.4746
2022FLFlorida258,910,357Natural Gas193,310,02074.6629
2022GAGeorgia126,484,633Natural Gas59,848,73147.3170
2022HIHawaii9,337,434Petroleum6,655,17871.2742
2022IAIowa72,982,198Wind45,761,37062.7021
2022IDIdaho16,278,410Hydroelectric Conventional8,359,73851.3548
2022ILIllinois185,223,322Nuclear98,869,58153.3786
2022INIndiana98,054,905Coal51,384,11552.4034
2022KSKansas62,197,516Wind29,687,47947.7310
2022KYKentucky69,147,329Coal47,053,32768.0479
2022LALouisiana105,504,849Natural Gas72,275,00768.5040
2022MAMassachusetts21,026,161Natural Gas15,775,96775.0302
2022MDMaryland37,139,365Nuclear14,810,68439.8787
2022MEMaine12,763,920Natural Gas4,140,36532.4380
2022MIMichigan117,497,052Natural Gas41,183,78435.0509
2022MNMinnesota58,966,891Coal16,158,69527.4030
2022MOMissouri79,361,031Coal52,832,37766.5722
2022MSMississippi67,781,240Natural Gas51,719,17176.3031
2022MTMontana27,088,740Coal11,651,07343.0108
2022NCNorth Carolina134,257,088Natural Gas58,131,39643.2986
2022NDNorth Dakota44,400,956Coal24,831,18555.9249
2022NENebraska40,692,718Coal19,945,26949.0143
2022NHNew Hampshire18,764,393Nuclear10,921,52858.2035
2022NJNew Jersey65,060,636Natural Gas33,394,32351.3280
2022NMNew Mexico40,889,036Wind14,434,55135.3018
2022NVNevada42,591,838Natural Gas24,844,42258.3314
2022NYNew York125,185,364Natural Gas60,312,01248.1782
2022OHOhio135,810,459Natural Gas68,864,96950.7067
2022OKOklahoma84,634,922Wind37,552,75544.3703
2022OROregon61,317,616Hydroelectric Conventional31,304,31651.0527
2022PAPennsylvania239,261,130Natural Gas130,163,54954.4023
2022RIRhode Island7,819,453Natural Gas6,963,77389.0570
2022SCSouth Carolina98,709,501Nuclear54,369,75155.0806
2022SDSouth Dakota17,900,462Wind10,295,11357.5131
2022TNTennessee78,036,045Nuclear35,635,40045.6653
2022TXTexas525,563,343Natural Gas256,140,18048.7363
2022US-TotalUnited States4,230,667,563Natural Gas1,687,064,73939.8770
2022UTUtah39,386,043Coal22,390,21856.8481
2022VAVirginia89,477,325Natural Gas48,801,98754.5412
2022VTVermont2,183,829Hydroelectric Conventional1,140,68652.2333
2022WAWashington116,690,500Hydroelectric Conventional78,916,43567.6288
2022WIWisconsin61,239,302Natural Gas23,276,42838.0090
2022WVWest Virginia56,665,360Coal50,717,50289.5035
2022WYWyoming46,347,492Coal33,517,89672.3187
2023AKAlaska6,717,825Natural Gas3,182,40747.3726
2023ALAlabama139,435,011Natural Gas61,848,36744.3564
2023ARArkansas63,195,647Natural Gas26,487,46741.9134
2023AZArizona111,838,736Natural Gas52,817,50347.2265
2023CACalifornia216,628,795Natural Gas94,390,15343.5723
2023COColorado57,541,719Coal18,787,61732.6504
2023CTConnecticut40,666,418Natural Gas24,952,02161.3578
2023DCDistrict of Columbia171,870Natural Gas89,21051.9055
2023DEDelaware4,772,059Natural Gas4,382,64091.8396
2023FLFlorida259,798,332Natural Gas197,190,64675.9014
2023GAGeorgia129,221,513Natural Gas60,043,96246.4659
2023HIHawaii9,194,164Petroleum7,159,45677.8696
2023IAIowa69,836,973Wind41,439,49559.3375
2023IDIdaho17,842,446Hydroelectric Conventional8,377,74246.9540
2023ILIllinois177,737,641Nuclear97,559,46054.8896
2023INIndiana90,046,880Coal40,931,63045.4559
2023KSKansas58,456,598Wind27,272,58646.6544
2023KYKentucky63,217,080Coal43,447,44968.7274
2023LALouisiana97,784,566Natural Gas74,414,45276.1004
2023MAMassachusetts19,695,884Natural Gas14,774,02575.0107
2023MDMaryland36,000,650Natural Gas15,336,20642.5998
2023MEMaine12,512,181Natural Gas3,975,03731.7693
2023MIMichigan120,656,625Natural Gas54,068,08244.8115
2023MNMinnesota57,276,862Wind14,398,24925.1380
2023MOMissouri66,703,285Coal40,347,39360.4879
2023MSMississippi72,933,440Natural Gas55,167,57275.6410
2023MTMontana26,895,758Coal11,553,03942.9549
2023NCNorth Carolina126,553,381Natural Gas51,788,03140.9219
2023NDNorth Dakota42,068,807Coal22,525,07653.5434
2023NENebraska39,445,955Coal17,916,48245.4203
2023NHNew Hampshire16,824,999Nuclear9,534,78156.6703
2023NJNew Jersey64,228,914Natural Gas33,055,76551.4656
2023NMNew Mexico39,269,073Wind14,914,47337.9802
2023NVNevada42,164,375Natural Gas24,599,32658.3415
2023NYNew York124,039,988Natural Gas58,427,92047.1041
2023OHOhio133,223,464Natural Gas78,704,77759.0773
2023OKOklahoma89,236,017Natural Gas45,212,90850.6667
2023OROregon61,691,869Hydroelectric Conventional26,329,01342.6783
2023PAPennsylvania235,924,936Natural Gas139,256,04759.0256
2023RIRhode Island10,430,837Natural Gas9,553,67691.5907
2023SCSouth Carolina100,853,387Nuclear55,622,34055.1517
2023SDSouth Dakota17,436,158Wind9,375,57553.7709
2023TNTennessee77,791,204Nuclear37,937,43748.7683
2023TXTexas547,294,545Natural Gas282,158,66951.5552
2023US-TotalUnited States4,183,270,479Natural Gas1,806,062,91143.1735
2023UTUtah33,496,554Coal15,600,23146.5726
2023VAVirginia91,059,344Natural Gas50,604,69455.5733
2023VTVermont2,480,199Hydroelectric Conventional1,539,24562.0614
2023WAWashington102,960,605Hydroelectric Conventional61,445,84959.6790
2023WIWisconsin62,548,705Natural Gas25,621,19440.9620
2023WVWest Virginia52,286,784Coal44,797,57085.6767
2023WYWyoming43,181,420Coal30,844,00371.4289
2024AKAlaska6,690,506Natural Gas3,134,18646.8453
2024ALAlabama142,921,216Natural Gas64,598,75145.1989
2024ARArkansas61,542,484Natural Gas24,725,30740.1760
2024AZArizona116,026,511Natural Gas55,089,93047.4805
2024CACalifornia214,191,383Natural Gas86,655,67540.4571
2024COColorado58,798,395Natural Gas17,926,80230.4886
2024CTConnecticut44,761,412Natural Gas26,036,34358.1669
2024DCDistrict of Columbia187,195Natural Gas99,59553.2039
2024DEDelaware4,799,212Natural Gas4,205,66687.6324
2024FLFlorida266,119,236Natural Gas204,507,26376.8480
2024GAGeorgia139,805,428Natural Gas56,936,52640.7255
2024HIHawaii9,160,979Petroleum7,054,02177.0007
2024IAIowa70,464,148Wind44,277,15762.8364
2024IDIdaho20,035,438Hydroelectric Conventional9,150,27345.6704
2024ILIllinois185,012,935Nuclear99,211,85853.6243
2024INIndiana97,012,880Coal40,526,06041.7739
2024KSKansas57,696,155Wind29,795,18751.6415
2024KYKentucky66,950,848Coal44,829,32266.9586
2024LALouisiana99,622,835Natural Gas75,263,34775.5483
2024MAMassachusetts20,914,890Natural Gas16,202,97277.4710
2024MDMaryland35,424,816Nuclear14,724,06841.5643
2024MEMaine14,655,178Natural Gas6,398,78243.6623
2024MIMichigan124,200,090Natural Gas55,734,28144.8746
2024MNMinnesota58,595,222Natural Gas15,888,65627.1160
2024MOMissouri66,875,710Coal38,831,62358.0654
2024MSMississippi77,336,712Natural Gas60,025,53777.6158
2024MTMontana26,872,883Coal9,785,48636.4140
2024NCNorth Carolina134,965,396Natural Gas55,503,19641.1240
2024NDNorth Dakota42,557,243Coal23,183,08754.4751
2024NENebraska37,228,950Coal16,352,21343.9234
2024NHNew Hampshire16,942,479Nuclear9,676,86257.1160
2024NJNew Jersey60,175,245Natural Gas29,648,85049.2708
2024NMNew Mexico39,697,294Wind15,135,56838.1275
2024NVNevada45,528,427Natural Gas24,999,47054.9096
2024NYNew York129,015,493Natural Gas62,345,50748.3240
2024OHOhio142,746,706Natural Gas85,136,66459.6418
2024OKOklahoma94,069,145Natural Gas47,742,41350.7525
2024OROregon64,661,249Hydroelectric Conventional26,932,74641.6521
2024PAPennsylvania241,498,648Natural Gas143,912,52859.5914
2024RIRhode Island9,777,027Natural Gas8,791,21189.9170
2024SCSouth Carolina100,485,416Nuclear53,770,40753.5107
2024SDSouth Dakota20,871,994Wind12,073,96257.8477
2024TNTennessee76,166,766Nuclear32,185,96042.2572
2024TXTexas566,502,688Natural Gas293,193,46951.7550
2024US-TotalUnited States4,308,634,297Natural Gas1,869,902,14643.3990
2024UTUtah35,133,906Coal15,966,58445.4449
2024VAVirginia102,698,615Natural Gas60,998,07859.3952
2024VTVermont2,258,891Hydroelectric Conventional1,283,94656.8397
2024WAWashington102,397,711Hydroelectric Conventional60,736,30959.3141
2024WIWisconsin65,276,344Natural Gas26,245,56240.2068
2024WVWest Virginia50,594,818Coal43,097,86985.1824
2024WYWyoming40,709,150Coal24,381,61859.8922
2025AKAlaska7,537,732Natural Gas3,769,65150.0104
2025ALAlabama142,994,795Natural Gas65,595,15445.8724
2025ARArkansas68,607,241Natural Gas23,227,48533.8557
2025AZArizona116,470,876Natural Gas52,670,48545.2220
2025CACalifornia205,105,814Natural Gas74,287,23936.2190
2025COColorado56,644,901Natural Gas18,137,75532.0201
2025CTConnecticut43,773,266Natural Gas24,712,28056.4552
2025DCDistrict of Columbia198,159Natural Gas111,86856.4537
2025DEDelaware5,461,634Natural Gas4,699,83486.0518
2025FLFlorida268,262,996Natural Gas195,704,97872.9527
2025GAGeorgia145,688,391Natural Gas56,264,00338.6194
2025HIHawaii9,323,135Petroleum6,978,74074.8540
2025IAIowa74,504,732Wind43,572,98058.4835
2025IDIdaho20,285,349Hydroelectric Conventional8,850,66543.6308
2025ILIllinois191,820,799Nuclear97,670,26250.9175
2025INIndiana106,896,527Coal49,223,25946.0476
2025KSKansas61,984,540Wind29,220,85247.1422
2025KYKentucky74,373,407Coal48,660,31865.4270
2025LALouisiana102,391,851Natural Gas73,947,00172.2196
2025MAMassachusetts22,455,567Natural Gas17,695,95978.8043
2025MDMaryland37,605,846Natural Gas16,008,68742.5697
2025MEMaine14,843,055Natural Gas5,804,68539.1071
2025MIMichigan128,531,694Natural Gas54,286,71542.2361
2025MNMinnesota58,830,395Wind14,973,56725.4521
2025MOMissouri71,526,875Coal45,993,17764.3020
2025MSMississippi78,429,348Natural Gas57,699,27873.5685
2025MTMontana26,725,203Coal9,616,55135.9831
2025NCNorth Carolina134,695,642Natural Gas54,727,03240.6301
2025NDNorth Dakota42,873,330Coal22,598,04852.7089
2025NENebraska39,808,304Coal18,102,00045.4729
2025NHNew Hampshire19,112,246Nuclear10,910,16557.0847
2025NJNew Jersey60,963,388Natural Gas30,064,86649.3163
2025NMNew Mexico39,439,513Wind14,389,28436.4844
2025NVNevada45,192,785Natural Gas22,876,05550.6188
2025NYNew York130,936,043Natural Gas63,113,32648.2016
2025OHOhio145,331,002Natural Gas78,784,99654.2107
2025OKOklahoma89,894,620Natural Gas39,725,10044.1907
2025OROregon64,282,545Hydroelectric Conventional28,706,26044.6564
2025PAPennsylvania245,720,751Natural Gas143,124,18858.2467
2025RIRhode Island9,812,010Natural Gas8,660,02088.2594
2025SCSouth Carolina103,942,990Nuclear56,670,52454.5208
2025SDSouth Dakota21,865,727Wind12,727,93258.2095
2025TNTennessee75,446,353Nuclear29,333,22538.8796
2025TXTexas600,981,980Natural Gas290,245,56948.2952
2025US-TotalUnited States4,425,028,526Natural Gas1,811,003,58040.9264
2025UTUtah38,144,055Coal18,006,77647.2073
2025VAVirginia106,388,642Natural Gas61,597,18557.8983
2025VTVermont2,033,030Hydroelectric Conventional1,010,94749.7261
2025WAWashington101,670,382Hydroelectric Conventional64,661,72263.5994
2025WIWisconsin66,253,086Natural Gas23,653,21835.7013
2025WVWest Virginia53,389,455Coal46,271,67286.6682
2025WYWyoming45,576,517Coal26,361,01857.8390

Download the same complete table (CSV)

Data and downloads

Read the tables directly or download the research. No form or account is required.

Reproducible research bundle (ZIP) · Full data dictionary · Calculation program (Python)

Fuel total reconciliation (CSV)

Matched gas coal changes 2015 2025 (CSV)

National fuel history 2015 2025 (CSV)

Reported source inputs 2015 2025 (CSV)

Reported state fuel rankings 2025 (CSV)

State fuel mix 2025 (CSV)

State generation total history (CSV)

Cite this page

Retain the data year, Total Electric Power Industry scope, exact fuel and eligible comparison set. Output and share measure generation, not electricity consumed or supplied to an individual customer.

American Mineral Registry. "State Electricity Generation Statistics: Gas, Coal and Fuel Mix." American Mineral Registry, November 2026. https://americanmineralregistry.com/research/us-electricity-generation-fuel-mix-by-state/
<a href="https://americanmineralregistry.com/research/us-electricity-generation-fuel-mix-by-state/">U.S. Electricity Generation Fuel Mix by State</a> (American Mineral Registry, November 2026)