Key takeaways
- Federal coal royalty receipts fell from a series high of $799.33 million in FY 2012 to $236.76 million in FY 2026, a 70.4% decline in nominal dollars. The peak is within the 23 fiscal years available in the source extract.
- ONRR’s signed net coal royalty amount for Utah was negative $3.17 million in FY 2026. The calculation retains it in the national total. The source file does not explain the underlying activity for this result.
- Wyoming, Colorado and Montana together accounted for 99.27% of FY 2026 federal coal royalties in ONRR’s signed national total. Their combined $235.03 million is measured against $236.76 million for all eight source-state aggregates, including negative Utah receipts.
- Federal coal royalties fell by $161.18 million, or 40.5%, from FY 2025 to FY 2026. This was the largest annual fall in both dollar and percentage terms across the 22 adjacent-year changes in the nominal FY 2004 to FY 2026 series.
- Federal coal royalty receipts rose in 5 of 14 annual comparisons after their FY 2012 peak and fell in 9. Each comparison from FY 2013 through FY 2026 uses the signed nominal total for that year and its immediate predecessor.
- Median annual U.S. federal coal royalty receipts were $397,936,718.44 in FY 2020 through FY 2026, 40.96% below the $673,981,245.55 median in FY 2004 through FY 2012. Each median uses signed ONRR national fiscal-year receipts in nominal dollars.
- The median absolute annual change in U.S. federal coal royalty receipts was 10.12% in FY 2020 through FY 2026 versus 8.30% in FY 2004 through FY 2012, even though both periods’ median dollar changes were about $44 million. Percent changes divide each absolute annual change by the prior year’s receipts. Only adjacent pairs wholly within each period enter the comparison.

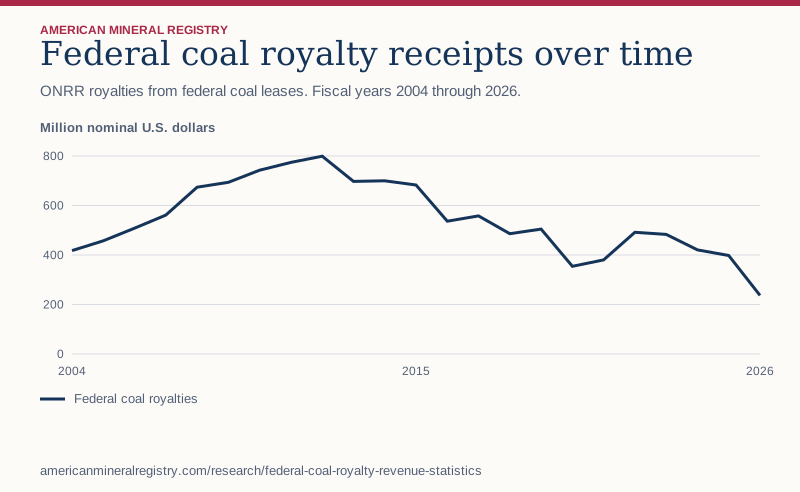
Figure 1 in text
ONRR royalties from federal coal leases. Fiscal years 2004 through 2026. Million nominal U.S. dollars.
| Fiscal year | Federal coal royalties |
|---|---|
| 2004 | 417.58 |
| 2005 | 457.49 |
| 2006 | 508.14 |
| 2007 | 561.31 |
| 2008 | 673.98 |
| 2009 | 693.90 |
| 2010 | 742.71 |
| 2011 | 774.19 |
| 2012 | 799.33 |
| 2013 | 697.47 |
| 2014 | 699.76 |
| 2015 | 682.83 |
| 2016 | 536.57 |
| 2017 | 557.95 |
| 2018 | 486.03 |
| 2019 | 504.56 |
| 2020 | 354.43 |
| 2021 | 380.25 |
| 2022 | 491.65 |
| 2023 | 483.28 |
| 2024 | 420.65 |
| 2025 | 397.94 |
| 2026 | 236.76 |
Chart wording and scale
Federal coal royalty receipts over time ONRR royalties from federal coal leases. Fiscal years 2004 through 2026.
Million nominal U.S. dollars 0 200 400 600 800 2004 2015 2026 Federal coal royalties
Source and data: Download chart source data
Permanent link to this figure’s text and data · Sources and context
When is federal coal royalty revenue the right measure?
Use this series for the signed royalty dollars ONRR recorded from federal coal by fiscal year. A question about all federal coal lease receipts requires a broader accounting scope. A question about physical output requires a production series expressed in tons. For electricity generated from coal rather than coal tonnage or royalty dollars, use the state electricity fuel mix comparison.
BLM describes several financial obligations in federal coal leasing, including rentals, bonuses and production royalties. This study selects the ONRR Royalties revenue type. The sum of that revenue type cannot stand in for every payment connected to a federal coal lease. The BLM federal coal lease management page describes the distinct lease obligations. The EIA Annual Coal Report and table index publishes separate tables for coal production and other physical measures.
| Question | Use | Keep the boundary visible |
|---|---|---|
| How much federal coal royalty revenue did ONRR record? | Signed ONRR Federal land class, Coal commodity, Royalties | Fiscal year and nominal dollars |
| How much federal coal lease revenue was recorded? | Relevant ONRR revenue types for Federal and Coal | List the included payment categories |
| How much coal was produced? | EIA production table with a matching geography | Tons, period and table coverage |
| What did a state government receive? | ONRR disbursement table for the recipient and applicable scope | Recipient, period and whether the table isolates coal |
Does a state name in the receipt file identify the state government that got paid?
The state breakdown groups federal Coal royalty receipt rows by source state. For example, Wyoming accounts for $185,384,309.29 of the signed FY 2026 receipts. The amount belongs to federal receipts associated with the Wyoming rows in the data. The state name does not establish how much the Wyoming government received.
The DOI fiscal-year natural resource disbursements catalog describes a separate dataset covering distributions to recipients, including states and local governments. When comparing a receipt and a distribution, verify the agency, fiscal year, geography field and whether the recipient table actually has a coal-only amount. A total for a recipient category can cover several kinds of natural resource revenue. If the exact category is absent, the broader amount should keep its original label.
How much does ONRR record in federal coal royalties?
The 23-year comparison covers royalties from leases in ONRR’s Federal land class and Coal lease type. Use the dollar amount with its fiscal year, commodity and land classification.
Receipts rose between FY 2020 and FY 2022 before declining through FY 2026. The peak-to-endpoint result is not a claim that receipts fell in every year.
| Fiscal year | Federal coal royalties | Share of FY 2012 peak |
|---|---|---|
| 2004 | $417.58 million | 52.2% |
| 2008 | $673.98 million | 84.3% |
| 2012 | $799.33 million | 100.0% |
| 2016 | $536.57 million | 67.1% |
| 2020 | $354.43 million | 44.3% |
| 2022 | $491.65 million | 61.5% |
| 2024 | $420.65 million | 52.6% |
| 2026 | $236.76 million | 29.6% |
Which states accounted for FY 2026 receipts?
Every selected FY 2026 source row names a state. The table preserves the signed state totals, including zero-valued aggregates and the negative amount, so its values reconcile to the national sum.
| Source state | FY 2026 net receipts in dollars | Share of national net receipts |
|---|---|---|
| Wyoming | 185,384,309.29 | 78.3% |
| Colorado | 25,073,316.08 | 10.6% |
| Montana | 24,573,910.18 | 10.4% |
| North Dakota | 2,961,207.58 | 1.3% |
| Alabama | 1,937,689.25 | 0.8% |
| New Mexico | 0.00 | 0.0% |
| Oklahoma | 0.00 | 0.0% |
| Utah | -3,172,985.39 | -1.3% |
How should negative source-state receipts be read?
A negative annual state aggregate is a signed result in the revenue file. It does not show that coal production was negative. Keeping it in the sum gives the same national accounting basis as the underlying records.
The signed oil and gas royalties study shows how a positive-only calculation changes a separate ONRR royalty series.
Which coal receipts are outside this comparison?
This study excludes ONRR’s Native American land class, other lease types, and nonroyalty receipts such as rents or bonuses. Private and state land revenues are outside the underlying data.
The state label describes the source of the collections. Payments to a state government require recipient-based disbursement records.
How much came from the three largest source states?
Wyoming, Colorado and Montana contributed $235.03 million combined in FY 2026. The other five reported state aggregates netted to $1.73 million. The residual includes a negative Utah amount. Its small net size does not mean all receipts outside the top three were that small before signed entries were combined.
The official national reconciliation uses the signed total. The positive-only total below illustrates how removing negative state aggregates changes the denominator. It sums positive net amounts at the state level and says nothing about the gross value of transactions within each state.
| Denominator | FY 2026 total | Top-three dollars | Top-three share |
|---|---|---|---|
| All eight source-state aggregates, signed | $236.76 million | $235.03 million | 99.27% |
| Positive source-state aggregates only | $239.93 million | $235.03 million | 97.96% |
How do annual averages compare across the series?
The FY 2020 to FY 2026 average was $394.99 million a year. That was 36.8% below the FY 2004 to FY 2012 average of $625.40 million. The middle window, FY 2013 to FY 2019, averaged $595.02 million.
The first window ends at the observed peak, and the remaining 14 years split into two seven-year windows. The first has nine observations. Comparing means rather than sums accounts for those unequal lengths. These are descriptive windows in nominal dollars. The dates do not establish separate regulatory or production regimes.
| Fiscal-year window | Years in denominator | Mean annual royalties |
|---|---|---|
| FY 2004 to FY 2012 | 9 | $625.40 million |
| FY 2013 to FY 2019 | 7 | $595.02 million |
| FY 2020 to FY 2026 | 7 | $394.99 million |
How large was the latest fall relative to earlier falls?
The FY 2026 fall of $161.18 million was the largest in the series on both bases. A dollar comparison subtracts one nominal total from the next. The percentage comparison divides the change by receipts in the prior year, so a lower starting level can make a smaller dollar change look larger in percentage terms.
The table ranks the three largest dollar decreases and shows their own prior-year denominators. Its order is a dollar ranking. The percentage column describes the same pairs and should be ranked separately if the question is about relative declines.
| Later fiscal year | Prior-year receipts | Later-year receipts | Dollar decrease | Decrease relative to prior year |
|---|---|---|---|---|
| 2026 | $397.94 million | $236.76 million | $161.18 million | 40.5% |
| 2020 | $504.56 million | $354.43 million | $150.13 million | 29.8% |
| 2016 | $682.83 million | $536.57 million | $146.26 million | 21.4% |
Did receipts fall every year after the peak?
There were 5 annual increases and 9 annual decreases from FY 2013 through FY 2026. FY 2022 receipts were $491.65 million, up $137.22 million from FY 2020. By FY 2026 they were $236.76 million, below the FY 2020 amount.
The count captures direction rather than the dollar weight of each move. Several increases can coexist with a lower ending level if the cumulative declines are larger. Use the national series to reproduce the count. The state breakdown is only available for FY 2026 in this export.
Which geography and dollar basis should stay with the quote?
Describe the state concentration as a share of signed Federal coal lease royalty receipts in a particular fiscal year. ONRR’s source-state label indicates where receipts are recorded, while a disbursement label indicates who received a distribution. Neither label gives a coal tonnage share.
The national historical calculations use nominal dollars across the complete FY 2004 to FY 2026 window. Negative values and zero-valued state aggregates remain in the table. The absence of a state from the selected FY 2026 rows is a different observation from an explicitly zero-valued aggregate.
How do you reproduce the FY 2026 total without counting the same receipts twice?
Filter the download to FY 2026. The row labeled United States reports $236,757,446.99 and the 8 named-state rows form a breakdown of that same amount. To reproduce the national figure, either read the single United States row or sum the named-state values, keeping every sign, including Utah’s −$3,172,985.39.
If you add both levels of geography in the FY 2026 slice, you get $473,514,893.98. That amount is exactly twice the correct result, a quick diagnostic that a national summary row was combined with its component rows. The CSV stores the same-year national denominator on each state row for the share calculation. Use the state receipt field to rebuild the total. Summing the repeated denominator field also counts the same dollars more than once.
Can you divide a federal coal receipt total by a state’s total production?
A division such as federal coal royalty receipts associated with Wyoming divided by all Wyoming coal production would mix two scopes unless the production table isolates the matching federal population. The EIA Annual Coal Report and table index contains distinct production, mine, reserve and price tables. Identify the output measure, time basis, land coverage and geography on the selected table before attempting a receipts-per-ton calculation.
Even with matching time and land coverage, a dollar-per-ton quotient is a realized aggregate relationship under the study’s signed-receipt method. A lease royalty rate is a different measure. A statement about the rate on a particular lease requires that lease’s applicable terms and an appropriate valuation base. A trend in dollars alone does not establish a trend in output or the rate.
How should you handle a zero or an absent state row?
New Mexico and Oklahoma have explicit zero rows in the FY 2026 breakdown. A zero describes the signed total in those published rows for the selected year. A state absent from this snapshot has no reported row here. Earlier fiscal years in the study download have national rows only, so the state figures cannot be carried backward to fill a chart.
A reviewer making a state comparison should preserve the difference between a recorded zero and a blank in the selected dataset. A state total can also be zero when underlying signed entries offset one another. The state aggregate alone cannot distinguish that situation from rows that each carried zero dollars. See the ONRR revenue downloads and field definitions for the agency revenue file’s fields.
How should you label a federal coal royalty statistic in an article?
A citation can state “ONRR recorded $236,757,446.99 in signed federal coal royalty receipts in FY 2026.” For a state statement, use “ONRR recorded $185,384,309.29 in FY 2026 federal coal royalty receipts associated with Wyoming in its source data.” The same qualifier belongs in a chart title, table heading or image caption that could be read without the article.
To reproduce a different fiscal year, use the United States row for that year and the same Federal, Coal and Royalties filters when checking the agency source. Keep nominal dollars distinct from constant-dollar figures in other studies. For a rate or production headline, select the appropriate underlying measure before interpreting a change in royalty dollars.
Did federal coal royalties settle at a lower annual level?
A period median shows the middle annual amount rather than the first or last observation. Divide the national fiscal-year series into three blocks. The first ends at the FY 2012 annual high. The remaining years are divided into two consecutive seven-year blocks. Those boundaries provide an explicit descriptive comparison and do not assert a statistical break or identify its cause.
The late period’s highest amount, $491,649,116.62, was below the early period’s median of $673,981,245.55. The ranges still overlap. Some individual years in the early block were below the highest years in the late block. A median is a claim about the middle observation and does not imply that every value in one block was higher than every value in another.
The denominator is the number of national observations shown. No state breakdown rows are included. The amounts are signed and nominal. A purchasing-power comparison would require an independently specified constant-dollar series.
| Fiscal-year window | Annual observations | Lowest nominal year | Median nominal year | Highest nominal year |
|---|---|---|---|---|
| FY 2004 to 2012 | 9 | $417,577,130.52 | $673,981,245.55 | $799,327,818.38 |
| FY 2013 to 2019 | 7 | $486,034,328.90 | $557,948,876.00 | $699,755,058.65 |
| FY 2020 to 2026 | 7 | $236,757,446.99 | $397,936,718.44 | $491,649,116.62 |
Did typical year-to-year swings get bigger as the receipt base fell?
For each adjacent pair within a window, take the size of the change regardless of its direction. The dollar column reports the median of those absolute changes. To get the percentage column, divide each absolute change by the receipts in its own prior year before taking the median. An amount that looks similar in dollars can represent a larger movement relative to a smaller starting receipt base.
The early and late median dollar changes differ by only $132,492.00. Their median percentage changes differ by 1.83 percentage points. The middle period has smaller typical changes under both measures. These medians summarize size without showing direction. They also exclude the changes crossing each block boundary, so the count of pairs is one less than the number of fiscal years in that block.
For an even number of changes, sort the absolute changes and average the two middle values. Do this separately for dollars and percentages. The two median changes can correspond to different years because the prior-year receipts vary across pairs. Multiplying the median percentage change by the median receipt level therefore need not reproduce the dollar result.
| Fiscal-year window | Within-window adjacent pairs | Median absolute change, nominal dollars | Median absolute change, percent of prior year |
|---|---|---|---|
| FY 2004 to 2012 | 8 | $44,361,496.00 | 8.30% |
| FY 2013 to 2019 | 6 | $19,949,222.50 | 3.90% |
| FY 2020 to 2026 | 6 | $44,229,004.00 | 10.12% |
How do these royalty measures relate to published coal industry statistics?
The EIA Annual Coal Report separates physical production, price and mine characteristics into different tables. The CRS report on U.S. coal industry trends uses EIA data to describe where U.S. production is concentrated. The volatility figures here use a different measure, signed receipts associated with federal coal, so a comparison needs to carry both the dollar-versus-ton distinction and federal land coverage.
The GAO federal royalty study and fiscal-year alignment notes illustrates another necessary check. In its 2017 analysis, GAO aligned monthly EIA observations to federal fiscal years for a comparison with ONRR. Matching the period is only one step. An explanation of receipt changes would also need comparable production, prices and lease or accounting evidence. This series identifies when and by how much recorded receipts moved.
How does this compare with other published research?
These sources address related questions using different measures. The table shows how to use them alongside this study.
Publications reviewed for this comparison. ONRR / DOI. U.S. Energy Information Administration. Congressional Research Service. U.S. Government Accountability Office.
| Publisher | What the publication covers | How AMR extends the comparison |
|---|---|---|
| ONRR / DOI | The metadata identifies the fiscal calendar product and its commodity and revenue-type fields. | Use signed Federal, Coal and Royalties data for the national calculations. |
| U.S. Energy Information Administration | The annual report lists national coal production, mine, reserve and price measures. | Use for distinguishing dollars from tons and production from reserves. |
| Congressional Research Service | The production section compares state shares of U.S. coal production and discusses federal lands. | Keep geography and the measure in any comparison. |
| U.S. Government Accountability Office | The fiscal year 2016 analysis explains the alignment of EIA monthly observations with ONRR fiscal data. | Use the time alignment check and retain a separate current-series benchmark. |
How did AMR reconcile the geographic and national totals?
AMR summed signed ONRR amounts by fiscal year. For FY 2026 it grouped the same records by source state and required every selected row to have a named state. The eight state aggregates sum exactly to the national figure before rounding.
The decline and state shares use the exact nominal sums. The CSV retains cents and differentiates the national observations from the FY 2026 state observations.
Sources and data
- ONRR original fiscal-year natural resource revenue CSV
- Department of the Interior coverage and metadata
- BLM federal coal lease management
- EIA Annual Coal Report and table index
- ONRR revenue downloads and field definitions
- DOI fiscal-year natural resource disbursements catalog
- CRS report on U.S. coal industry trends
- GAO federal royalty study and fiscal-year alignment notes
Download the data (CSV) · Read the data dictionary. The AMR analysis and figures are licensed CC BY 4.0. Refer to the original issuers for their materials. Read the calculation data guide.
Calculation data guide
The analysis download gives each calculated measure, evidence period, numeric value, unit, and formula. Follow its source data URL for the input rows and use the period and unit when quoting the result.