Key takeaways
- Removing negative entries would overstate ONRR’s FY 2014 federal oil and gas royalties by $195.79 million, the largest dollar difference from FY 2004 through FY 2026. The comparison holds all other ONRR source filters fixed.
- The largest proportional overstatement would be 2.7% of net royalties in FY 2016. This divides the magnitude of negative rows by the signed total, not the nonnegative subtotal.
- ONRR’s FY 2026 federal oil and gas royalty file contains 62 negative rows in the selected subset, totaling negative $9.40 million. Rows are published data groupings. They do not identify or count individual payment transactions.
- Across FY 2004 through FY 2026, dropping negative entries would add $1.41 billion to ONRR’s signed federal oil and gas royalty total of $208.71 billion, an overstatement of 0.68%. AMR sums the negative-entry gaps over all 23 years and divides by the sum of signed annual totals, using nominal dollars.
- The five largest annual omission gaps account for 55.4% of the total negative-entry magnitude across FY 2004 through FY 2026. The five years contribute $781.10 million of $1.41 billion in total omitted amounts.
- Dropping negative entries changes the rank of only two years in ONRR’s 23-year federal oil and gas royalty series. FY 2015 and FY 2018 swap 16th and 17th place. The comparison ranks the same years by signed nominal total and by nonnegative subtotal, with the largest value ranked first.
- In 15 of 23 fiscal years, omitting negative entries would raise the federal oil and gas royalty total by less than 1% of its signed value. The median annual percentage gap was 0.34%, giving each fiscal year equal weight.
- FY 2020 had the most negative published federal oil and gas royalty rows in ONRR’s FY 2004 through FY 2026 series, 95 of 1,205, or 7.88%. The greatest negative dollar subtotal occurred in FY 2014. The count and share use published fiscal-year rows. The dollar comparison uses the magnitude of the signed negative subtotal.
- ONRR recorded 57 negative federal oil and gas royalty rows in both FY 2006 and FY 2013, yet the negative subtotal magnitude was $292,156.50 in FY 2006 and $138,740,738.46 in FY 2013. Identical counts of published rows corresponded to very different dollar magnitudes. The rows are public aggregates.

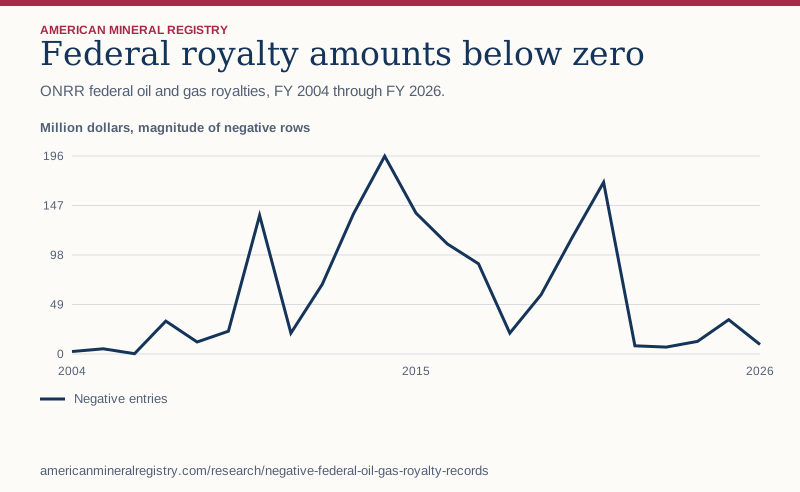
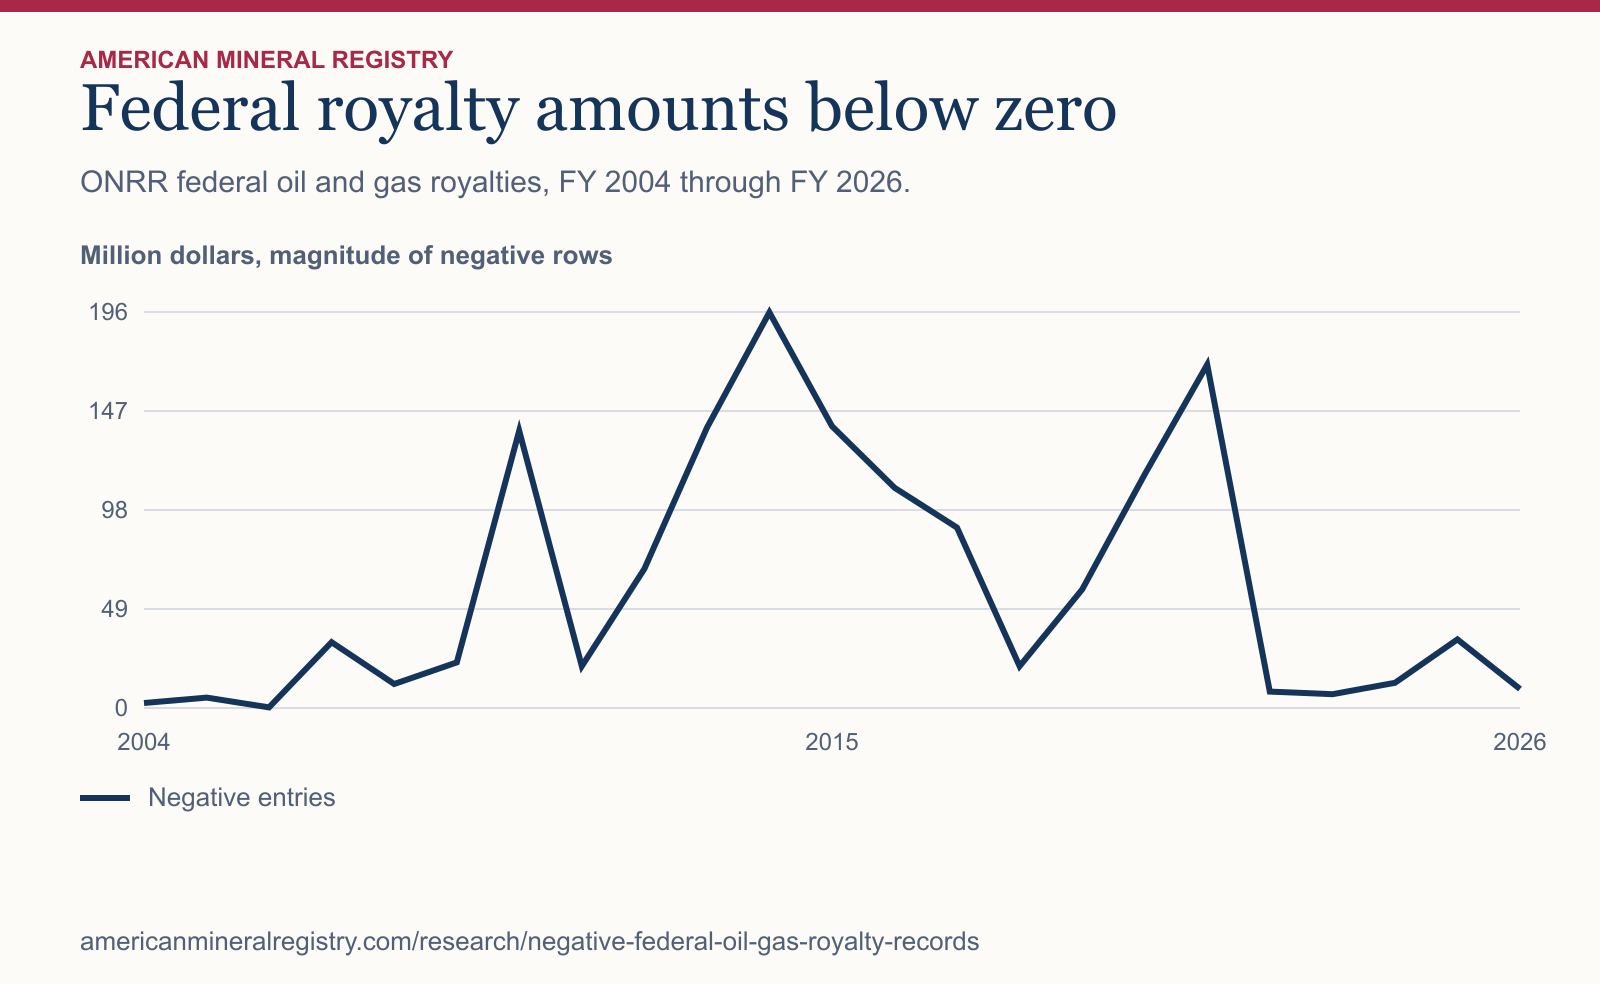
Figure 1 in text
ONRR federal oil and gas royalties, FY 2004 through FY 2026. Million dollars, magnitude of negative rows.
| Fiscal year | Negative entries |
|---|---|
| 2004 | 2.48 |
| 2005 | 5.16 |
| 2006 | 0.29 |
| 2007 | 32.57 |
| 2008 | 11.88 |
| 2009 | 22.60 |
| 2010 | 137.20 |
| 2011 | 20.66 |
| 2012 | 68.89 |
| 2013 | 138.74 |
| 2014 | 195.79 |
| 2015 | 139.44 |
| 2016 | 108.96 |
| 2017 | 89.27 |
| 2018 | 20.67 |
| 2019 | 58.74 |
| 2020 | 115.69 |
| 2021 | 169.94 |
| 2022 | 8.08 |
| 2023 | 6.82 |
| 2024 | 12.48 |
| 2025 | 33.91 |
| 2026 | 9.40 |
Chart wording and scale
Federal royalty amounts below zero ONRR federal oil and gas royalties, FY 2004 through FY 2026.
Million dollars, magnitude of negative rows 0 49 98 147 196 2004 2015 2026 Negative entries
Source and data: Download chart source data
Permanent link to this figure’s text and data · Sources and context
Which federal oil and gas royalty figure should a reader quote?
For recorded royalty receipts, use the signed net of all matching revenue rows. For the scale of the negative entries, use the magnitude of the negative subtotal and identify it as such. For their prevalence, count negative rows and divide by the count of all selected source rows. Each measure describes a different feature of the same extract.
The ONRR revenue downloads and field definitions describes the fields in ONRR’s aggregate revenue file. A row count in this study is a count of published fiscal file rows that match the filters. An individual payment, company, owner or lease count would require a source with that specific unit. Keep the phrase “published revenue rows” next to a percentage calculated from the row count.
| Reader’s question | Use | Denominator or unit |
|---|---|---|
| What did ONRR record in royalties? | Sum all selected signed Revenue amounts | Nominal dollars for the fiscal year |
| How many source rows are negative? | Count rows with Revenue below zero | Published source rows |
| What fraction of the rows are negative? | Count negative rows and divide by all selected rows | Negative, zero and positive rows |
| How much does omitting negatives inflate the total? | Divide the omitted dollars by the signed net | Signed net royalty dollars for the same scope |
What does the sign on a published ONRR row describe?
The public fiscal-year extract groups revenue records across reporting fields. A negative value establishes the sign of the amount on that published row. The row does not expose a transaction history or provide a reason code that establishes a specific refund, correction or payment reversal. See the DOI fiscal-year natural resource revenue catalog and ONRR revenue downloads and field definitions.
A row can have the same dollar amount as another row and still represent a different combination of reporting fields. When reproducing the study, filter the source rows by the documented fields and aggregate all selected values. If a duplicate-looking row raises a quality question, compare the full reporting fields and source release before dropping anything. A repeated amount alone is insufficient evidence for a duplicate.
What happens if an analyst drops negative entries?
Adding only nonnegative entries gives a higher total than summing the same records with their original signs. The gap is the absolute value of the omitted negative amounts.
The table uses exact dollars. The reported net is the nonnegative subtotal plus the signed negative subtotal.
| Fiscal year | Nonnegative rows, USD | Negative rows, USD | Net royalties, USD | Overstatement if omitted |
|---|---|---|---|---|
| 2004 | 6,304,296,953.59 | -2,484,182.51 | 6,301,812,771.08 | 0.0% |
| 2014 | 9,448,147,904.12 | -195,787,186.75 | 9,252,360,717.37 | 2.1% |
| 2016 | 4,075,887,288.03 | -108,964,440.31 | 3,966,922,847.72 | 2.7% |
| 2021 | 7,701,583,188.72 | -169,937,804.09 | 7,531,645,384.63 | 2.3% |
| 2026 | 15,432,221,391.37 | -9,401,997.72 | 15,422,819,393.65 | 0.1% |
Why do the two largest gaps occur in different years?
FY 2014 had the largest dollar magnitude of negative rows. FY 2016 had the largest gap relative to its signed total because the base was smaller.
With net receipts of $3.97 billion in FY 2016, omitting about $108.96 million raised the implied result by 2.7%.
Can a negative line be assigned to a refund or a specific owner?
The public CSV gives a signed aggregate at its published dimensions. It does not show transaction-level reasons or identify private royalty owners. The study measures the accounting effect of the sign and makes no inference about an individual entry’s cause.
The downloadable count is the number of published rows with a value below zero. Aggregation can net underlying transactions before they enter the file.
How should the original figures be reproduced?
Keep signs when adding ONRR amounts. Store the positive or zero subtotal, the negative subtotal and the signed net as separate fields when auditing the result. This makes it easy to spot a filter that unintentionally drops negative values.
The onshore and offshore comparison uses signed totals for the underlying collections.
How large is the effect across the whole file?
The 23 signed annual totals sum to $208.71 billion. The sum of the nonnegative rows is $210.12 billion, higher by $1.41 billion. That is 0.68% of the signed total. This pooled percentage weights years by their net royalty dollars.
The 1,054 negative rows represent 4.17% of the 25,268 included rows. Row count and dollar magnitude have different denominators. A published row can aggregate underlying amounts. A negative row should not be treated as one refund or one payor.
Which years account for most of the omitted dollars?
The five largest omission gaps total $781.10 million, or 55.4% of the 23-year omission magnitude. Rank years by the absolute dollar value of the negative subtotal. For the same five years, the last column shows each gap divided by that year’s signed total.
The ranking is based on nominal dollars and does not adjust for changes in purchasing power. Its share of total omitted dollars answers a different question from the largest annual overstatement percentage. The latter uses each fiscal year’s own net as its denominator.
| Fiscal year | Gap if negative rows are dropped | Negative rows | Gap as share of signed year |
|---|---|---|---|
| 2014 | $195.79 million | 41 | 2.12% |
| 2021 | $169.94 million | 83 | 2.26% |
| 2015 | $139.44 million | 46 | 2.10% |
| 2013 | $138.74 million | 57 | 1.56% |
| 2010 | $137.20 million | 40 | 2.16% |
Does keeping the signs change the ranking of annual receipts?
The 16th and 17th places swap. FY 2018 is $69.33 million above FY 2015 on signed totals, but FY 2015 is $49.43 million above FY 2018 when negative rows are dropped. The other 21 rank positions stay the same.
Stable rankings for most years do not make the nonnegative totals accurate. Close comparisons can reverse even when the biggest years remain in order. Use the unrounded source dollars to rank, then round the displayed amounts.
| Fiscal year | Signed net | Rank with signs | Nonnegative subtotal | Rank without negative rows |
|---|---|---|---|---|
| 2015 | $6.65 billion | 17 | $6.79 billion | 16 |
| 2018 | $6.72 billion | 16 | $6.74 billion | 17 |
How does the relative gap compare across multi-year windows?
Sum the omitted dollars within each window and divide by the signed receipts over those same years. The three windows span the file in order, with seven observations in the first and eight in each later window. They are descriptive segments rather than inferred changes in reporting policy.
The median of the 23 individual annual percentages is 0.34%. It describes the middle annual observation, while the window ratios below describe the error on a combined dollar total. A claim should name which statistic it uses.
| Fiscal-year window | Years in denominator | Omitted dollars | Signed royalties | Gap as share of signed total |
|---|---|---|---|---|
| FY 2004 to FY 2010 | 7 | $212.19 million | $57.86 billion | 0.37% |
| FY 2011 to FY 2018 | 8 | $782.42 million | $58.07 billion | 1.35% |
| FY 2019 to FY 2026 | 8 | $415.06 million | $92.78 billion | 0.45% |
What would an analyst retain to audit a negative-entry claim?
Retain the fiscal year, scope filter, two subtotals, their row counts and the signed result. A useful reconciliation checks both the identity that the two subtotals sum to net and the count of rows included in each subset. Keep the source file edition with the result if ONRR later revises a historical figure.
The file classifies federal oil and gas royalty records by published reporting dimensions. A negative subtotal shows what the sign contributes to the annual sum. It cannot establish whether an amount was a refund, a correction or some other adjustment without separate source evidence.
How can you test whether a spreadsheet preserved the minus signs?
Use the FY 2025 row as a fixture. First, find 1,117 nonnegative rows and 59 negative rows, for 1,176 matching source rows. Second, subtotal them separately. The nonnegative amount is $12,891,001,488.47 and the negative amount is −$33,914,704.66. Third, add the signed subtotals to recover $12,857,086,783.81.
Two common sign mistakes produce different totals, shown below. If your spreadsheet matches one of them, inspect its filter or conversion formula. The check is strongest when the two subtotals and both counts also match. An error can cancel elsewhere in the file and leave the final sum looking plausible.
| FY 2025 treatment | Computed total | Difference from signed net |
|---|---|---|
| Keep source signs | $12,857,086,783.81 | $0.00 |
| Exclude the negative rows | $12,891,001,488.47 | $33,914,704.66 |
| Replace negative amounts with their magnitudes | $12,924,916,193.13 | $67,829,409.32 |
What should you check when importing the agency’s revenue field?
Parse the CSV as a delimited file so that commas inside quoted fields stay inside their own cells. Inspect a known negative amount after import, then confirm the revenue column contains numeric values with cents. A numeric spreadsheet sum can silently ignore text cells, so also compare the count of parsed numbers with the count of selected source rows.
For the partition, put values strictly below zero in the negative group and values greater than or equal to zero in the nonnegative group. A blank or unparsable value fails the numeric check. An explicit zero passes it and belongs in the row count. Keep cents during import and addition, then round only for the displayed result. This preserves the dollar bridge and avoids small differences when a reader re-sums it.
Will the number of negative rows agree between the monthly and fiscal-year files?
Row counts depend on the grain of the published extract. The DOI monthly natural resource revenue catalog and DOI calendar-year natural resource revenue catalog describe distinct DOI products. A negative month can be combined with a positive month when an aggregate is published for a longer period. Counting signs before and after aggregation can therefore yield different answers.
To reproduce this study, use the fiscal file and count its source rows after filtering Land Class = Federal, Mineral Lease Type = Oil & Gas and Revenue Type = Royalties. To study months, select the monthly file, confirm that the full target period is covered, and report the monthly grain. Calling a negative monthly row a negative fiscal-year row changes the unit being counted, even when the filters have the same names.
How can an article explain a negative subtotal without guessing its cause?
A stand-alone citation can read “The 59 negative FY 2025 federal oil and gas royalty rows in ONRR’s fiscal-year revenue data summed to −$33,914,704.66.” If the article is about the financial impact of omitting these rows, the signed net of $12,857,086,783.81 is the comparison amount and the omitted dollars are $33,914,704.66.
Use separate evidence for any statement about a specific refund, payer, lease or recipient. For a claim about money that was actually distributed, check the recipient publication and keep its scope visible. The DOI fiscal-year natural resource disbursements catalog identifies disbursements as a separate series. Linking both series with clear labels lets readers see why negative receipt rows cannot be read as a count of money sent back.
Was the year with the most negative rows also the largest dollar year?
A count and a dollar subtotal describe different aspects of the published file. For a frequency measure, count fiscal-year rows below zero and divide by all selected rows, including explicit zeros. For a dollar measure, add the negative values with their source signs and take the magnitude of that subtotal when ranking the size of the effect. This keeps the choice of denominator visible.
Among the 23 fiscal years, FY 2020 leads on both the raw negative row count and its share of selected rows. FY 2014 leads on negative subtotal magnitude with less than half as many negative rows. A headline about frequency should identify the rows and their denominator. A headline about impact should state the subtotal or the signed-net comparison used to measure impact.
| Fiscal year | Negative rows | All selected rows | Negative row share | Negative subtotal magnitude |
|---|---|---|---|---|
| FY 2014 | 41 | 1125 | 3.64% | $195,787,186.75 |
| FY 2020 | 95 | 1205 | 7.88% | $115,693,668.75 |
How much can negative dollar totals differ at the same row count?
FY 2006 and FY 2013 have the same number of negative published rows. Dividing each negative subtotal magnitude by its row count gives a mean of $5,125.55 per negative row in FY 2006 and $2,434,048.04 in FY 2013. The FY 2013 subtotal was about 475 times the FY 2006 subtotal magnitude. The denominator stays fixed for the comparison, so the same multiple applies to the mean amounts.
The average belongs to a published aggregate row. It cannot describe the average size of an underlying refund or adjustment. These two years are a concrete matched-count example. They do not estimate how dollar impact changes as row frequency rises across the full series. To check the figures, keep the same selected rows for the count and dollar subtotal, retain precision through division, and round only the displayed averages.
The equal counts also expose a different denominator issue. The number of selected rows differs between FY 2006 and FY 2013, so the same number of negative rows gives a different prevalence in each year. For comparisons across releases, match the file grain and filter before using row counts as a diagnostic. If either changes, rebuild both the numerator and denominator.
| Fiscal year | Negative rows | Negative subtotal magnitude | Mean magnitude per negative published row |
|---|---|---|---|
| FY 2006 | 57 | $292,156.50 | $5,125.55 |
| FY 2013 | 57 | $138,740,738.46 | $2,434,048.04 |
How do the public negative rows differ from GAO’s adjustment and refund measures?
The GAO federal oil and gas adjustments and refunds study analyzed separate ONRR summary adjustment data and grouped adjustments by the fiscal year of original royalty reporting. It separately analyzed completed refunds and requests. An article about either of those measures should use GAO’s definitions and period labels. The comparison here groups the signs already present on the public fiscal revenue rows and has no original-reporting-date or refund flag.
The DOI fiscal-year revenue catalog and DOI monthly revenue catalog document different published time grains. A frequency based on the monthly product answers a monthly-row question even if the same commodity and land class are selected. Neither the sign-based count nor the subtotal in this study establishes how many refunds ONRR processed. The source-level data GAO analyzed are a different route to that question.
How does this compare with other published research?
These sources address related questions using different measures. The table shows how to use them alongside this study.
Publications reviewed for this comparison. ONRR / DOI. ONRR / DOI. U.S. Government Accountability Office.
| Publisher | What the publication covers | How AMR extends the comparison |
|---|---|---|
| ONRR / DOI | The fiscal metadata describes annual reporting by land, location, revenue type and commodity. | Use the fiscal download to compute sign and count comparisons. |
| ONRR / DOI | The metadata describes the separate monthly revenue product. | Keep monthly row frequencies outside the fiscal-year denominator. |
| U.S. Government Accountability Office | The methodology distinguishes original-year net adjustments from analysis of refund requests and completions. | Cite the accounting boundary without assigning causes to negative public rows. |
Which records did AMR include?
AMR used ONRR’s fiscal-year file, selecting Federal land class, Oil & Gas lease type and Royalties revenue type. The study partitions every selected row by sign, then reconciles both subtotals to the unpartitioned exact total in every fiscal year.
The percentage uses signed net royalties as its denominator. The chart shows the magnitude of the negatives and the CSV retains their actual signs.
Sources and data
- ONRR original fiscal-year natural resource revenue CSV
- Department of the Interior coverage and metadata
- ONRR revenue downloads and field definitions
- DOI monthly natural resource revenue catalog
- DOI calendar-year natural resource revenue catalog
- DOI fiscal-year natural resource disbursements catalog
- GAO federal oil and gas adjustments and refunds study
Download the data (CSV) · Read the data dictionary. The AMR analysis and figures are licensed CC BY 4.0. Refer to the original issuers for their materials. Read the calculation data guide.
Calculation data guide
The analysis download gives each calculated measure, evidence period, numeric value, unit, and formula. Follow its source data URL for the input rows and use the period and unit when quoting the result.