Key takeaways
- FY 2026 federal oil and gas royalty collections were $15.42 billion. That includes $8.08 billion from onshore and $7.34 billion from offshore federal sources, in nominal dollars.
- Offshore supplied 47.6% of federal oil and gas royalty collections in FY 2026. This denominator includes the two federal source categories, with royalty receipts separated from lease bonuses and rents.

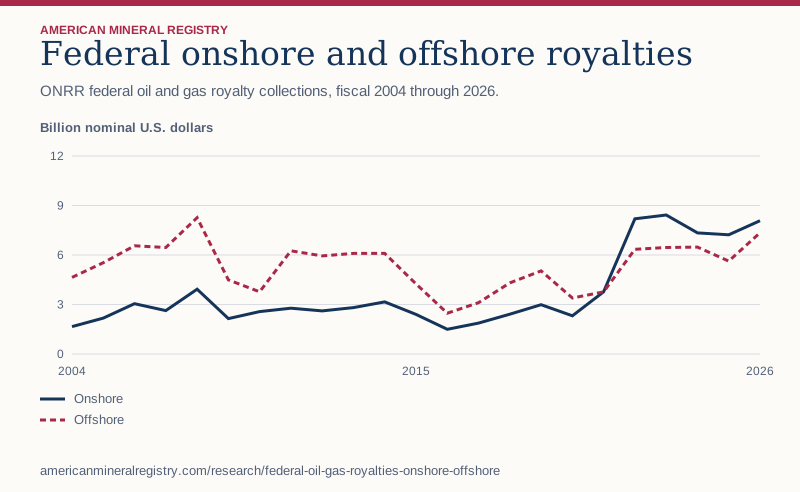
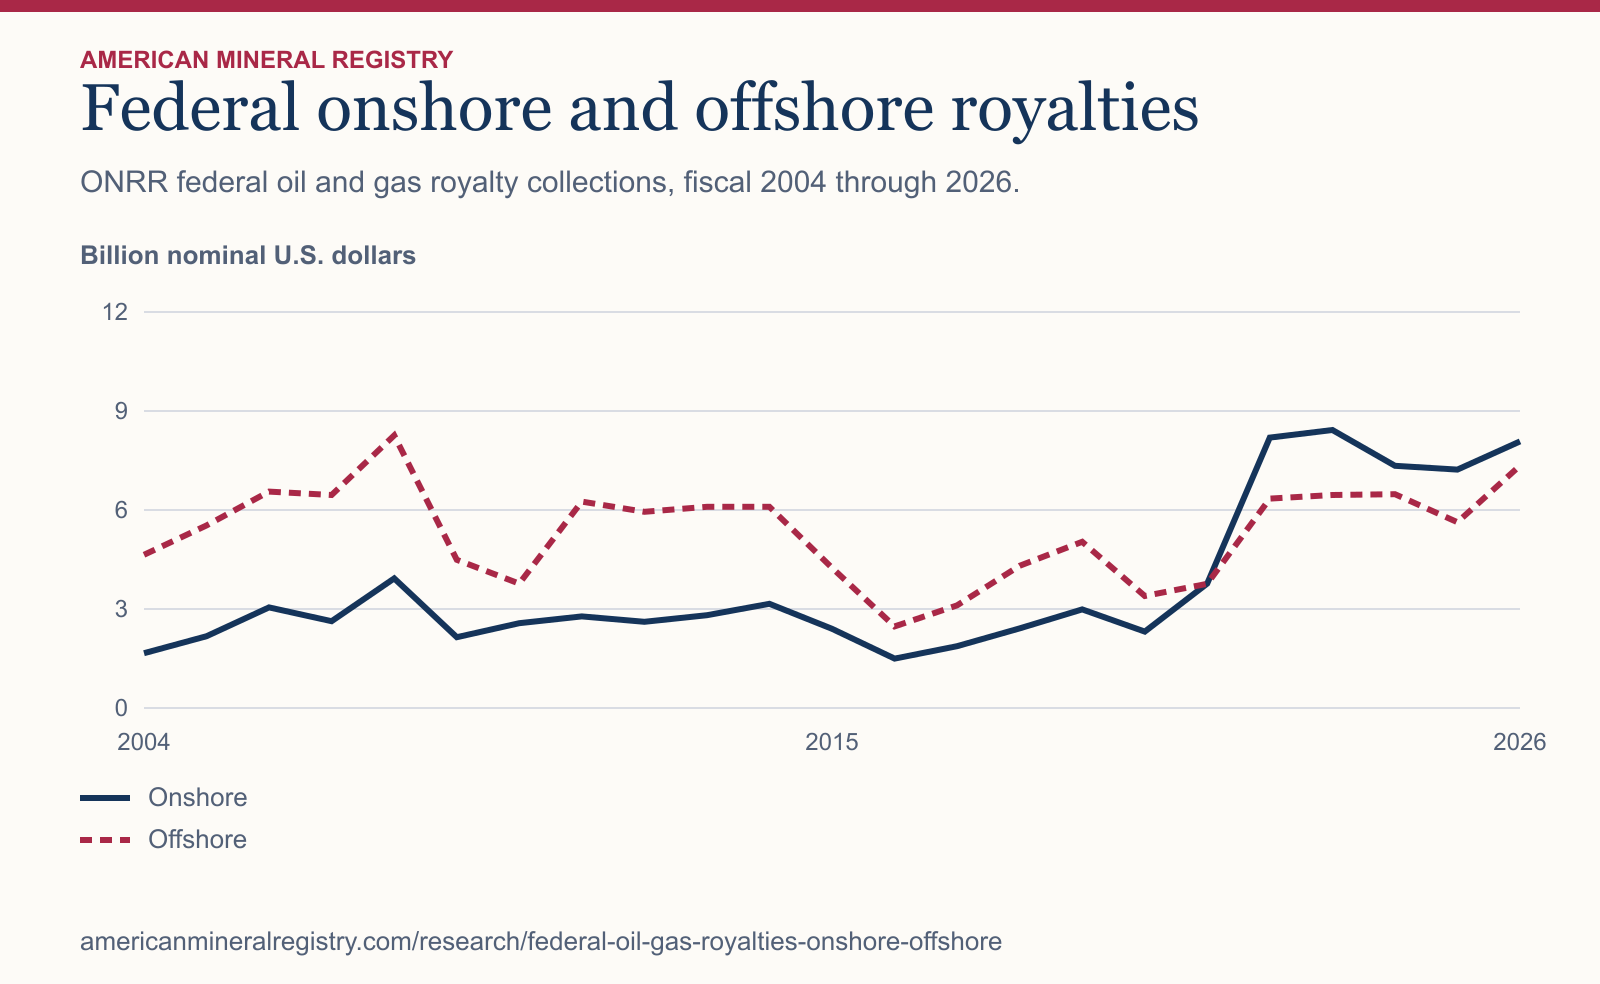
Figure 1 in text
ONRR federal oil and gas royalty collections, fiscal 2004 through 2026. Billion nominal U.S. dollars.
| Fiscal year | Onshore | Offshore |
|---|---|---|
| 2004 | 1.66 | 4.64 |
| 2005 | 2.17 | 5.53 |
| 2006 | 3.05 | 6.56 |
| 2007 | 2.63 | 6.45 |
| 2008 | 3.93 | 8.26 |
| 2009 | 2.15 | 4.49 |
| 2010 | 2.57 | 3.77 |
| 2011 | 2.78 | 6.25 |
| 2012 | 2.61 | 5.94 |
| 2013 | 2.81 | 6.10 |
| 2014 | 3.16 | 6.10 |
| 2015 | 2.40 | 4.25 |
| 2016 | 1.50 | 2.47 |
| 2017 | 1.87 | 3.11 |
| 2018 | 2.41 | 4.31 |
| 2019 | 2.99 | 5.04 |
| 2020 | 2.32 | 3.39 |
| 2021 | 3.77 | 3.76 |
| 2022 | 8.19 | 6.34 |
| 2023 | 8.42 | 6.45 |
| 2024 | 7.34 | 6.48 |
| 2025 | 7.23 | 5.63 |
| 2026 | 8.08 | 7.34 |
Chart wording and scale
Federal onshore and offshore royalties ONRR federal oil and gas royalty collections, fiscal 2004 through 2026.
Billion nominal U.S. dollars 0 3 6 9 12 2004 2015 2026 Onshore Offshore
Source and data: Download chart source data
Permanent link to this figure’s text and data · Sources and context
How much federal oil and gas royalty revenue came from offshore?
The annual table shows how the offshore share changes across fiscal years. The downloadable file has the complete period and exact dollar amounts.
| Fiscal year | Onshore federal royalties | Offshore federal royalties | Offshore share |
|---|---|---|---|
| 2022 | $8.19 billion | $6.34 billion | 43.6% |
| 2023 | $8.42 billion | $6.45 billion | 43.4% |
| 2024 | $7.34 billion | $6.48 billion | 46.9% |
| 2025 | $7.23 billion | $5.63 billion | 43.8% |
| 2026 | $8.08 billion | $7.34 billion | 47.6% |
What does the federal royalties figure include?
American Mineral Registry selected ONRR records classed Federal, Oil & Gas and Royalties. The calculation uses the Onshore and Offshore land categories. Private royalties, rents, bonuses and tribal-land revenue are outside that selection.
How do collections differ from government distributions?
Collections classify incoming revenue by source. A disbursement records money sent to a fund or recipient. The two ONRR files answer different questions and may cover different money and timings.
How did AMR calculate the offshore share?
AMR summed signed dollar entries by fiscal year and land category using decimal arithmetic. It divided each year’s offshore total by its combined federal royalty total. The median gives each fiscal year equal weight. Nominal values were left as reported.
Sources and data
Download the data (CSV) · Read the data dictionary. The AMR analysis and figures are licensed CC BY 4.0. Refer to the original issuers for their materials.