American Mineral RegistryResearch & data

How Much Oil and Gas Production Value Comes From Farmland?

Updated

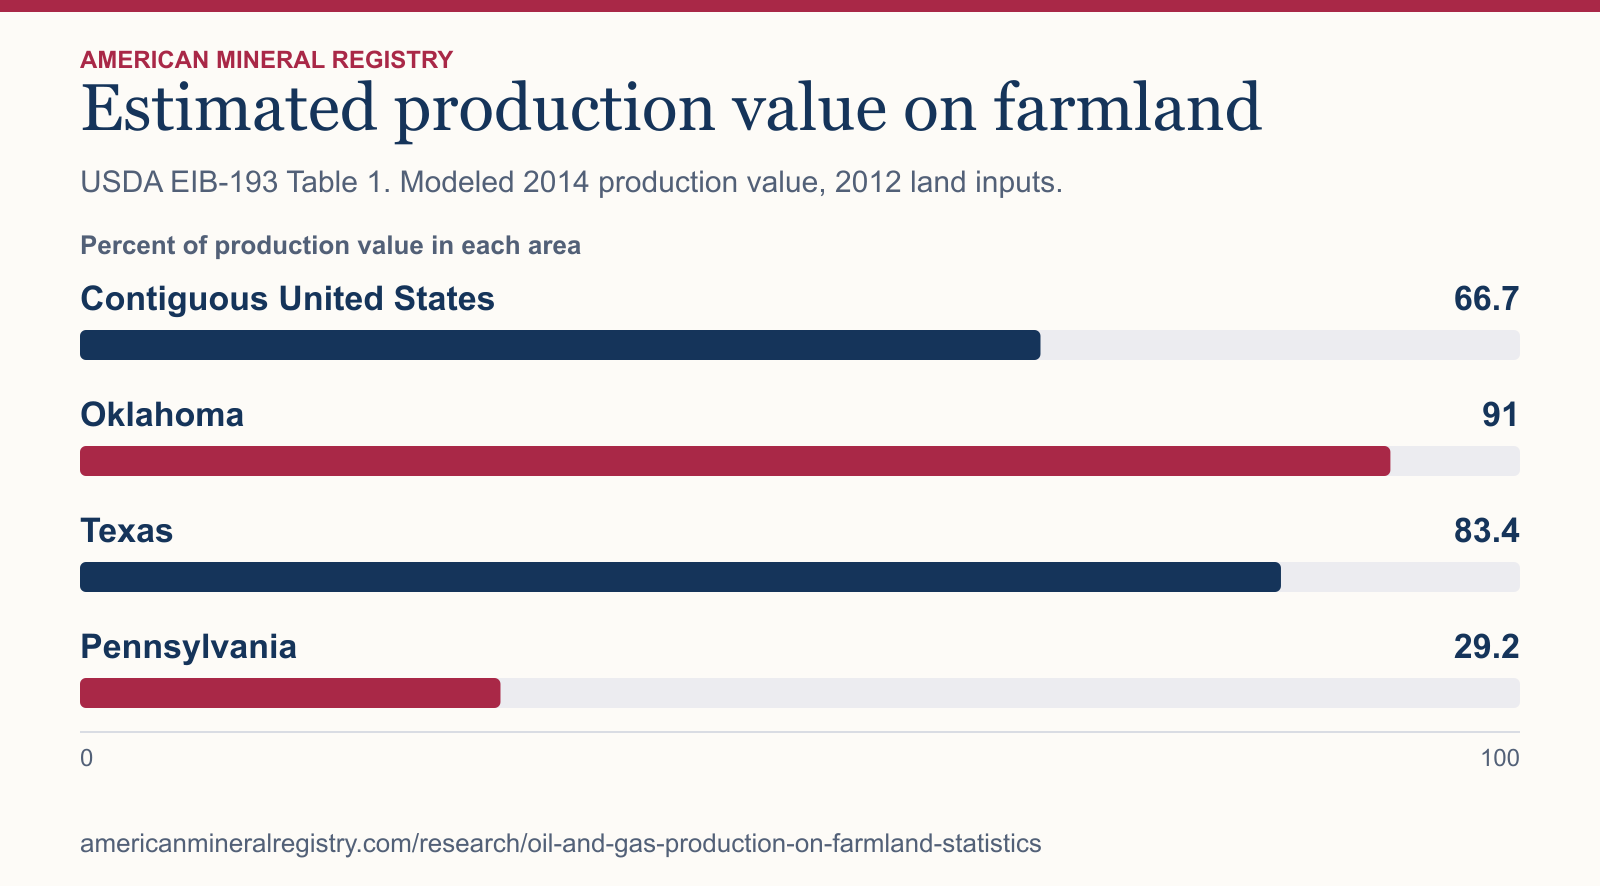
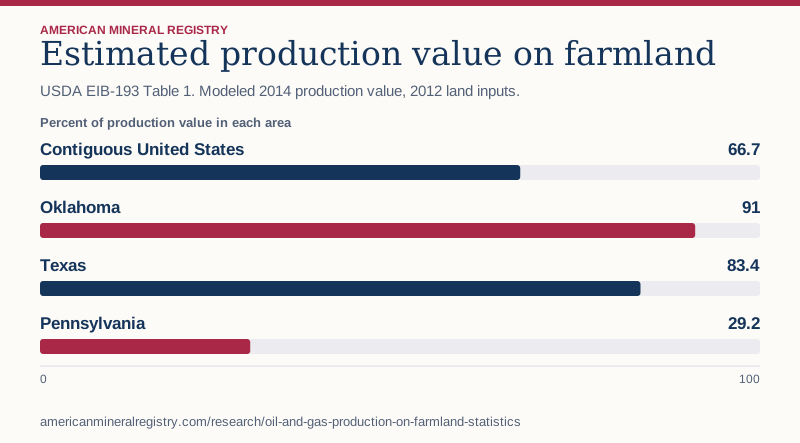
USDA estimated that farmland accounted for 66.7% of oil and gas production value in the contiguous United States in 2014. The estimate allocates county production value by the share of county land operated by farms, using 2012 agricultural land data.

On this page
  1. Key takeaways
  2. How does the estimated farmland share differ by state?
  3. How did USDA estimate oil and gas value on farmland?
  4. Does farmland production value measure what landowners receive?
  5. How should a writer quote the farmland percentage?
  6. Sources and data
  7. Cite this page

Key takeaways

  • USDA allocated an estimated $225.5 billion of $338.1 billion in 2014 oil and gas production value to farmland in the contiguous United States. AMR’s division of the two published amounts gives 66.7%. USDA EIB-193, Table 1.
  • The estimated farmland shares were 91.0% in Oklahoma, 83.4% in Texas and 29.2% in Pennsylvania in USDA’s 2014 production-value comparison. AMR divided each state’s modeled farmland value by its own total production value. These are three of six states shown in Table 1.
  • USDA reported that farmland covered 48% of the contiguous U.S. land area in 2012. This is a land-area share and a different measured year from the 2014 production-value share. It does not quantify mineral title or payment ownership.
Estimated production value on farmland. USDA EIB-193 Table 1. Modeled 2014 production value, 2012 land inputs. A complete table follows.
USDA EIB-193 Table 1. Modeled 2014 production value, 2012 land inputs. Percent of production value in each area. Download SVG · Download PNG · Download chart source data.

Figure 1 in text

USDA EIB-193 Table 1. Modeled 2014 production value, 2012 land inputs. Percent of production value in each area.

Percent of production value in each area
CategoryPercent of production value in each area
Contiguous United States66.7
Oklahoma91
Texas83.4
Pennsylvania29.2
Chart wording and scale

Estimated production value on farmland USDA EIB-193 Table 1. Modeled 2014 production value, 2012 land inputs.

Percent of production value in each area

Contiguous United States

66.7

Oklahoma

91

Texas

83.4

Pennsylvania

29.2 0 100

Source and data: Download chart source data

How does the estimated farmland share differ by state?

USDA’s 2014 estimates cover the contiguous United States and six named states in Table 1. AMR calculated each share within the geography shown.

GeographyTotal value, $ billionEstimated on farmland, $ billionEstimated share
Contiguous United States338.1225.566.7%
Texas138.5115.583.4%
Oklahoma22.120.191.0%
Pennsylvania19.25.629.2%
North Dakota36.526.672.9%
Ohio3.61.438.9%
Arkansas5.52.341.8%

How did USDA estimate oil and gas value on farmland?

USDA estimated the value of production in each county and allocated a share using the portion of land operated by farms. The authors then summed the county estimates. The method uses national energy prices and county-level oil and gas production data. It assumes equally likely leasing on farmland and other land for this estimation.

Does farmland production value measure what landowners receive?

Oil and gas production value estimates describe geography. Receipts to farm operators and landlords are a different measure. AMR compares those groups in its farm oil and gas payments study. A surface-use classification also cannot establish who owns a mineral interest.

How should a writer quote the farmland percentage?

Use the contiguous United States, 2014, production value and USDA’s allocation method in the same sentence. The report defines farmland as land operated by farms, including parts of farms that are neither cropland nor pasture. This historical estimate gives no current production or owner count.

Sources and data

  1. USDA Economic Research Service, EIB-193, page 4 and Table 1

Download the data (CSV) · Read the data dictionary. The AMR analysis and figures are licensed CC BY 4.0. Refer to the original issuers for their materials.

Cite this page

Finding and source

USDA estimated that land operated by farms accounted for $225.5 billion of $338.1 billion in oil and gas production value in the contiguous United States in 2014, or 66.7%. The model allocated county production value using county farmland shares. https://americanmineralregistry.com/research/oil-and-gas-production-on-farmland-statistics#key-takeaways

Bibliographic citation

American Mineral Registry. “How Much Oil and Gas Production Value Comes From Farmland?” November 2026. https://americanmineralregistry.com/research/oil-and-gas-production-on-farmland-statistics
Copy an individual finding
  • USDA allocated an estimated $225.5 billion of $338.1 billion in 2014 oil and gas production value to farmland in the contiguous United States. AMR’s division of the two published amounts gives 66.7%. USDA EIB-193, Table 1. Study scope: USDA modeled production value, 2014, with 2012 farmland inputs. https://americanmineralregistry.com/research/oil-and-gas-production-on-farmland-statistics#national-share
  • The estimated farmland shares were 91.0% in Oklahoma, 83.4% in Texas and 29.2% in Pennsylvania in USDA’s 2014 production-value comparison. AMR divided each state’s modeled farmland value by its own total production value. These are three of six states shown in Table 1. Study scope: USDA modeled production value, 2014, with 2012 farmland inputs. https://americanmineralregistry.com/research/oil-and-gas-production-on-farmland-statistics#state-comparison
  • USDA reported that farmland covered 48% of the contiguous U.S. land area in 2012. This is a land-area share and a different measured year from the 2014 production-value share. It does not quantify mineral title or payment ownership. Study scope: USDA modeled production value, 2014, with 2012 farmland inputs. https://americanmineralregistry.com/research/oil-and-gas-production-on-farmland-statistics#land-denominator
Download the citation sheet (text)