Key takeaways
- USDA estimated $7.437 billion in oil and gas payments for two U.S. agricultural groups in 2014. Farm operators accounted for $3.825 billion and non-operator landlords accounted for $3.612 billion in USDA EIB-193, Table 2.
- Oil and gas counties accounted for 96.2% of those estimated 2014 payments. The two agricultural groups received an estimated $7.152 billion in those counties out of the $7.437 billion national total.
- In oil and gas counties, payments equaled 37.1% of net cash farm income for non-operator landlords and 10.8% for farm operators in 2014. These are ratios of aggregate amounts within each USDA population. They are not the median share for individual households.
- USDA reported that 4.3% of farm operators and 4.9% of non-operator landlords reported oil and gas payments in 2014. Page 13 of EIB-193 reports receipt incidence, a different measure from payment dollars or the share of net cash farm income.

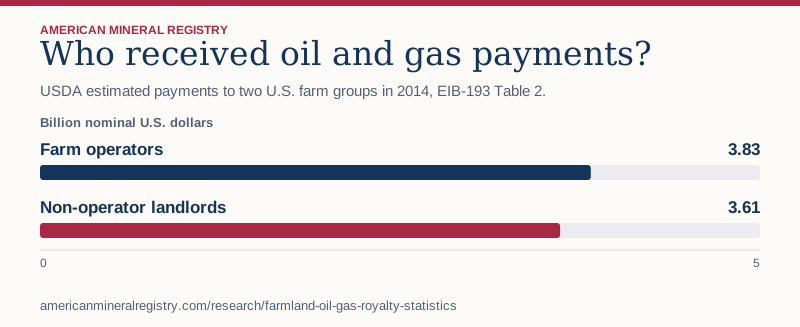
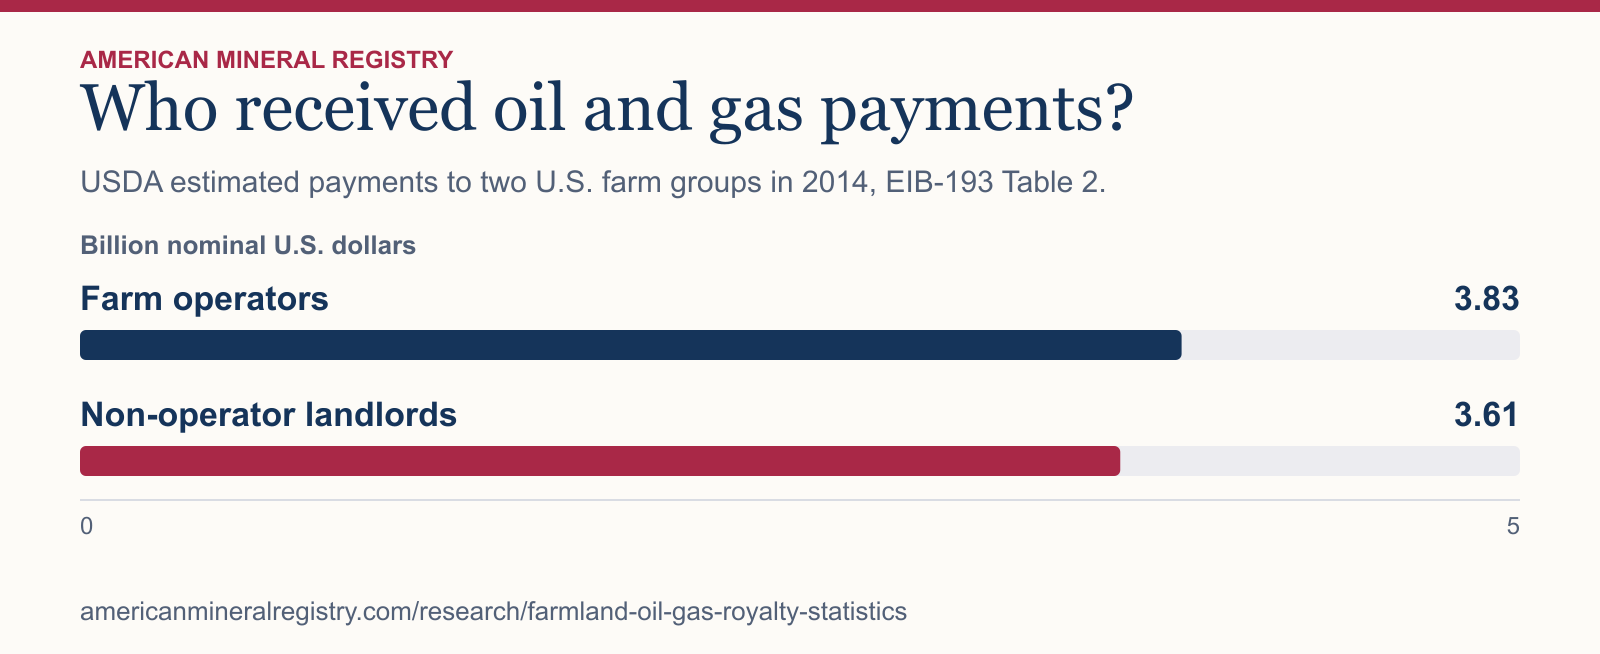
Figure 1 in text
USDA estimated payments to two U.S. farm groups in 2014, EIB-193 Table 2. Billion nominal U.S. dollars.
| Category | Billion nominal U.S. dollars |
|---|---|
| Farm operators | 3.83 |
| Non-operator landlords | 3.61 |
Chart wording and scale
Who received oil and gas payments? USDA estimated payments to two U.S. farm groups in 2014, EIB-193 Table 2.
Billion nominal U.S. dollars
Farm operators
3.83
Non-operator landlords
3.61 0 5
Source and data: Download chart source data
Permanent link to this figure’s text and data · Sources and context
Who received oil and gas payments on farmland?
USDA Table 2 separates farm operators, non-operator landlords and the combined population for the United States and for oil and gas counties.
| Population | Geography | 2014 payments, $ million | Share of net cash farm income | Rights value, $ million |
|---|---|---|---|---|
| Both groups | United States | 7,437 | 6.3% | 32,892 |
| Both groups | Oil and gas counties | 7,152 | 16.5% | 27,562 |
| Non-operator landlords | United States | 3,612 | 16.9% | 13,753 |
| Non-operator landlords | Oil and gas counties | 3,477 | 37.1% | 12,246 |
| Farm operators | United States | 3,825 | 4.0% | 19,140 |
| Farm operators | Oil and gas counties | 3,676 | 10.8% | 15,316 |
How much did oil and gas payments contribute to farm income?
In 2014 oil and gas counties, the combined groups’ oil and gas payments were 16.5% of aggregate net cash farm income. The national combined ratio was 6.3%. The denominator is net cash farm income for each published group and geography.
Does receiving a payment establish who owns mineral rights?
The USDA study reports payments and estimated rights values as separate measures. The two groups’ combined rights value was estimated at $32.892 billion in 2014. Neither that asset-value estimate nor receipt of payment establishes a current national owner count.
How were the farm royalty statistics calculated?
American Mineral Registry transcribed the six comparison rows from USDA Table 2 and divided $7.152 billion by $7.437 billion to calculate the 96.2% county share. The reported amount can include oil and gas-related payments. Published subgroup sums can differ slightly from the combined amount due to rounding.
Sources and data
Download the data (CSV) · Read the data dictionary. The AMR analysis and figures are licensed CC BY 4.0. Refer to the original issuers for their materials.