Key takeaways
- The U.S. Treasury received $7.53 billion of ONRR’s FY 2026 distributions. The Treasury was the largest category by total disbursement in the FY 2026 file.
- ONRR’s FY 2025 disbursements were $14.61 billion across all reported fund categories. State and local governments received 27.9% of those FY 2025 disbursements.

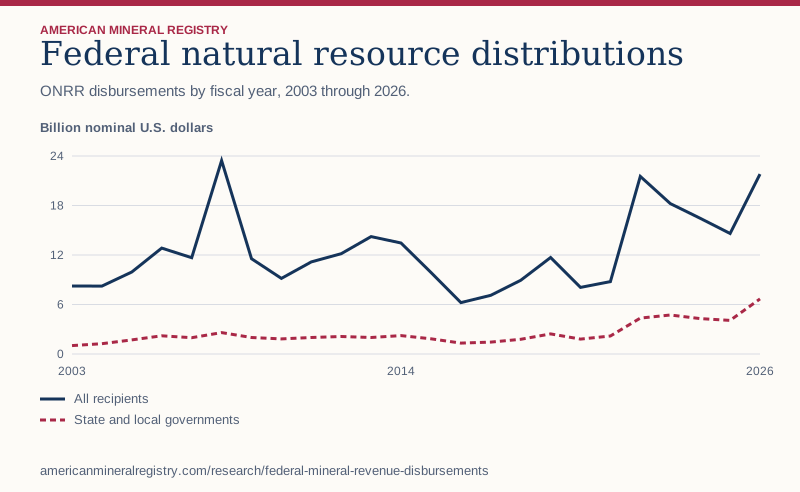
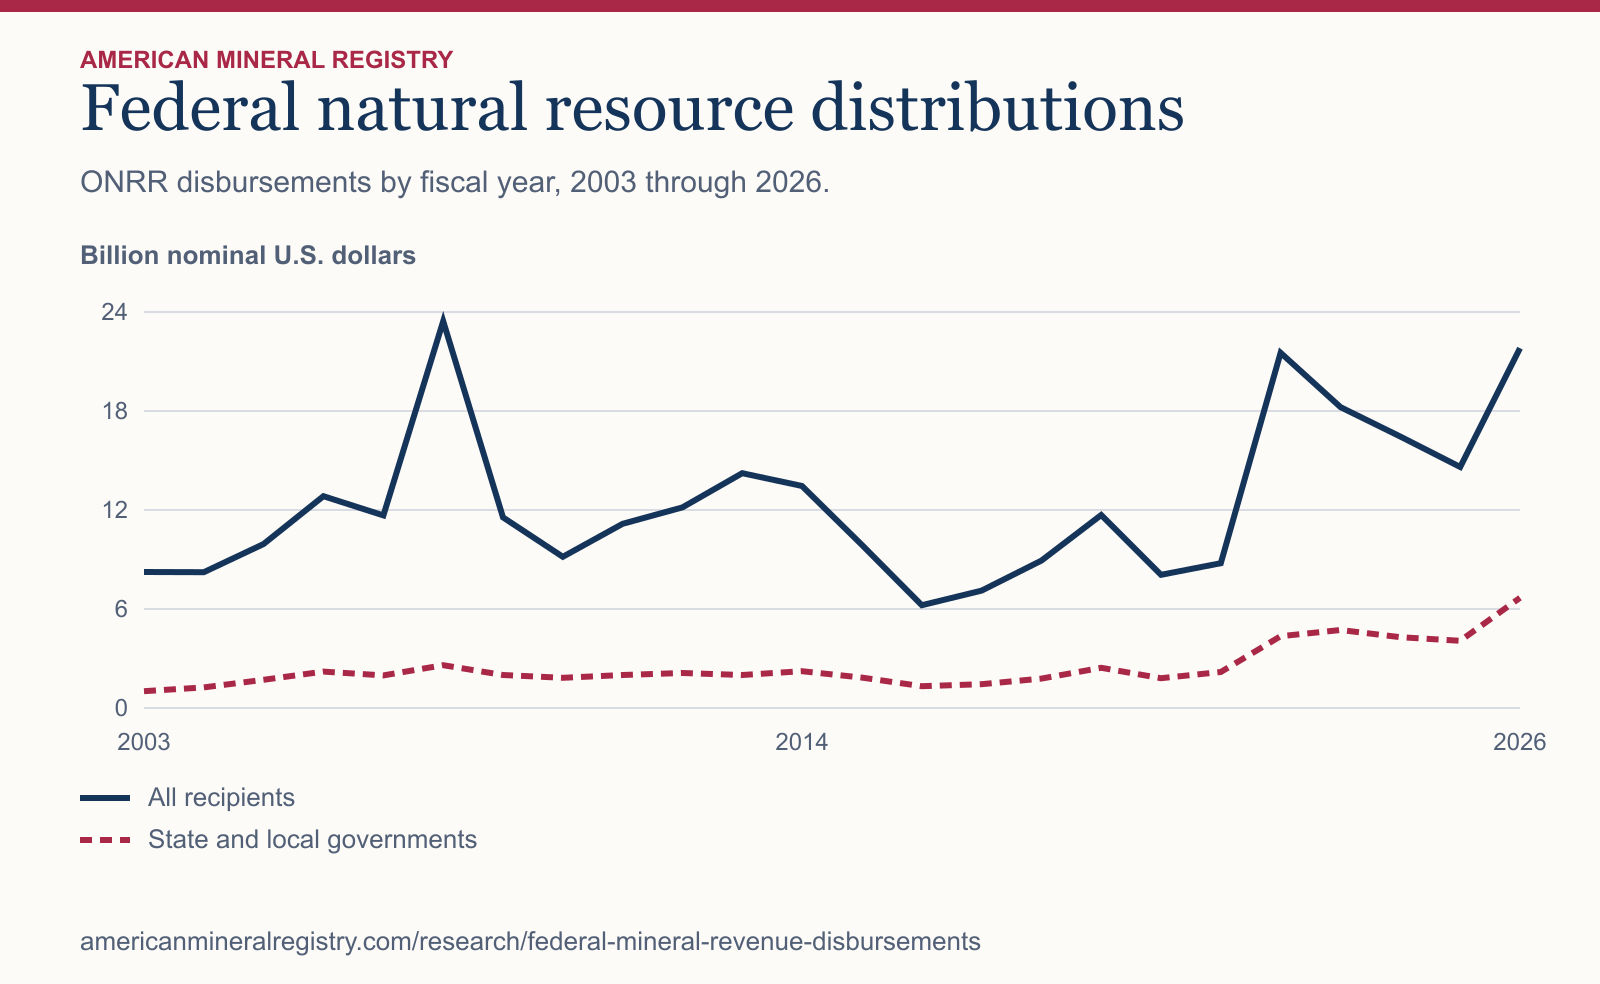
Figure 1 in text
ONRR disbursements by fiscal year, 2003 through 2026. Billion nominal U.S. dollars.
| Fiscal year | All recipients | State and local governments |
|---|---|---|
| 2003 | 8.24 | 1.02 |
| 2004 | 8.23 | 1.25 |
| 2005 | 9.94 | 1.71 |
| 2006 | 12.83 | 2.21 |
| 2007 | 11.67 | 1.97 |
| 2008 | 23.45 | 2.59 |
| 2009 | 11.56 | 2.00 |
| 2010 | 9.16 | 1.83 |
| 2011 | 11.16 | 2.00 |
| 2012 | 12.15 | 2.13 |
| 2013 | 14.22 | 2.00 |
| 2014 | 13.45 | 2.23 |
| 2015 | 9.88 | 1.84 |
| 2016 | 6.23 | 1.33 |
| 2017 | 7.11 | 1.44 |
| 2018 | 8.94 | 1.78 |
| 2019 | 11.69 | 2.44 |
| 2020 | 8.08 | 1.81 |
| 2021 | 8.78 | 2.18 |
| 2022 | 21.53 | 4.36 |
| 2023 | 18.24 | 4.72 |
| 2024 | 16.45 | 4.29 |
| 2025 | 14.61 | 4.07 |
| 2026 | 21.80 | 6.68 |
Chart wording and scale
Federal natural resource distributions ONRR disbursements by fiscal year, 2003 through 2026.
Billion nominal U.S. dollars 0 6 12 18 24 2003 2014 2026 All recipients State and local governments
Source and data: Download chart source data
Permanent link to this figure’s text and data · Sources and context
Which funds receive federal natural resource distributions?
The FY 2026 ONRR distribution file reports seven fund categories. The table includes both the amount and its share of the same fiscal year’s total.
| Recipient fund category | FY 2026 disbursed | Share |
|---|---|---|
| U.S. Treasury | $7.53 billion | 34.5% |
| State and local governments | $6.68 billion | 30.6% |
| Reclamation Fund | $5.10 billion | 23.4% |
| Land and Water Conservation Fund | $1.04 billion | 4.8% |
| Native American tribes and individuals | $0.92 billion | 4.2% |
| Other funds | $0.39 billion | 1.8% |
| Historic Preservation Fund | $0.15 billion | 0.7% |
How much goes to state and local governments over time?
The share of distributions recorded for state and local governments varies by fiscal year. The recent figures below use the same fund label and all-funds denominator.
| Fiscal year | All distributions | State and local governments | Share |
|---|---|---|---|
| 2022 | $21.53 billion | $4.36 billion | 20.2% |
| 2023 | $18.24 billion | $4.72 billion | 25.9% |
| 2024 | $16.45 billion | $4.29 billion | 26.1% |
| 2025 | $14.61 billion | $4.07 billion | 27.9% |
| 2026 | $21.80 billion | $6.68 billion | 30.6% |
Does ONRR’s total include private royalty checks?
The disbursement file concerns natural resource revenue from federal and Native American lands and federal offshore areas. The dollar amounts differ from federal oil and gas royalty collections, which AMR tabulates separately by source. For a separate route from state land receipts through endowments to beneficiary accounts, use the Texas and New Mexico school funding crosswalk.
How were the disbursement shares calculated?
American Mineral Registry summed ONRR’s signed disbursement rows by fiscal year and recipient fund type. Each fund amount was divided by all fund types in that year. The FY 2025 and FY 2026 sums match the Interior Department’s rounded announcements.
Sources and data
- ONRR fiscal-year disbursement CSV
- Interior FY 2025 disbursement announcement
- Interior FY 2026 disbursement announcement
Download the data (CSV) · Read the data dictionary. The AMR analysis and figures are licensed CC BY 4.0. Refer to the original issuers for their materials.