American Mineral RegistryResearch & data

Mineral Revenue and Public School Funding: Texas and New Mexico

Updated

Mineral revenue and public school funding statistics describe several different movements of money. In fiscal 2025, Texas PSF Corporation distributed $2,156,354,137 to the Available School Fund, including an embedded $600 million transfer on behalf of the School Land Board. (Texas PSF Corporation, Dec 2025). New Mexico's Land Grant Permanent Fund distributed $1,494,948,456 to all beneficiaries, of which $1,349,820,346 left the public schools beneficiary account. That account includes additional public education and early childhood distributions, so its payout is not a K12-only classroom spending measure. (New Mexico State Investment Council, Nov 2025).

On this page
  1. Key Takeaways
  2. How does mineral revenue reach public education funds?
  3. What mineral and other land receipts entered the accounts in FY2025?
  4. How do investments and distributions change the endowment balance?
  5. How much did the endowments distribute in FY2025?
  6. What explains the distribution rules and Texas history?
  7. Why do published school funding totals disagree?
  8. Methodology and Sources

This crosswalk follows receipts, endowment deposits, investment results, beneficiary payments and retained assets. Texas's fiscal year ended August 31, 2025; New Mexico's ended June 30, 2025. The audited core stays separate from unaudited receipt detail and newer announcements. Downloads preserve exact amounts, complete beneficiary rows and reconciliation differences, separating fund balances from annual education funding.

Key Takeaways

How does mineral revenue reach public education funds?

The money passes through distinct land, investment and distribution accounts. A royalty receipt can add to an endowment before a separate formula authorizes an education transfer. Following the named account matters more than treating every agency headline as money already spent in schools.

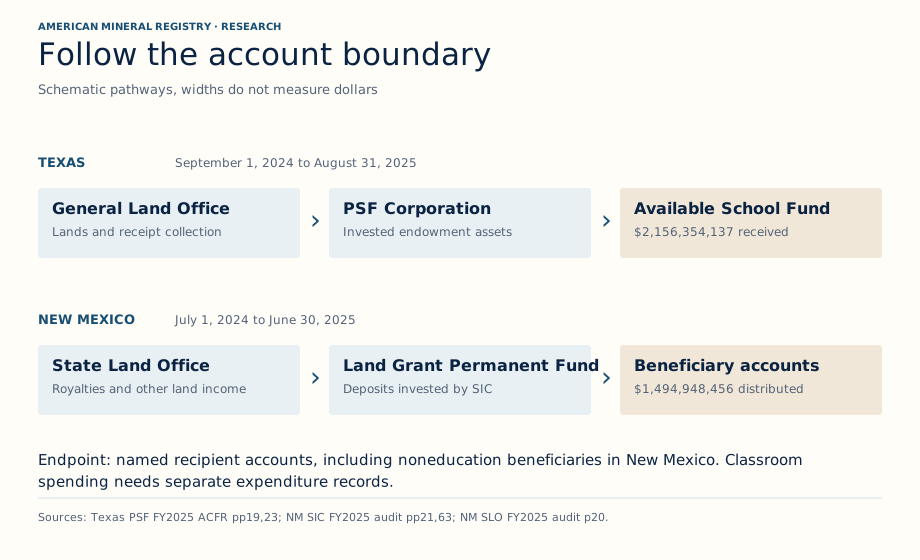
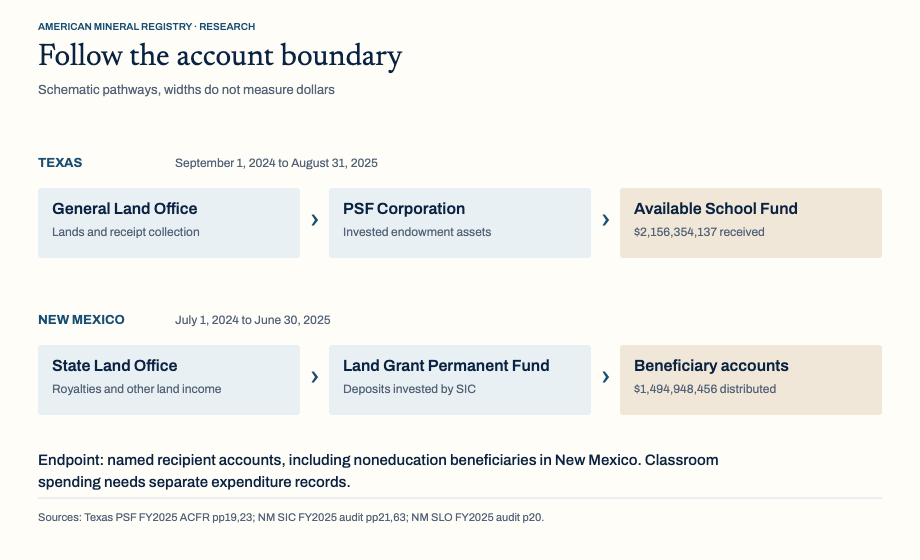
Mineral revenue statistics: Texas and New Mexico fiscal 2025 account routes from land offices through investment funds to named recipient accounts, with education subsets identified separately and classroom spending outside the measured endpoint.
Figure 1: Texas and New Mexico use different institutional routes. This schematic names the receiving account without implying that every receipt becomes a same year education payment. Source: Texas PSF Corporation, FY2025 ACFR pp19 and23, Dec 2025; New Mexico SIC, FY2025 audit pp21 and63, Nov 2025. Chart drawn by American Mineral Registry from the source figures, checked 14 Nov 2026.

Download original chart (SVG) · Chart image (PNG)

Figure 1 in text

Texas and New Mexico fiscal 2025 account routes from land offices through investment funds to named recipient accounts, with education subsets identified separately and classroom spending outside the measured endpoint.

Read the complete diagram text

AMERICAN MINERAL REGISTRY · RESEARCH Follow the account boundary Schematic pathways, widths do not measure dollars

TEXAS September 1, 2024 to August 31, 2025

General Land Office Lands and receipt collection ›

PSF Corporation Invested endowment assets ›

Available School Fund $2,156,354,137 received

NEW MEXICO July 1, 2024 to June 30, 2025

State Land Office Royalties and other land income ›

Land Grant Permanent Fund Deposits invested by SIC ›

Beneficiary accounts $1,494,948,456 distributed Endpoint: named recipient accounts, including noneducation beneficiaries in New Mexico. Classroom spending needs separate expenditure records. Sources: Texas PSF FY2025 ACFR pp19,23; NM SIC FY2025 audit pp21,63; NM SLO FY2025 audit p20.

Additional phone figure text: Measured endpoint: named recipient accounts. · Education subsets are identified separately. · Classroom spending requires separate

Source and data: Texas PSF Corporation, FY2025 ACFR pp19 and23 · New Mexico SIC, FY2025 audit pp21 and63

Which Texas entities belong in the money trail?

The Texas General Land Office manages land assets and receipt collection; PSF Corporation manages the investment endowment; the Texas Education Agency maintains the Available School Fund that receives annual distributions. The corporation's financial statements report it as a separate component unit of the state. (Texas PSF Corporation, Dec 2025).

That separation is material. The statewide governmental Permanent School Fund column reported an ending fund balance of $6,448,629,000, whereas PSF Corporation reported $60,619,480,329 in net position. They are different reporting entities and different statement measures. Neither should silently replace the other in a sentence about the fund. The statewide report's statement uses thousands of dollars, which the downloadable crosswalk converts to dollars. (Texas Comptroller, Feb 2026; Texas PSF Corporation, Dec 2025).

An interagency transfer can appear as an outgoing amount in one entity and an incoming amount in another. Adding both appearances would count the same movement twice. Our crosswalk keeps the entity, accounting line and destination beside the amount, rather than assembling every amount bearing the PSF name into an unsupported grand total.

Which New Mexico accounts serve different purposes?

New Mexico's State Land Office uses the Oil and Gas Royalty Fund as a clearing account and the Land Suspense Fund for other land transactions. Distributable royalties pass to the State Investment Council's Land Grant Permanent Fund. The Land Maintenance Fund supports land-office operations and a separate distribution route for renewable land income and other receipts. (New Mexico State Land Office, Nov 2025).

The distinction prevents a large accounting mistake. The SLO statement reported $2,528,895,125 in distributions to beneficiaries, but that line includes $2,428,595,844 transferred toward the invested LGPF through royalty accounts. It is not an independently measured total of education payments. Treating that deposit as a school payout and then adding the SIC's later distributions would double count stages of the same system. (New Mexico State Land Office, Nov 2025).

The SIC also manages other funds. Its Severance Tax Permanent Fund and Early Childhood Education and Care Fund have separate sources and distribution rules. This article's LGPF calculations exclude them. That exclusion defines the study's population; it does not suggest that those other funds have no connection to education or natural resources.

Do the fiscal year labels describe the same months?

No. The Texas comparison covers September 1, 2024 through August 31, 2025; the New Mexico comparison covers July 1, 2024 through June 30, 2025. The common fiscal year label provides a usable reporting edition, but it does not create matching production or cash collection months. (Texas PSF Corporation, Dec 2025; New Mexico State Investment Council, Nov 2025).

We therefore compare accounting pathways and carefully identified amounts, rather than ranking which state funds schools more effectively. A valid performance ranking would need matched beneficiary coverage, school finance definitions and education denominators. The source records here do not turn unlike reporting scopes into a common classroom spending measure.

What mineral and other land receipts entered the accounts in FY2025?

New Mexico's audited statements separate oil and gas royalties, other royalties and rental income. Texas's statewide audit supplies broader land income; its land-office report gives more detailed royalty categories but is explicitly unaudited. Both distinctions remain visible in the data.

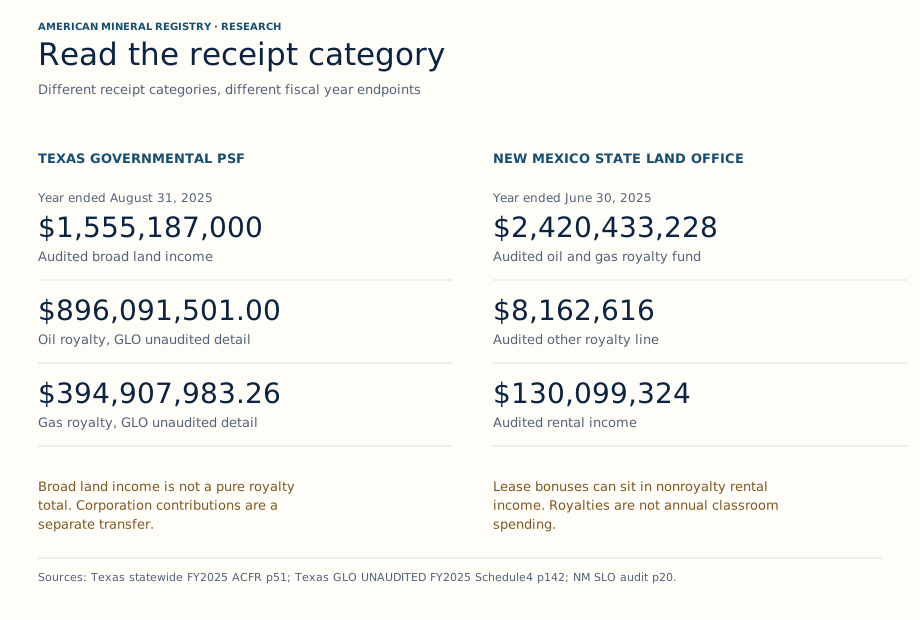
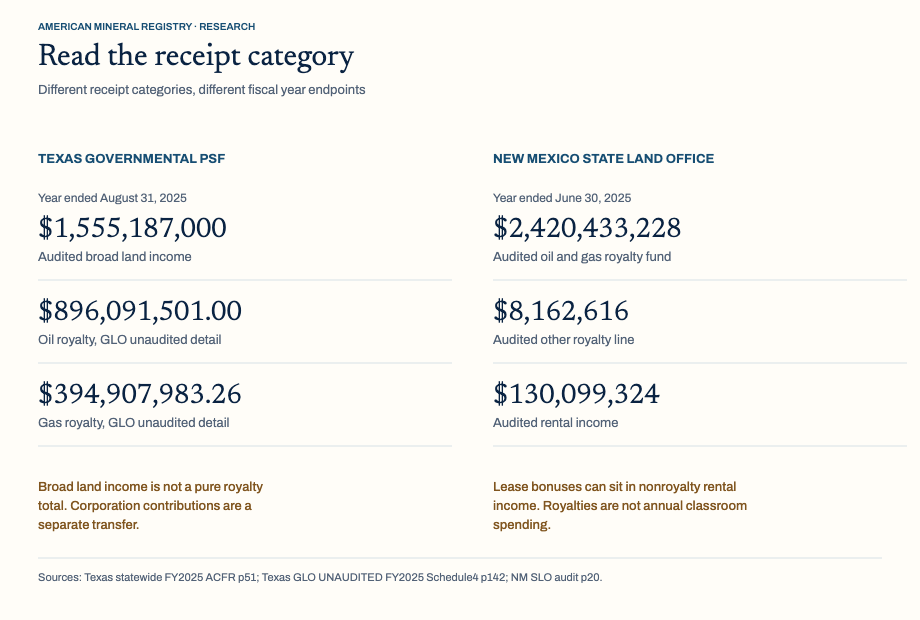
Texas governmental PSF reports $1.555187 billion broad land income; New Mexico SLO reports $2.420433228 billion oil and gas royalties, $8.162616 million other royalties and $130.099324 million rental income for their different FY2025 windows.
Figure 2: The receipt labels answer different questions. Broad Texas land income cannot be ranked against New Mexico oil and gas royalties as though they were the same category. Source: Texas statewide FY2025 ACFR p51, Feb 2026; New Mexico SLO FY2025 audit p20, Nov 2025; Texas GLO unaudited FY2025 report p142, Nov 2025. Chart drawn by American Mineral Registry from the source figures, checked 14 Nov 2026.

Download original chart (SVG) · Chart image (PNG)

Figure 2 in text

Texas governmental PSF reports $1.555187 billion broad land income; New Mexico SLO reports $2.420433228 billion oil and gas royalties, $8.162616 million other royalties and $130.099324 million rental income for their different FY2025 windows.

Read the complete diagram text

AMERICAN MINERAL REGISTRY · RESEARCH Read the receipt category Different receipt categories, different fiscal year endpoints

TEXAS GOVERNMENTAL PSF Year ended August 31, 2025 $1,555,187,000 Audited broad land income $896,091,501.00 Oil royalty, GLO unaudited detail $394,907,983.26 Gas royalty, GLO unaudited detail Broad land income is not a pure royalty total. Corporation contributions are a separate transfer.

NEW MEXICO STATE LAND OFFICE Year ended June 30, 2025 $2,420,433,228 Audited oil and gas royalty fund $8,162,616 Audited other royalty line $130,099,324 Audited rental income Lease bonuses can sit in nonroyalty rental income. Royalties are not annual classroom spending. Sources: Texas statewide FY2025 ACFR p51; Texas GLO UNAUDITED FY2025 Schedule4 p142; NM SLO audit p20.

Source and data: Texas statewide FY2025 ACFR p51 · New Mexico SLO FY2025 audit p20 · Texas GLO unaudited FY2025 report p142

How much did New Mexico record in royalty and rental categories?

The SLO's audited governmental fund statement recorded $2,420,433,228 in oil and gas royalty fund revenue and $8,162,616 in the Land Suspense Fund's other royalty line. Together these equal the statement's $2,428,595,844 total land royalties. Rental income was a separate $130,099,324. These are source classifications, not interchangeable descriptions of all mineral payments. (New Mexico State Land Office, Nov 2025).

The administrative source schedule adds useful detail. It places oil and gas lease bonuses in the rental section, and land-contract receipts in its royalty section. A nonroyalty total can therefore contain revenue associated with mineral leasing, while a royalty category need not consist entirely of oil, gas and hard mineral extraction. Use the producer's categories before choosing a broader label. (New Mexico State Land Office, Oct 2025).

This matters when summarizing the public value of resource development. “Royalties,” “mineral revenue” and “land-office revenue” describe overlapping but unequal populations. The complete audit line table and source cell download retain these distinctions so a writer can choose the measure that answers the actual question.

What does Texas's more detailed receipt schedule establish?

The audited Texas governmental PSF statement reported $1,555,187,000 in land income. That is broader than oil and gas royalties. Separately, GLO's expressly unaudited Schedule 4 reported deposits to PSF Fund 0044, Agency 305 of $896,091,501.00 in oil royalty, $394,907,983.26 in gas royalty and $36,358,330.86 in oil and gas lease bonus. (Texas Comptroller, Feb 2026; Texas General Land Office, Nov 2025). For state lease bids rather than booked royalty or bonus receipts, use the Texas lease auction comparison.

That schedule also has a distinct $104,231,625.28 shut in mineral royalty line. Adding oil and gas royalty lines while ignoring this category would not reproduce every payment that the producer groups under mineral sources. The download retains the source's line names rather than silently redefining a “total royalty” statistic. (Texas General Land Office, Nov 2025).

The qualification is substantive, not a small-print downgrade. These detailed receipt amounts come from an unaudited agency report. They explain categories but do not become audited merely because the investment corporation's later endowment statement was audited. Texas PSF Corporation's contribution line is a separate measurement again, with a different reporting boundary.

Why keep negative entries and collection timing?

Some source schedules contain negative flows. GLO's PSF deposit schedule reported negative $180,350.09 for State Power Program receipts and negative $32,170,442.22 in miscellaneous receipts. We retain both signs. They are not missing data and cannot be replaced by zeros; the schedule alone does not justify inventing a particular refund or correction explanation. (Texas General Land Office, Nov 2025).

New Mexico's SLO audit also recorded $393,365,268 due to SIC at June 30, 2025, relating to May and June sales and distributions, with settlement in July through September. The recognition and cash settlement dates therefore need not coincide. The audit's notes explain when royalties are recognized and how clearing funds operate. (New Mexico State Land Office, Nov 2025).

A receipt series should preserve its own timing conventions. A fiscal cash total, an accrual revenue line and an endowment deposit can each be correct while differing. Calling their difference leakage, waste or unspent classroom money would require evidence that these reports do not supply.

How do investments and distributions change the endowment balance?

An endowment can distribute money and still grow because deposits and investment results exceed the year's outflows. The exact balance bridge separates those flows from the opening and closing stocks. Fair-value changes remain distinct from interest and dividend income.

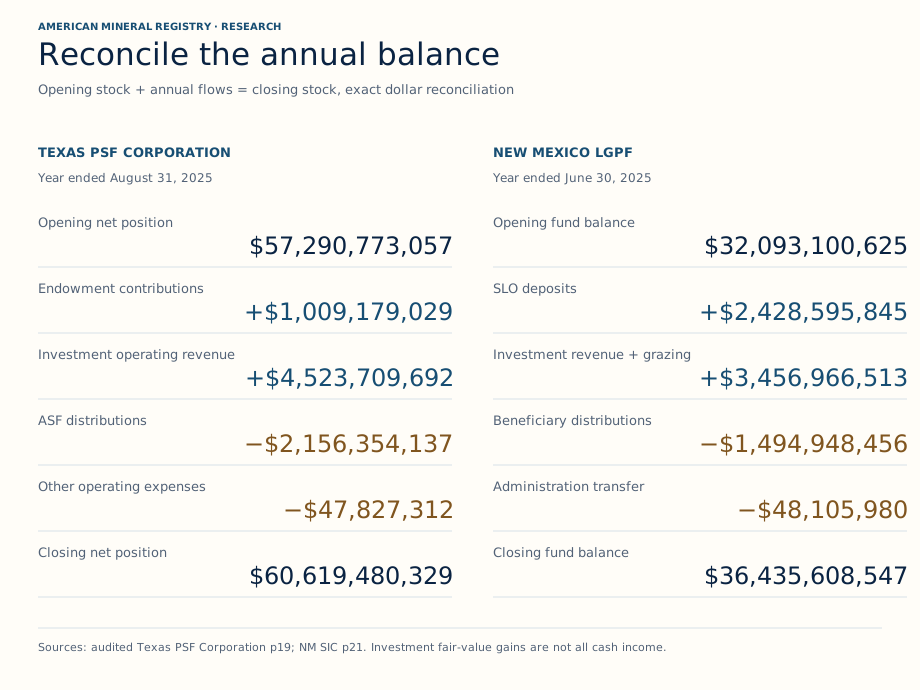
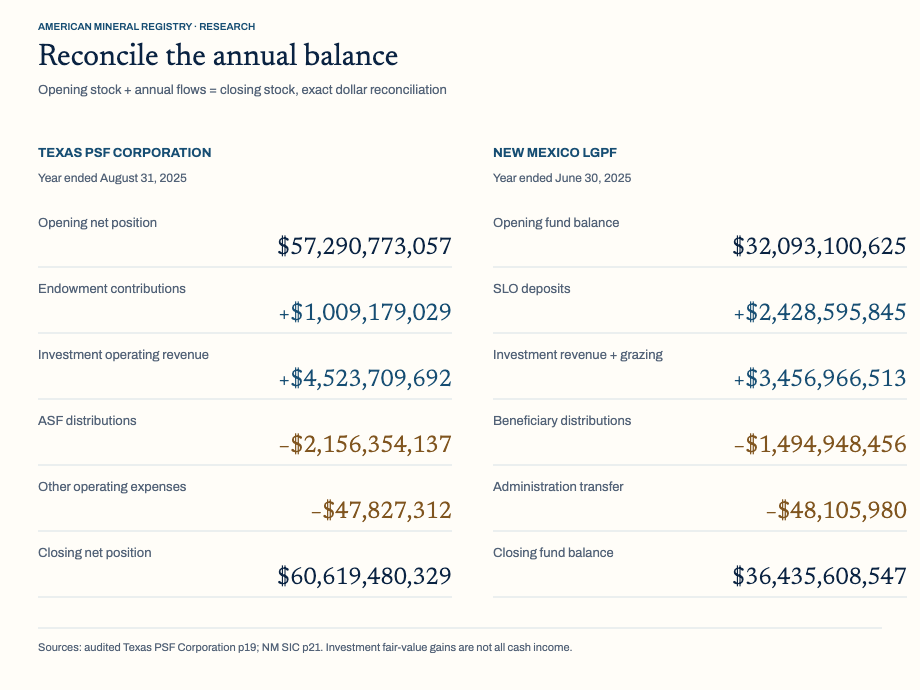
FY2025 audited balance equations reconcile Texas PSF Corporation net position from $57.290773057 billion to $60.619480329 billion and New Mexico LGPF fund balance from $32.093100625 billion to $36.435608547 billion.
Figure 3: Both balance equations close using the original fiscal 2025 amounts. Growth of retained assets and annual beneficiary distributions answer different questions. Source: Texas PSF FY2025 ACFR p19, Dec 2025; New Mexico SIC FY2025 audit p21, Nov 2025. Chart drawn by American Mineral Registry from the source figures, checked 14 Nov 2026.

Download original chart (SVG) · Chart image (PNG)

Figure 3 in text

FY2025 audited balance equations reconcile Texas PSF Corporation net position from $57.290773057 billion to $60.619480329 billion and New Mexico LGPF fund balance from $32.093100625 billion to $36.435608547 billion.

Read the complete diagram text

AMERICAN MINERAL REGISTRY · RESEARCH Reconcile the annual balance Opening stock + annual flows = closing stock, exact dollar reconciliation

TEXAS PSF CORPORATION Year ended August 31, 2025 Opening net position $57,290,773,057 Endowment contributions +$1,009,179,029 Investment operating revenue +$4,523,709,692 ASF distributions −$2,156,354,137 Other operating expenses −$47,827,312 Closing net position $60,619,480,329

NEW MEXICO LGPF Year ended June 30, 2025 Opening fund balance $32,093,100,625 SLO deposits +$2,428,595,845 Investment revenue + grazing +$3,456,966,513 Beneficiary distributions −$1,494,948,456 Administration transfer −$48,105,980 Closing fund balance $36,435,608,547 Sources: audited Texas PSF Corporation p19; NM SIC p21. Investment fair-value gains are not all cash income.

Source and data: Texas PSF FY2025 ACFR p19 · New Mexico SIC FY2025 audit p21

What reconciles Texas PSF Corporation's opening and closing net position?

Texas PSF Corporation began the year with $57,290,773,057. It recorded $1,009,179,029 in contributions to endowment and $4,523,709,692 in operating investment revenues, then reported $2,156,354,137 in ASF distributions and $47,827,312 in other operating expenses. Those exact amounts reconcile to the closing $60,619,480,329 net position. (Texas PSF Corporation, Dec 2025).

The investment revenue total includes $3,197,600,639 in net investment fair-value increases, $1,306,427,306 in interest, dividends and other investment income, and $19,681,747 in net securities lending income. A change in fair value is an accounting result, not a statement that every dollar arrived as cash available for immediate spending. (Texas PSF Corporation, Dec 2025).

The resulting change in net position was $3,328,707,272. This is an accounting increase after the listed expenses and distribution, not an additional school transfer. The reproducible bridge tests the statement's components independently instead of taking a rounded billion dollar description as its calculation input. (Texas PSF Corporation, Dec 2025).

What reconciles New Mexico's LGPF balance?

New Mexico's LGPF began at $32,093,100,625, received $2,428,595,845 in SLO royalties and land-sale transfers, and recorded $3,456,602,077 in investment revenue. A separate $364,436 Federal Taylor Grazing Act receipt brought total revenue to $3,456,966,513. The analysis keeps that grazing receipt outside investment income. (New Mexico State Investment Council, Nov 2025).

Subtracting $1,494,948,456 in beneficiary distributions and a $48,105,980 administration transfer gives an ending balance of $36,435,608,547. The full bridge therefore closes without treating retained royalties as immediate payments to schools. Investment income contains $1,037,342,454 in interest and dividends plus $2,419,259,623 in fair-value changes. (New Mexico State Investment Council, Nov 2025).

The beneficiary exhibit presents these effects in another useful form: other net capital-account increases accompany land transfers and distributions. Our downloaded beneficiary table preserves that original column, while the main bridge separates investment revenue, federal grazing and administration. Readers can reproduce both presentations without adding them together.

Is the ending balance an annual education budget?

No. Texas's closing net position included $58,095,007,278 classified as restricted nonexpendable endowment, $2,516,280,403 as restricted expendable endowment, and $8,192,648 in net capital assets. These classifications sum to reported net position, but none is a substitute for the year's ASF transfer. (Texas PSF Corporation, Dec 2025).

New Mexico's ending LGPF fund balance likewise describes assets retained for beneficiary accounts at the reporting date. The system transforms receipts from finite resources into an invested fund supporting future distributions. An asset balance can inform a discussion of that financial capacity, provided the accompanying sentence does not describe the entire stock as current education spending.

Neither bridge estimates how much a particular well, barrel or private mineral owner contributed to the year's education payout. The inputs are public trust accounts. They do not measure privately owned royalty interests or assign an individual owner's receipts to a state education program.

How much did the endowments distribute in FY2025?

Texas's audited corporation payout is a transfer to the ASF. New Mexico's audited LGPF payout covers multiple named beneficiaries, with the public schools account separately identified. The public schools account's share of distributions differs from its share of deposits or retained assets.

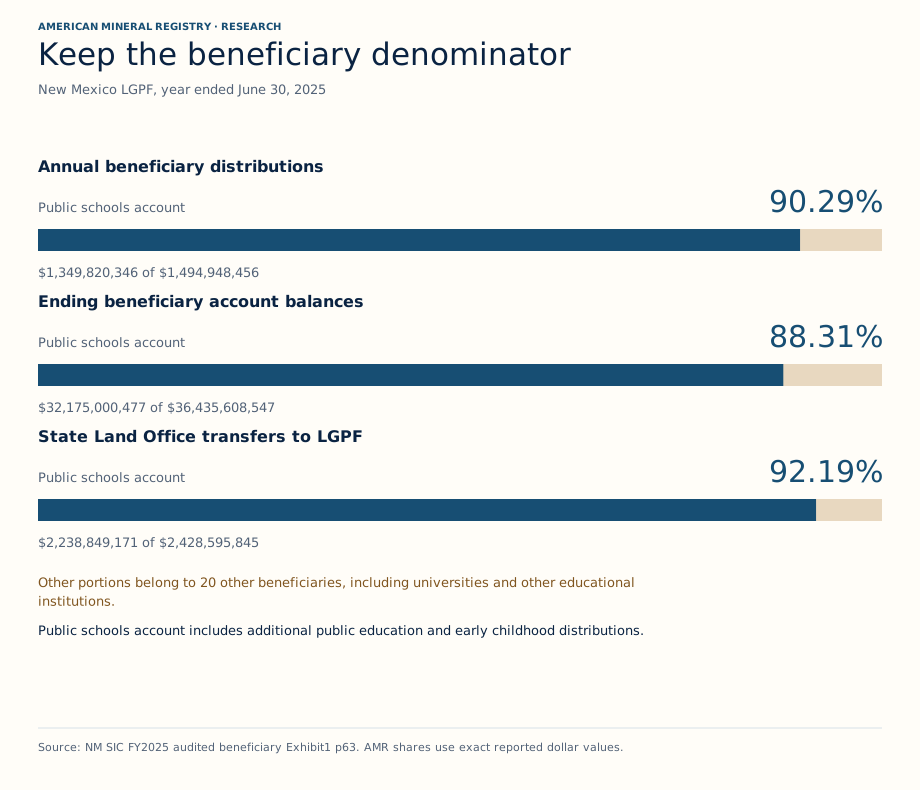
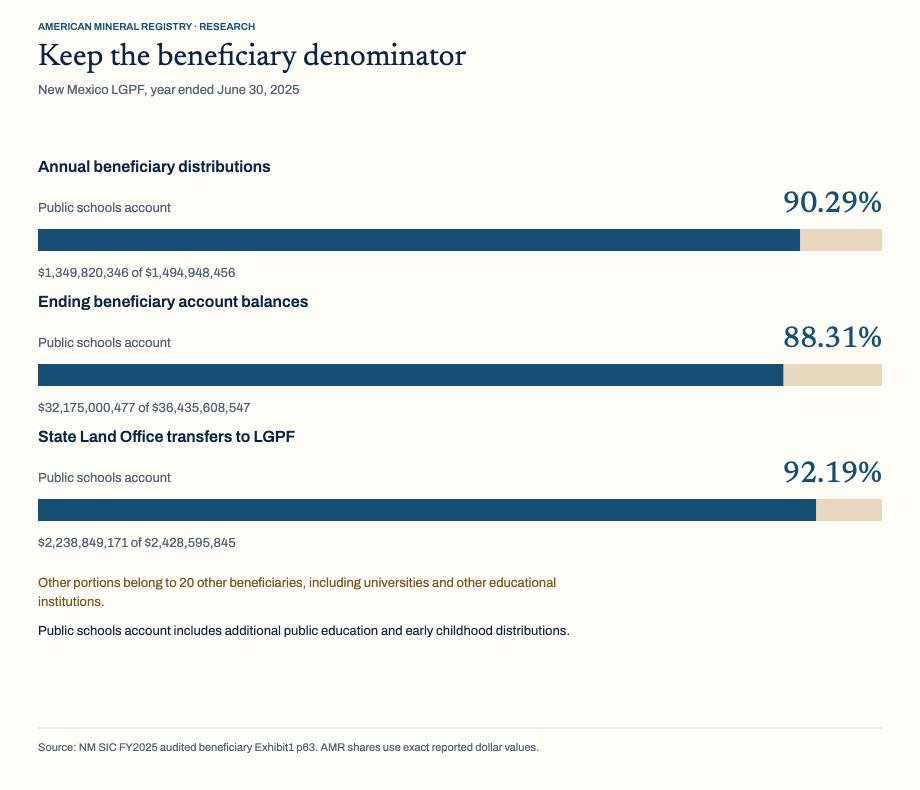
The account includes additional public education and early childhood distributions. New Mexico public-schools account received 90.29 percent of FY2025 LGPF distributions, held 88.31 percent of ending fund balance and received 92.19 percent of SLO deposits; the other portions belong to 20 other named beneficiaries.
Figure 4: A beneficiary account has different shares of three totals. AMR calculates each percentage from the matching numerator and denominator in the complete audited beneficiary schedule. Source: New Mexico SIC FY2025 beneficiary Exhibit1 p63, Nov 2025. Chart drawn by American Mineral Registry from the source figures, checked 14 Nov 2026.

Download original chart (SVG) · Chart image (PNG)

Figure 4 in text

The account includes additional public education and early childhood distributions. New Mexico public-schools account received 90.29 percent of FY2025 LGPF distributions, held 88.31 percent of ending fund balance and received 92.19 percent of SLO deposits; the other portions belong to 20 other named beneficiaries.

Read the complete diagram text

AMERICAN MINERAL REGISTRY · RESEARCH Keep the beneficiary denominator New Mexico LGPF, year ended June 30, 2025

Annual beneficiary distributions 90.29% Public schools account $1,349,820,346 of $1,494,948,456

Ending beneficiary account balances 88.31% Public schools account $32,175,000,477 of $36,435,608,547

State Land Office transfers to LGPF 92.19% Public schools account $2,238,849,171 of $2,428,595,845 Other portions belong to 20 other beneficiaries, including universities and other educational institutions. Public schools account includes additional public education and early childhood distributions. Source: NM SIC FY2025 audited beneficiary Exhibit1 p63. AMR shares use exact reported dollar values.

Source and data: New Mexico SIC FY2025 beneficiary Exhibit1 p63

Does Texas's reported payout already include the SLB amount?

Yes. The audited $2,156,354,137 ASF distribution already includes $600,000,000 made on behalf of the SLB. Subtracting that included subset leaves $1,556,354,137, an AMR arithmetic remainder. Adding the SLB amount to the reported total would overstate this corporation payout by the full included transfer. (Texas PSF Corporation, Dec 2025).

The distinction is useful when agencies describe the same education transfer from different institutional perspectives. A land-board announcement and a corporation financial statement do not necessarily describe separate additive payments. The copyable finding links the exact total, included amount, remainder and audit pages together so a summary can preserve that relationship.

The receiving ASF is also not funded solely by the corporation. Texas's statewide ACFR combining schedule reports $3,106,373,000 in ASF education expenditure. That receiving fund contains tax and investment revenues as well as PSF-related funding. Its overall expenditure cannot be relabeled as mineral royalty spending, nor added to the corporation's incoming transfer as another independent contribution. (Texas Comptroller, Feb 2026). For a separate Texas revenue measure, use the oil and gas production tax comparison.

Which New Mexico beneficiaries received the LGPF distributions?

The audited beneficiary schedule identifies 21 beneficiary accounts. The public schools account distributed $1,349,820,346 out of the all-beneficiary $1,494,948,456 total. That account includes additional public education and early childhood distributions; its payout is not a K12-only classroom spending measure. AMR calculates its distribution share as 90.29%. The remaining $145,128,110 belongs to the other accounts, rather than representing an unexplained shortfall in school funding. (New Mexico State Investment Council, Nov 2025).

Those other accounts include universities, the Military Institute, schools serving deaf and visually impaired students, hospitals, water reservoirs, public buildings and other designated institutions. The full table preserves every beneficiary, including very small distributions and source-reported zero land transfers. “Other beneficiaries” is not synonymous with “noneducation.”

The public schools account's ending $32,175,000,477 represented 88.31% of total LGPF fund balance, while its $2,238,849,171 in SLO transfers represented 92.19% of all SLO deposits to the LGPF. AMR calculates both from matching columns. These shares describe the same public schools beneficiary account, including its additional public education and early childhood allocation. They are not K12-only spending shares. Substituting the asset participation percentage for the distribution percentage would answer a different question. (New Mexico State Investment Council, Nov 2025).

How much does New Mexico's separate rental route distribute?

The SLO's administrative rental distribution schedule reports $132,996,172.00 across beneficiaries, including $101,374,814.43 for Common Schools. Its footnote expressly includes $32,696,890.77 of fiscal 2024 reapportionment. These are administrative schedule amounts with cents precision, not a second audited LGPF distribution table. (New Mexico State Land Office, Oct 2025).

The audit describes reapportionment as certain fees, interest and miscellaneous receipts not attributable to a single beneficiary and above operating needs, subsequently apportioned among beneficiaries. This explains why an annual rental distribution schedule can include money collected in the prior fiscal year. It should not be divided by current rental receipts to manufacture a same-year payout rate. (New Mexico State Land Office, Nov 2025).

We keep this route visible but separate. Combining the administrative Common Schools rental amount with the audited public schools trust payout would mix presentations and timing qualifications. A writer who needs a comprehensive school finance total should first reconcile the receiving agencies' records, rather than describing that convenient sum as verified classroom expenditure.

What explains the distribution rules and Texas history?

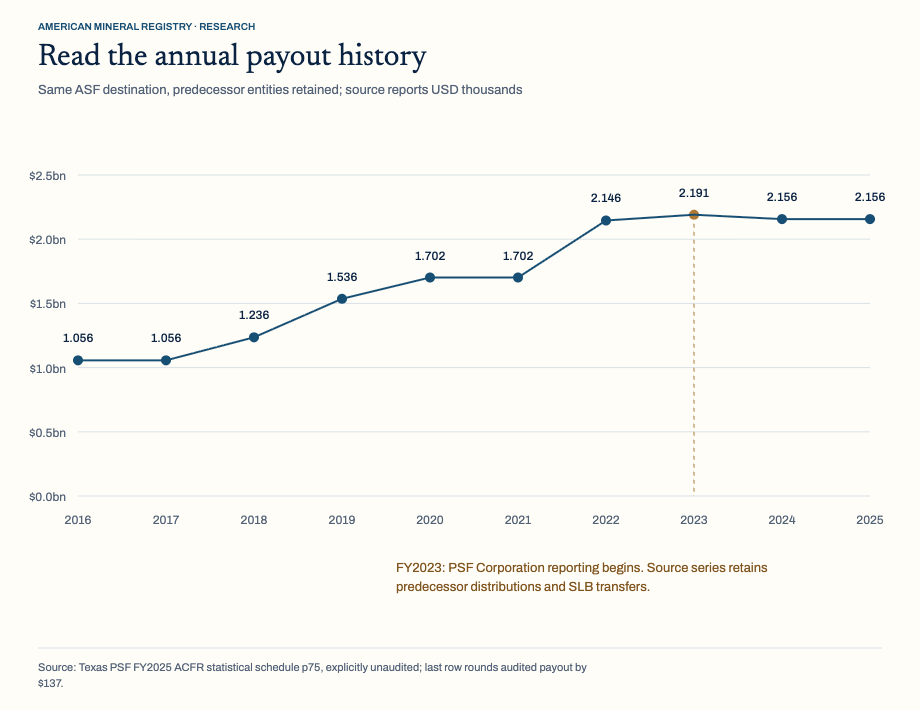
Annual distributions depend on investment-based rules and institutional decisions, rather than matching current royalties dollar for dollar. Texas's historical schedule also spans a change in reporting entity. Its annual figures remain useful when that transition and source precision are preserved.

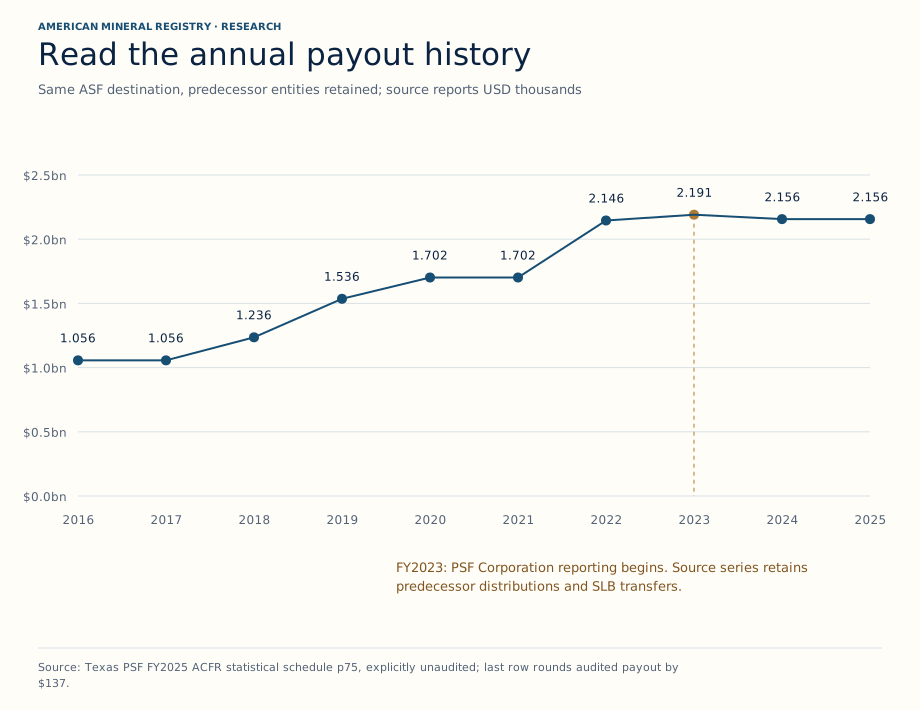
Texas annual ASF distributions in the report source series rose from $1.056412 billion in FY2016 to $2.156354 billion in FY2025, with predecessor entities retained and corporate reporting beginning in FY2023.
Figure 5: The same ASF destination supports an annual history, but the reporting organizations change. This source schedule is explicitly unaudited and reports amounts in thousands of dollars. Source: Texas PSF FY2025 ACFR statistical schedule p75, Dec 2025. Chart drawn by American Mineral Registry from the source figures, checked 14 Nov 2026.

Download original chart (SVG) · Chart image (PNG)

Figure 5 in text

Texas annual ASF distributions in the report source series rose from $1.056412 billion in FY2016 to $2.156354 billion in FY2025, with predecessor entities retained and corporate reporting beginning in FY2023.

Read the complete diagram text

AMERICAN MINERAL REGISTRY · RESEARCH Read the annual payout history Same ASF destination, predecessor entities retained; source reports USD thousands $0.0bn $0.5bn $1.0bn $1.5bn $2.0bn $2.5bn 1.056 2016 1.056 2017 1.236 2018 1.536 2019 1.702 2020 1.702 2021 2.146 2022 2.191 2023 2.156 2024 2.156 2025 FY2023: PSF Corporation reporting begins. Source series retains predecessor distributions and SLB transfers. Source: Texas PSF FY2025 ACFR statistical schedule p75, explicitly unaudited; last row rounds audited payout by $137.

Additional phone figure text: $1.056412bn · $1.235835bn · $1.535835bn · $1.701670bn · $2.145708bn · $2.190708bn · $2.156354bn · Corporate reporting starts FY2023. Do not · interpret that entity change as an · equivalent change in mineral receipts.

Source and data: Texas PSF FY2025 ACFR statistical schedule p75

How does Texas's payout framework work?

The corporation's audit describes a total-return distribution methodology. For the fiscal 2024 to 2025 biennium, the SBOE set a 3.32% rate. Its notes describe a 6% constitutional ceiling based on the relevant sixteen fiscal quarter average and a separate ten-year return constraint. These are restrictions on the distribution framework, not percentages of that year's oil and gas receipts. (Texas PSF Corporation, Dec 2025).

The current Texas Constitution, Article VII, Section 5 supplies the controlling text. The audit establishes the rate and transfers used for the historical period examined here. A reader should not carry that historical biennial rate into a later budget period without checking the later decision.

The audit states that TEA distributes ASF funding to districts using average daily attendance. That does not make an unmatched enrollment count an appropriate denominator for this interstate study. A per-student comparison would need consistent beneficiary coverage and the relevant attendance year, not simply the most recent student total from each state's website.

What changed across the Texas annual distribution series?

The report's historical table records annual ASF distributions of $1.056412 billion in fiscal 2016, $1.535835 billion in fiscal 2019, $2.145708 billion in fiscal 2022, $2.190708 billion in fiscal 2023, and $2.156354 billion in fiscal 2025. The full download contains every annual row in the reported series. These figures retain contributions from predecessor organizations where relevant. (Texas PSF Corporation, Dec 2025).

The historical display does not establish a matching trend in annual royalty collections. Land receipts, investment results, distribution decisions and reporting structure all matter. The corporation's report explains that corporate operations and transfers from predecessor entities changed the reporting presentation beginning in fiscal 2023. (Texas PSF Corporation, Dec 2025).

Precision matters here too. The source history's fiscal 2025 amount is $2,156,354,000 after conversion from thousands, compared with the exact audited statement's $2,156,354,137. The $137 difference is source rounding, not an extra transfer or a reconciliation failure. The current-year claim uses the exact audited amount; the chart preserves the historical schedule's precision. (Texas PSF Corporation, Dec 2025).

Does New Mexico apply the same rule to every beneficiary?

No. New Mexico's revised Attorney General Opinion 2025-02 quotes the constitutional 5% distribution from the relevant five-calendar-year average and the additional 1.25% distribution from the permanent school fund. That additional school-fund distribution is distinct from the broader LGPF beneficiary framework. (New Mexico Department of Justice, Jan 2025).

The opinion quotes a 40% allocation of the additional distribution for specified public school purposes and 60% for early childhood education. It explains that the Military Institute's status as an LGPF beneficiary does not entitle it to a share of this additional permanent school fund distribution. That is why a summary should not label the entire LGPF as one undifferentiated public school account. (New Mexico Department of Justice, Jan 2025).

The revised opinion withdraws its predecessor and confirms congressional consent for the early childhood provision. We use the revised primary text and the audited fiscal 2025 distribution record, without estimating classroom spending from statutory percentages. In particular, the public schools account payout reported here includes the additional education distribution; it is not a K12-only expenditure measurement.

Why do published school funding totals disagree?

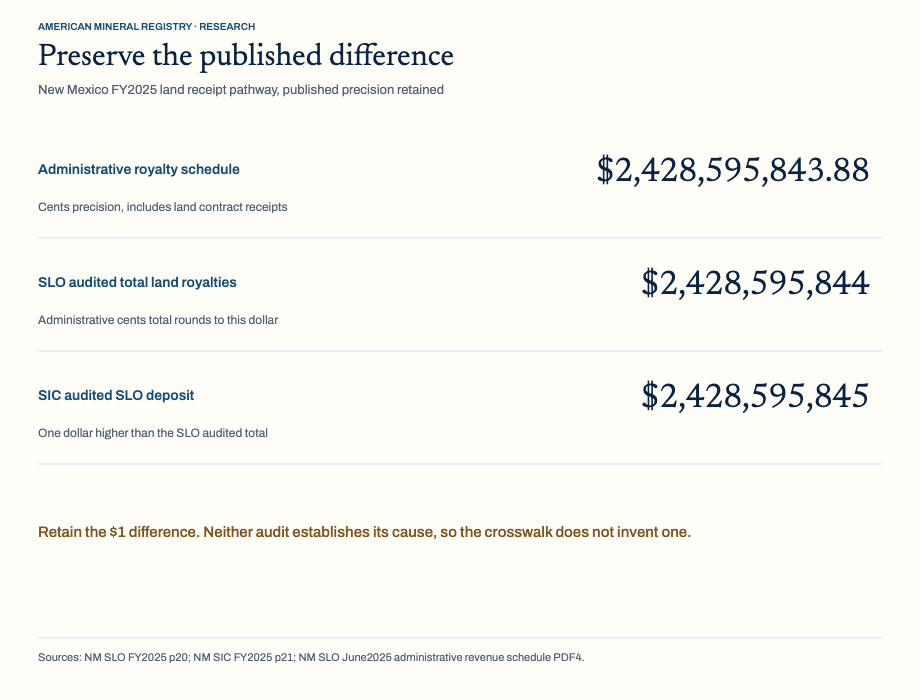
A difference can reflect scope, timing, precision or the distinction between an asset and a flow. The reconciliation register keeps each published amount intact, identifies what can be reproduced and leaves the cause unstated when the sources do not establish it.

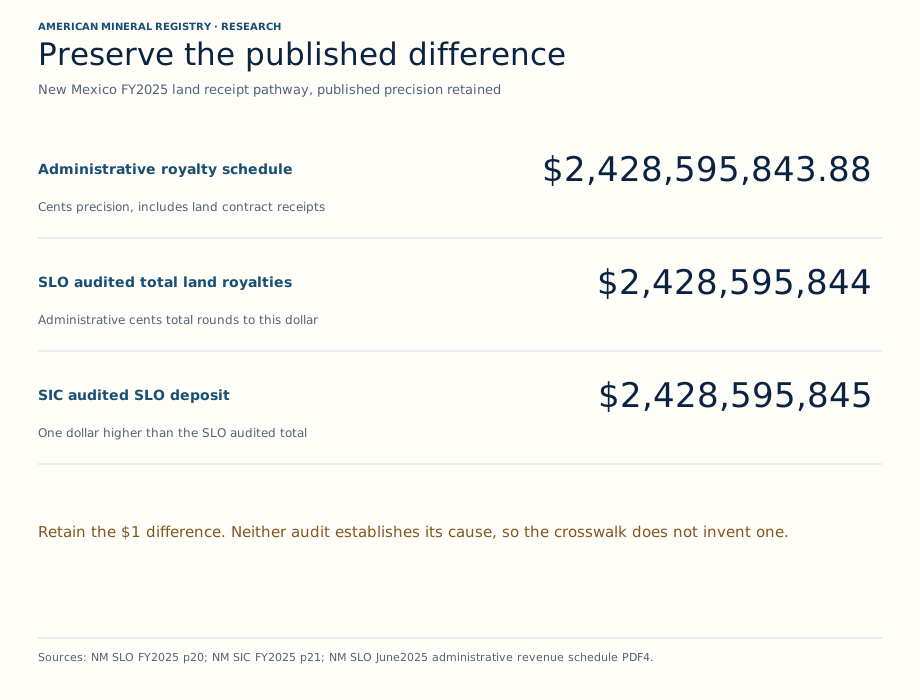
New Mexico FY2025 administrative royalty receipts of $2,428,595,843.88 round to the SLO audited $2,428,595,844; the SIC audited SLO transfer is $2,428,595,845, a one-dollar inter-source difference.
Figure 6: The administrative cents total rounds to the SLO audit's whole-dollar amount. The SIC audit is one dollar higher; the source reports do not establish why, so the data preserve the difference. Source: New Mexico SLO FY2025 audit p20, Nov 2025; New Mexico SIC FY2025 audit p21, Nov 2025; New Mexico SLO administrative revenue schedule, Oct 2025. Chart drawn by American Mineral Registry from the source figures, checked 14 Nov 2026.

Download original chart (SVG) · Chart image (PNG)

Figure 6 in text

New Mexico FY2025 administrative royalty receipts of $2,428,595,843.88 round to the SLO audited $2,428,595,844; the SIC audited SLO transfer is $2,428,595,845, a one-dollar inter-source difference.

Read the complete diagram text

AMERICAN MINERAL REGISTRY · RESEARCH Preserve the published difference New Mexico FY2025 land receipt pathway, published precision retained

Administrative royalty schedule $2,428,595,843.88 Cents precision, includes land contract receipts

SLO audited total land royalties $2,428,595,844 Administrative cents total rounds to this dollar

SIC audited SLO deposit $2,428,595,845 One dollar higher than the SLO audited total Retain the $1 difference. Neither audit establishes its cause, so the crosswalk does not invent one. Sources: NM SLO FY2025 p20; NM SIC FY2025 p21; NM SLO June2025 administrative revenue schedule PDF4.

Source and data: New Mexico SLO FY2025 audit p20 · New Mexico SIC FY2025 audit p21 · New Mexico SLO administrative revenue schedule

Do the New Mexico source totals reconcile to the dollar?

The administrative royalty schedule totals $2,428,595,843.88. Rounded to whole dollars, it matches the SLO audited land-royalty total of $2,428,595,844. The SIC audit reports $2,428,595,845 in SLO royalties and land-sale transfers. The crosswalk retains the resulting $1 inter-source difference instead of silently changing either audited figure. (New Mexico State Land Office, Oct 2025; New Mexico State Land Office, Nov 2025; New Mexico State Investment Council, Nov 2025).

The difference is small, but preserving it makes the accounting reproducible. The report does not call it a particular rounding allocation, receivable adjustment or error without evidence. Each financial statement closes on its own reported values, and the beneficiary schedule closes on its own account balances.

Other differences are much larger because the categories differ. New Mexico's administrative $2,589,216,651.04 grand total adds $160,620,807.16 in rental and other receipts to the royalty category. It is a land-office receipt total, not the LGPF's distribution to beneficiaries. (New Mexico State Land Office, Oct 2025).

What does the newer New Mexico revenue announcement change?

The October 2026 announcement reported around $3.2 billion in fiscal 2026 agency revenue, including over $719 million in nonroyalty payments. It does not replace the fiscal 2025 audited comparison. Its rounded revenue total is neither all mineral royalties nor a measured total of that year's classroom spending. (New Mexico State Land Office, Oct 2026).

The release describes earnings for designated trust beneficiaries. A beneficiary attribution in that announcement is not the same accounting event as an annual SIC distribution or an education department expenditure. Without the matching fiscal 2026 audit crosswalk, calculating a new royalty-to-school conversion rate from the announcement would introduce unsupported precision.

The separate announcement download therefore preserves two features that a hurried summary can lose: the total is approximate, and the nonroyalty figure is a lower bound. It is not a complete source breakdown from which an exact residual mineral total can be calculated. We do not subtract the lower bound from the rounded total and present the result as observed royalty revenue.

What should a reusable citation preserve?

A useful citation names the entity, fiscal window, accounting line and beneficiary scope before stating the amount. “Texas PSF Corporation distributed money to the ASF” is a different claim from “Texas spent that amount on classrooms.” “New Mexico's public schools account distributed money” also needs the additional education and early childhood qualification.

The reusable findings attached to this study provide exact fragment links and matching data. The balance bridge should retain its opening stock, annual positive and negative flows, and closing stock. The beneficiary compilation should retain every account rather than replacing small accounts with a residual labeled noneducation. A history should preserve the source's precision and reporting transition.

For broader context, see the AMR research library's mineral rights and royalty statistics and U.S. oil reserve accounting study. Those resources address different populations. Neither private owner royalties nor underground reserves should be substituted for the public trust accounts examined here.

Methodology and Sources

American Mineral Registry transcribed exact source cells from the opened fiscal 2025 Texas and New Mexico financial reports, preserved original PDFs and hashes, and regenerated all analytical tables offline using decimal arithmetic. The checks close both endowment balance bridges, every New Mexico beneficiary row, total beneficiary columns and the Texas included-transfer calculation. Administrative schedules, unaudited GLO detail, the unaudited Texas historical schedule and fiscal 2026 announcements retain separate labels. The common fiscal year does not imply matching months. Calculated shares use the matching account column and total; missing values are never converted to zeros. Original displayed zero transfers remain zeros. This is a source compilation and accounting explanation, not a measurement of final classroom spending, a school-finance performance ranking, legal advice or private mineral-owner income.

Glossary

  • Royalty: Payment tied to production under the relevant mineral agreement; source categories can also contain other receipts.
  • Lease bonus: Consideration for entering a lease, distinct from a production royalty.
  • Land income: A broader accounting category that can include multiple uses of trust land.
  • Endowment: Assets invested to support beneficiary distributions over time.
  • Corpus: The permanent principal of a fund, subject to its governing restrictions.
  • Fund balance: A governmental fund's reported assets and deferred outflows less liabilities and deferred inflows.
  • Net position: A broader accrual accounting measure reported by entities such as Texas PSF Corporation.
  • Fair-value change: An increase or decrease in the reported market value of investments.
  • Beneficiary: An institution or designated account entitled to benefits under the trust framework.
  • Reapportionment: Allocation of qualifying residual land-office receipts among beneficiaries after applicable operating needs.
  • Distribution: A transfer from a fund to a receiving account or beneficiary, distinct from that recipient's final spending.

Sources

Cite a specific finding

Copy a finding with its exact period, denominator and primary source. The permanent link lands on the supporting evidence.

Texas ASF transfer with included SLB amount

For the year ended August 31, 2025, Texas PSF Corporation distributed $2,156,354,137 to the Available School Fund, already including $600,000,000 on behalf of the School Land Board. AMR calculates the remainder at $1,556,354,137; adding the included SLB amount to the total would double count it.

American Mineral Registry. For the year ended August 31, 2025, Texas PSF Corporation distributed $2,156,354,137 to the Available School Fund, already including $600,000,000 on behalf of the School Land Board. AMR calculates the remainder at $1,556,354,137; adding the included SLB amount to the total would double count it. Audited corporation statement p19 and note p23. Transfer into ASF, not final classroom spending. Texas FY2025 is September 1, 2024 through August 31, 2025. https://americanmineralregistry.com/research/mineral-revenue-public-school-funding-statistics#school-funding-texas-embedded-transfer Primary sources: https://texaspsf.org/wp-content/uploads/2026/06/2025-acfr-texas-permanent-school-fund-corporation_a11y.pdf
Copy HTML attribution<a href="https://americanmineralregistry.com/research/mineral-revenue-public-school-funding-statistics#school-funding-texas-embedded-transfer">American Mineral Registry</a>. For the year ended August 31, 2025, Texas PSF Corporation distributed $2,156,354,137 to the Available School Fund, already including $600,000,000 on behalf of the School Land Board. AMR calculates the remainder at $1,556,354,137; adding the included SLB amount to the total would double count it. Audited corporation statement p19 and note p23. Transfer into ASF, not final classroom spending. Texas FY2025 is September 1, 2024 through August 31, 2025. Primary sources: <a href="https://texaspsf.org/wp-content/uploads/2026/06/2025-acfr-texas-permanent-school-fund-corporation_a11y.pdf">Original primary source</a>.

Permanent finding link · Matching data (CSV) · Original producer source

New Mexico public schools account has three different shares

For the year ended June 30, 2025, AMR calculates that New Mexico LGPF public-schools account represented 90.29% of all-beneficiary distributions, 88.31% of ending fund balance and 92.19% of State Land Office transfers. Each percentage uses its matching audited column and total.

American Mineral Registry. For the year ended June 30, 2025, AMR calculates that New Mexico LGPF public-schools account represented 90.29% of all-beneficiary distributions, 88.31% of ending fund balance and 92.19% of State Land Office transfers. Each percentage uses its matching audited column and total. Audited Exhibit1 p63, all21 accounts. Public-schools account includes additional education and early childhood distribution. Shares are not a royalty-to-classroom conversion rate. https://americanmineralregistry.com/research/mineral-revenue-public-school-funding-statistics#school-funding-nm-beneficiary-denominators Primary sources: https://api.realfile.rtsclients.com/PublicFiles/7c4d03015a164367930068bfbb95f6a0/51808c35-0513-4560-aaa7-f9fe7265ee8c/Audit%20Report%20FY2025.pdf
Copy HTML attribution<a href="https://americanmineralregistry.com/research/mineral-revenue-public-school-funding-statistics#school-funding-nm-beneficiary-denominators">American Mineral Registry</a>. For the year ended June 30, 2025, AMR calculates that New Mexico LGPF public-schools account represented 90.29% of all-beneficiary distributions, 88.31% of ending fund balance and 92.19% of State Land Office transfers. Each percentage uses its matching audited column and total. Audited Exhibit1 p63, all21 accounts. Public-schools account includes additional education and early childhood distribution. Shares are not a royalty-to-classroom conversion rate. Primary sources: <a href="https://api.realfile.rtsclients.com/PublicFiles/7c4d03015a164367930068bfbb95f6a0/51808c35-0513-4560-aaa7-f9fe7265ee8c/Audit%20Report%20FY2025.pdf">Original primary source</a>.

Permanent finding link · Matching data (CSV) · Original producer source

Complete New Mexico beneficiary distributions

In fiscal 2025, New Mexico LGPF distributed $1,494,948,456 across 21 named beneficiary accounts. The public schools account distribution was $1,349,820,346, including additional public education and early childhood distributions, not a K12-only classroom spending measure; AMR calculates $145,128,110 for the other 20 accounts, including other educational institutions.

American Mineral Registry. In fiscal 2025, New Mexico LGPF distributed $1,494,948,456 across 21 named beneficiary accounts. The public schools account distribution was $1,349,820,346, including additional public education and early childhood distributions, not a K12-only classroom spending measure; AMR calculates $145,128,110 for the other 20 accounts, including other educational institutions. Year ended June30,2025. The other20 accounts are not all noneducation. Source-reported zero transfers remain zero. Complete beginning, deposit, distribution, other-capital and ending columns provided. The public schools account includes additional public education and early childhood distributions. It is not a K12-only classroom spending measure. https://americanmineralregistry.com/research/mineral-revenue-public-school-funding-statistics#school-funding-nm-complete-beneficiary-crosswalk Primary sources: https://api.realfile.rtsclients.com/PublicFiles/7c4d03015a164367930068bfbb95f6a0/51808c35-0513-4560-aaa7-f9fe7265ee8c/Audit%20Report%20FY2025.pdf
Copy HTML attribution<a href="https://americanmineralregistry.com/research/mineral-revenue-public-school-funding-statistics#school-funding-nm-complete-beneficiary-crosswalk">American Mineral Registry</a>. In fiscal 2025, New Mexico LGPF distributed $1,494,948,456 across 21 named beneficiary accounts. The public schools account distribution was $1,349,820,346, including additional public education and early childhood distributions, not a K12-only classroom spending measure; AMR calculates $145,128,110 for the other 20 accounts, including other educational institutions. Year ended June30,2025. The other20 accounts are not all noneducation. Source-reported zero transfers remain zero. Complete beginning, deposit, distribution, other-capital and ending columns provided. The public schools account includes additional public education and early childhood distributions. It is not a K12-only classroom spending measure. Primary sources: <a href="https://api.realfile.rtsclients.com/PublicFiles/7c4d03015a164367930068bfbb95f6a0/51808c35-0513-4560-aaa7-f9fe7265ee8c/Audit%20Report%20FY2025.pdf">Original primary source</a>.

Permanent finding link · Matching data (CSV) · Original producer source

Texas endowment stock and annual flows

Texas PSF Corporation FY2025 reconciles exactly: $57,290,773,057 opening net position plus $1,009,179,029 endowment contributions plus $4,523,709,692 investment operating revenue, less $2,156,354,137 ASF distributions and $47,827,312 other operating expenses, equals $60,619,480,329 closing net position.

American Mineral Registry. Texas PSF Corporation FY2025 reconciles exactly: $57,290,773,057 opening net position plus $1,009,179,029 endowment contributions plus $4,523,709,692 investment operating revenue, less $2,156,354,137 ASF distributions and $47,827,312 other operating expenses, equals $60,619,480,329 closing net position. Audited p19, year ended August31,2025. Corporation boundary only. Investment revenue includes changes in fair value, not solely cash investment receipts. Net position is not annual spending. https://americanmineralregistry.com/research/mineral-revenue-public-school-funding-statistics#school-funding-texas-exact-balance-bridge Primary sources: https://texaspsf.org/wp-content/uploads/2026/06/2025-acfr-texas-permanent-school-fund-corporation_a11y.pdf
Copy HTML attribution<a href="https://americanmineralregistry.com/research/mineral-revenue-public-school-funding-statistics#school-funding-texas-exact-balance-bridge">American Mineral Registry</a>. Texas PSF Corporation FY2025 reconciles exactly: $57,290,773,057 opening net position plus $1,009,179,029 endowment contributions plus $4,523,709,692 investment operating revenue, less $2,156,354,137 ASF distributions and $47,827,312 other operating expenses, equals $60,619,480,329 closing net position. Audited p19, year ended August31,2025. Corporation boundary only. Investment revenue includes changes in fair value, not solely cash investment receipts. Net position is not annual spending. Primary sources: <a href="https://texaspsf.org/wp-content/uploads/2026/06/2025-acfr-texas-permanent-school-fund-corporation_a11y.pdf">Original primary source</a>.

Permanent finding link · Matching data (CSV) · Original producer source

New Mexico endowment stock and annual flows

New Mexico LGPF FY2025 reconciles exactly: $32,093,100,625 opening fund balance plus $2,428,595,845 SLO deposits plus $3,456,602,077 investment revenue plus $364,436 federal grazing revenue, less $1,494,948,456 beneficiary distributions and $48,105,980 administration, equals $36,435,608,547 closing fund balance.

American Mineral Registry. New Mexico LGPF FY2025 reconciles exactly: $32,093,100,625 opening fund balance plus $2,428,595,845 SLO deposits plus $3,456,602,077 investment revenue plus $364,436 federal grazing revenue, less $1,494,948,456 beneficiary distributions and $48,105,980 administration, equals $36,435,608,547 closing fund balance. Audited p21, year ended June30,2025, Fund60100 only. Excludes separate STPF and ECECF. Fair-value changes are part of investment revenue. Other increases in capital accounts net in Exhibit1 equal total revenue less administration. https://americanmineralregistry.com/research/mineral-revenue-public-school-funding-statistics#school-funding-nm-exact-balance-bridge Primary sources: https://api.realfile.rtsclients.com/PublicFiles/7c4d03015a164367930068bfbb95f6a0/51808c35-0513-4560-aaa7-f9fe7265ee8c/Audit%20Report%20FY2025.pdf
Copy HTML attribution<a href="https://americanmineralregistry.com/research/mineral-revenue-public-school-funding-statistics#school-funding-nm-exact-balance-bridge">American Mineral Registry</a>. New Mexico LGPF FY2025 reconciles exactly: $32,093,100,625 opening fund balance plus $2,428,595,845 SLO deposits plus $3,456,602,077 investment revenue plus $364,436 federal grazing revenue, less $1,494,948,456 beneficiary distributions and $48,105,980 administration, equals $36,435,608,547 closing fund balance. Audited p21, year ended June30,2025, Fund60100 only. Excludes separate STPF and ECECF. Fair-value changes are part of investment revenue. Other increases in capital accounts net in Exhibit1 equal total revenue less administration. Primary sources: <a href="https://api.realfile.rtsclients.com/PublicFiles/7c4d03015a164367930068bfbb95f6a0/51808c35-0513-4560-aaa7-f9fe7265ee8c/Audit%20Report%20FY2025.pdf">Original primary source</a>.

Permanent finding link · Matching data (CSV) · Original producer source

New Mexico one-dollar source reconciliation

New Mexico FY2025 administrative royalty receipts of $2,428,595,843.88 round to the SLO audited $2,428,595,844. The SIC audit reports $2,428,595,845 of SLO royalties and land-sale transfers, a $1 inter-source difference. AMR preserves each source amount without inventing a cause.

American Mineral Registry. New Mexico FY2025 administrative royalty receipts of $2,428,595,843.88 round to the SLO audited $2,428,595,844. The SIC audit reports $2,428,595,845 of SLO royalties and land-sale transfers, a $1 inter-source difference. AMR preserves each source amount without inventing a cause. Same FY2025 ending June30. Administrative schedule is not an audit. Source category includes land contracts. Both exact audit totals retained, not silently repaired. https://americanmineralregistry.com/research/mineral-revenue-public-school-funding-statistics#school-funding-nm-published-dollar-residual Primary sources: https://api.realfile.rtsclients.com/PublicFiles/7c4d03015a164367930068bfbb95f6a0/51808c35-0513-4560-aaa7-f9fe7265ee8c/Audit%20Report%20FY2025.pdf; https://www.nmstatelands.org/wp-content/uploads/2025/12/539-Commissioner-of-Public-Lands-AFR-FY25-Final.pdf; https://www.nmstatelands.org/wp-content/uploads/2025/10/June-25-Rev-Pages_Sept.pdf
Copy HTML attribution<a href="https://americanmineralregistry.com/research/mineral-revenue-public-school-funding-statistics#school-funding-nm-published-dollar-residual">American Mineral Registry</a>. New Mexico FY2025 administrative royalty receipts of $2,428,595,843.88 round to the SLO audited $2,428,595,844. The SIC audit reports $2,428,595,845 of SLO royalties and land-sale transfers, a $1 inter-source difference. AMR preserves each source amount without inventing a cause. Same FY2025 ending June30. Administrative schedule is not an audit. Source category includes land contracts. Both exact audit totals retained, not silently repaired. Primary sources: <a href="https://api.realfile.rtsclients.com/PublicFiles/7c4d03015a164367930068bfbb95f6a0/51808c35-0513-4560-aaa7-f9fe7265ee8c/Audit%20Report%20FY2025.pdf">Original primary source</a>; <a href="https://www.nmstatelands.org/wp-content/uploads/2025/12/539-Commissioner-of-Public-Lands-AFR-FY25-Final.pdf">New Mexico Commissioner of Public Lands FY2025 audit</a>; <a href="https://www.nmstatelands.org/wp-content/uploads/2025/10/June-25-Rev-Pages_Sept.pdf">New Mexico SLO June 2025 revenue schedules, updated October 6, 2025</a>.

Permanent finding link · Matching data (CSV) · Original producer source

New Mexico Commissioner of Public Lands FY2025 audit · New Mexico SLO June 2025 revenue schedules, updated October 6, 2025

Rental distributions include a prior fiscal year reapportionment

New Mexico SLO fiscal2025 administrative rental distributions total $132,996,172.00 across beneficiaries, including $101,374,814.43 for Common Schools. The source footnote says the total includes $32,696,890.77 of fiscal2024 reapportionment, so it is not a same-year rental-receipt payout ratio.

American Mineral Registry. New Mexico SLO fiscal2025 administrative rental distributions total $132,996,172.00 across beneficiaries, including $101,374,814.43 for Common Schools. The source footnote says the total includes $32,696,890.77 of fiscal2024 reapportionment, so it is not a same-year rental-receipt payout ratio. Administrative June2025 distribution schedule PDF1, updated October6,2025. Separate from audited LGPF payout and from final school spending. Do not silently sum mixed timing/basis tables. https://americanmineralregistry.com/research/mineral-revenue-public-school-funding-statistics#school-funding-nm-rental-prior-year Primary sources: https://www.nmstatelands.org/wp-content/uploads/2025/10/June-25-Rev-Pages_Sept.pdf
Copy HTML attribution<a href="https://americanmineralregistry.com/research/mineral-revenue-public-school-funding-statistics#school-funding-nm-rental-prior-year">American Mineral Registry</a>. New Mexico SLO fiscal2025 administrative rental distributions total $132,996,172.00 across beneficiaries, including $101,374,814.43 for Common Schools. The source footnote says the total includes $32,696,890.77 of fiscal2024 reapportionment, so it is not a same-year rental-receipt payout ratio. Administrative June2025 distribution schedule PDF1, updated October6,2025. Separate from audited LGPF payout and from final school spending. Do not silently sum mixed timing/basis tables. Primary sources: <a href="https://www.nmstatelands.org/wp-content/uploads/2025/10/June-25-Rev-Pages_Sept.pdf">Original primary source</a>.

Permanent finding link · Matching data (CSV) · Original producer source

Texas historical series keeps the reporting transition and rounding

Texas FY2025 ASF distribution is $2,156,354,000 in the report history after conversion from USD thousands, versus $2,156,354,137 in the audited statement. The $137 difference is source rounding. The full 2016 to2025 series retains predecessor entities and the FY2023 corporation reporting transition.

American Mineral Registry. Texas FY2025 ASF distribution is $2,156,354,000 in the report history after conversion from USD thousands, versus $2,156,354,137 in the audited statement. The $137 difference is source rounding. The full 2016 to2025 series retains predecessor entities and the FY2023 corporation reporting transition. Annual series p75 is expressly unaudited statistical information using audited statements, not re-audited by AMR. Amounts are distributions to ASF, not annual royalties. https://americanmineralregistry.com/research/mineral-revenue-public-school-funding-statistics#school-funding-texas-history-precision Primary sources: https://texaspsf.org/wp-content/uploads/2026/06/2025-acfr-texas-permanent-school-fund-corporation_a11y.pdf
Copy HTML attribution<a href="https://americanmineralregistry.com/research/mineral-revenue-public-school-funding-statistics#school-funding-texas-history-precision">American Mineral Registry</a>. Texas FY2025 ASF distribution is $2,156,354,000 in the report history after conversion from USD thousands, versus $2,156,354,137 in the audited statement. The $137 difference is source rounding. The full 2016 to2025 series retains predecessor entities and the FY2023 corporation reporting transition. Annual series p75 is expressly unaudited statistical information using audited statements, not re-audited by AMR. Amounts are distributions to ASF, not annual royalties. Primary sources: <a href="https://texaspsf.org/wp-content/uploads/2026/06/2025-acfr-texas-permanent-school-fund-corporation_a11y.pdf">Original primary source</a>.

Permanent finding link · Matching data (CSV) · Original producer source

Complete working tables

Open a working table to inspect every row or download its matching CSV. Each table states its period, units, scope and original sources. Display values follow the stated dataset precision, with long fractions shown to four decimal places. The dictionary explains every field, denominator and rounding rule. No account is required.

Matching denominator shares, all 4 rows

AMR Decimal calculations from exact audited inputs. NM public-schools share of distributions differs from ending assets and deposit shares. Texas subset share is not a new additive transfer.

Period: Texas: September1,2024 to August31,2025; New Mexico: July1,2024 to June30,2025. Units: USD input numerators and denominators; percentages rounded half up to two decimals.

Original sources: Texas Permanent School Fund Corporation FY2025 ACFR · New Mexico State Investment Council FY2025 audit

Matching denominator shares; Texas: September1,2024 to August31,2025; New Mexico: July1,2024 to June30,2025; USD input numerators and denominators; percentages rounded half up to two decimals
idnumerator usddenominator usdpercentdefinitionbasis
nm_school_distribution_share1,349,820,3461,494,948,45690.29NM public-schools account share of all LGPF distributionsAMR calculation from exact FY2025 source values
nm_school_asset_share32,175,000,47736,435,608,54788.31NM public-schools account share of LGPF ending fund balanceAMR calculation from exact FY2025 source values
nm_school_deposit_share2,238,849,1712,428,595,84592.19NM public-schools account share of SLO transfers to LGPFAMR calculation from exact FY2025 source values
tx_slb_subset_share600,000,0002,156,354,13727.82TX SLB subset share of total corporation ASF distributionAMR calculation from exact FY2025 source values

Download the same complete table (CSV)

Exact endowment balance bridges, all 16 rows

Beginning and ending amounts are stocks. Positive and negative middle rows are annual flows. Texas net position and NM fund balance have different accounting boundaries. NM grazing is separately identified.

Period: Texas: September1,2024 to August31,2025; New Mexico: July1,2024 to June30,2025. Units: USD exact source dollars, except explicitly labeled percentages or source USD thousands.

Original sources: Texas Permanent School Fund Corporation FY2025 ACFR · New Mexico State Investment Council FY2025 audit

Exact endowment balance bridges; Texas: September1,2024 to August31,2025; New Mexico: July1,2024 to June30,2025; USD exact source dollars, except explicitly labeled percentages or source USD thousands
entitysequencestepsigned usdroleperiodsource idsource page
Texas PSF Corporation0Beginning net position57,290,773,057stock2024-09-01/2025-08-31TXPSF19 (PDF page 27)
Texas PSF Corporation1Contributions to endowment1,009,179,029annual flow2024-09-01/2025-08-31TXPSF19 (PDF page 27)
Texas PSF Corporation2Net increase in investment fair value3,197,600,639annual flow2024-09-01/2025-08-31TXPSF19 (PDF page 27)
Texas PSF Corporation3Interest dividends and other investment income1,306,427,306annual flow2024-09-01/2025-08-31TXPSF19 (PDF page 27)
Texas PSF Corporation4Net securities lending income19,681,747annual flow2024-09-01/2025-08-31TXPSF19 (PDF page 27)
Texas PSF Corporation5Distribution to Available School Fund-2,156,354,137annual flow2024-09-01/2025-08-31TXPSF19 (PDF page 27)
Texas PSF Corporation6Other operating expenses-47,827,312annual flow2024-09-01/2025-08-31TXPSF19 (PDF page 27)
Texas PSF Corporation7Ending net position60,619,480,329stock2024-09-01/2025-08-31TXPSF19 (PDF page 27)
New Mexico Land Grant Permanent Fund0Beginning LGPF balance32,093,100,625stock2024-07-01/2025-06-30NMSIC21 (PDF page 23)
New Mexico Land Grant Permanent Fund1Royalties and land sales from SLO2,428,595,845annual flow2024-07-01/2025-06-30NMSIC21 (PDF page 23)
New Mexico Land Grant Permanent Fund2LGPF net change in fair value2,419,259,623annual flow2024-07-01/2025-06-30NMSIC21 (PDF page 23)
New Mexico Land Grant Permanent Fund3LGPF interest and dividends1,037,342,454annual flow2024-07-01/2025-06-30NMSIC21 (PDF page 23)
New Mexico Land Grant Permanent Fund4Federal Taylor Grazing Act364,436annual flow2024-07-01/2025-06-30NMSIC21 (PDF page 23)
New Mexico Land Grant Permanent Fund5Distributions to all LGPF beneficiaries-1,494,948,456annual flow2024-07-01/2025-06-30NMSIC21 (PDF page 23)
New Mexico Land Grant Permanent Fund6LGPF administration transfer-48,105,980annual flow2024-07-01/2025-06-30NMSIC21 (PDF page 23)
New Mexico Land Grant Permanent Fund7Ending LGPF fund balance36,435,608,547stock2024-07-01/2025-06-30NMSIC21 (PDF page 23)

Download the same complete table (CSV)

FY2025 entity and account crosswalk, all 19 rows

Separate Texas governmental PSF, PSF Corporation and ASF; separate New Mexico SLO and SIC LGPF. The ASF expenditure row is a statewide ACFR combining schedule. Public-schools account payout includes additional education distribution. No state rank or classroom spending claim.

Period: Texas: September1,2024 to August31,2025; New Mexico: July1,2024 to June30,2025. Units: USD exact source dollars, except explicitly labeled percentages or source USD thousands.

Original sources: Texas Permanent School Fund Corporation FY2025 ACFR · New Mexico Commissioner of Public Lands FY2025 audit · New Mexico State Investment Council FY2025 audit · Texas FY2025 statewide ACFR

FY2025 entity and account crosswalk; Texas: September1,2024 to August31,2025; New Mexico: July1,2024 to June30,2025; USD exact source dollars, except explicitly labeled percentages or source USD thousands
entitymeasureamount usdperiodsource idsource pagequalification
Texas governmental Permanent School FundLand income1,555,187,0002024-09-01/2025-08-31TXSTATE51Printed amounts in thousands converted to USD; separate from PSF Corporation
Texas governmental Permanent School FundGovernmental PSF total revenues2,151,235,0002024-09-01/2025-08-31TXSTATE51Printed amounts in thousands converted to USD; separate from PSF Corporation
Texas PSF CorporationContributions to endowment1,009,179,0292024-09-01/2025-08-31TXPSF19 (PDF page 27)Corporation only; excludes separate GLO governmental PSF land fund
Texas PSF CorporationTotal operating revenues4,523,709,6922024-09-01/2025-08-31TXPSF19 (PDF page 27)Corporation only; excludes separate GLO governmental PSF land fund
Texas PSF CorporationDistribution to Available School Fund2,156,354,1372024-09-01/2025-08-31TXPSF19 (PDF page 27)Corporation only; excludes separate GLO governmental PSF land fund
Texas PSF CorporationSLB amount already included in ASF distribution600,000,0002024-09-01/2025-08-31TXPSF23 (PDF page 31)Subset of tx_payout; never add to it
Texas PSF CorporationEnding net position60,619,480,3292024-09-01/2025-08-31TXPSF19 (PDF page 27)Corporation only; excludes separate GLO governmental PSF land fund
Texas PSF CorporationRestricted nonexpendable endowment58,095,007,2782024-09-01/2025-08-31TXPSF18 (PDF page 26)Classification of endowment net position; not annual spending
Texas Available School FundEducation expenditure3,106,373,0002024-09-01/2025-08-31TXSTATE273Printed amounts in thousands; total ASF includes tax and investment revenue, not purely mineral funding
New Mexico State Land OfficeOil and gas royalty fund land royalties2,420,433,2282024-07-01/2025-06-30NMSLO20 (PDF page 21)Governmental fund statement; SLO distribution includes deposits to SIC, not all end beneficiaries
New Mexico State Land OfficeLand suspense fund other royalties8,162,6162024-07-01/2025-06-30NMSLO20 (PDF page 21)Governmental fund statement; SLO distribution includes deposits to SIC, not all end beneficiaries
New Mexico State Land OfficeTotal land royalties2,428,595,8442024-07-01/2025-06-30NMSLO20 (PDF page 21)Governmental fund statement; SLO distribution includes deposits to SIC, not all end beneficiaries
New Mexico State Land OfficeRental income130,099,3242024-07-01/2025-06-30NMSLO20 (PDF page 21)Governmental fund statement; SLO distribution includes deposits to SIC, not all end beneficiaries
New Mexico Land Grant Permanent FundRoyalties and land sales from SLO2,428,595,8452024-07-01/2025-06-30NMSIC21 (PDF page 23)Fund 60100 only; excludes Severance Tax and Early Childhood Education and Care funds
New Mexico Land Grant Permanent FundLGPF investment revenue3,456,602,0772024-07-01/2025-06-30NMSIC21 (PDF page 23)Fund 60100 only; excludes Severance Tax and Early Childhood Education and Care funds
New Mexico Land Grant Permanent FundDistributions to all LGPF beneficiaries1,494,948,4562024-07-01/2025-06-30NMSIC21 (PDF page 23)Fund 60100 only; excludes Severance Tax and Early Childhood Education and Care funds
New Mexico LGPF public schools accountDistribution to public schools beneficiary account1,349,820,3462024-07-01/2025-06-30NMSIC63 (PDF page 65)Includes additional public education and early childhood distribution; not a K12-only classroom expenditure measure
New Mexico Land Grant Permanent FundEnding LGPF fund balance36,435,608,5472024-07-01/2025-06-30NMSIC21 (PDF page 23)Fund 60100 only; excludes Severance Tax and Early Childhood Education and Care funds
New Mexico State Land OfficeAmount due to SIC at year end393,365,2682024-07-01/2025-06-30NMSLO36 (PDF page 37)For May and June 2025 sales/distribution; settled July through September 2025

Download the same complete table (CSV)

FY2026 New Mexico announcement, separate from audited core, all 2 rows

Approximate agency total and an over lower bound. Not exact royalties, full audited FY2026 crosswalk, or classroom expenditure. Never subtract lower bound from rounded total for an exact residual.

Period: July1,2025 through June30,2026. Units: USD exact source dollars, except explicitly labeled percentages or source USD thousands.

Original sources: New Mexico SLO FY2026 agency revenue announcement

FY2026 New Mexico announcement, separate from audited core; July1,2025 through June30,2026; USD exact source dollars, except explicitly labeled percentages or source USD thousands
measurevalueunitperiodsource idqualification
Announced approximate agency revenue3,200,000,000USD2025-07-01/2026-06-30NM2026Approximate total and over lower bound respectively; not exact audited receipts or classroom spending
Announced nonroyalty revenue lower bound719,000,000USD2025-07-01/2026-06-30NM2026Approximate total and over lower bound respectively; not exact audited receipts or classroom spending

Download the same complete table (CSV)

New Mexico administrative receipts and rental distributions, all 10 rows

Not audited financial statements. Cents precision. Rental distribution subtotal includes FY2024 reapportionment. Do not interpret as a same-year rental payout ratio. Royalty source category includes land contracts.

Period: New Mexico: July1,2024 to June30,2025. Units: USD exact source dollars, except explicitly labeled percentages or source USD thousands.

Original sources: New Mexico SLO June 2025 revenue schedules, updated October 6, 2025

New Mexico administrative receipts and rental distributions; New Mexico: July1,2024 to June30,2025; USD exact source dollars, except explicitly labeled percentages or source USD thousands
measureamount usdperiodsource idsource pagequalification
Rental source subtotal130,145,539.232024-07-01/2025-06-30NMSLOADMIN6 / PDF 3Administrative schedule, not audited financial statements; rental distributions include FY2024 reapportionment
Other source subtotal30,475,267.932024-07-01/2025-06-30NMSLOADMIN6 / PDF 4Administrative schedule, not audited financial statements; rental distributions include FY2024 reapportionment
Total rental and other160,620,807.162024-07-01/2025-06-30NMSLOADMIN6 / PDF 4Administrative schedule, not audited financial statements; rental distributions include FY2024 reapportionment
Royalty source subtotal2,428,595,843.882024-07-01/2025-06-30NMSLOADMIN6 / PDF 4Administrative schedule, not audited financial statements; rental distributions include FY2024 reapportionment
Grand total agency receipts2,589,216,651.042024-07-01/2025-06-30NMSLOADMIN6 / PDF 4Administrative schedule, not audited financial statements; rental distributions include FY2024 reapportionment
Common schools rental distribution101,374,814.432024-07-01/2025-06-30NMSLOADMIN4 / PDF 1Administrative schedule, not audited financial statements; rental distributions include FY2024 reapportionment
All-beneficiary rental distribution132,996,1722024-07-01/2025-06-30NMSLOADMIN4 / PDF 1Administrative schedule, not audited financial statements; rental distributions include FY2024 reapportionment
Prior FY2024 reapportionment included32,696,890.772024-07-01/2025-06-30NMSLOADMIN4 / PDF 1Administrative schedule, not audited financial statements; rental distributions include FY2024 reapportionment
Land maintenance withholding28,544,8002024-07-01/2025-06-30NMSLOADMIN4 / PDF 1Administrative schedule, not audited financial statements; rental distributions include FY2024 reapportionment
Restoration and remediation allocation1,301,4582024-07-01/2025-06-30NMSLOADMIN4 / PDF 1Administrative schedule, not audited financial statements; rental distributions include FY2024 reapportionment

Download the same complete table (CSV)

All21 New Mexico LGPF beneficiary accounts, all 21 rows

Complete audited Exhibit1. Distributions keep the source negative sign and also supply a positive magnitude. Public schools includes additional education distribution; other20 includes educational institutions. Other capital change is net, not pure investment income.

Period: New Mexico: July1,2024 to June30,2025. Units: USD exact source dollars, except explicitly labeled percentages or source USD thousands.

Original sources: New Mexico State Investment Council FY2025 audit

All21 New Mexico LGPF beneficiary accounts; New Mexico: July1,2024 to June30,2025; USD exact source dollars, except explicitly labeled percentages or source USD thousands
beneficiarybeginning usdslo transfer usddistribution usdother capital change usdending usdreported participation percentsource idsource pageperiodsource rounding residual usddistribution magnitude usddistribution share percentasset share calculated percentbeneficiary boundary
Carrie Tingley Hospital279,3350-10,48028,995297,8500.0008NMSIC63 (PDF page 65)2024-07-01/2025-06-30010,48000Other named LGPF beneficiary, not part of common-schools account
Charitable, Penal and Reform166,415,1261,195,882-6,262,21917,334,885178,683,6740.4904NMSIC63 (PDF page 65)2024-07-01/2025-06-3006,262,2190.420.49Other named LGPF beneficiary, not part of common-schools account
Public Schools28,280,433,1642,238,849,171-1,349,820,3463,005,538,48832,175,000,47788.3065NMSIC63 (PDF page 65)2024-07-01/2025-06-3001,349,820,34690.2988.31Public schools account, includes additional education distribution
Eastern New Mexico University16,080,38729,363-604,4991,672,77617,178,0270.0472NMSIC63 (PDF page 65)2024-07-01/2025-06-300604,4990.040.05Other named LGPF beneficiary, not part of common-schools account
Improvements to the Rio Grande45,838,04095,853-1,722,4544,766,57448,978,0130.1344NMSIC63 (PDF page 65)2024-07-01/2025-06-3001,722,4540.120.13Other named LGPF beneficiary, not part of common-schools account
Miners' Colfax Medical Center187,206,3381,706,465-7,051,83019,526,936201,387,9090.5527NMSIC63 (PDF page 65)2024-07-01/2025-06-3007,051,8300.470.55Other named LGPF beneficiary, not part of common-schools account
New Mexico Boys School1,099,4200-41,246114,1121,172,2860.0032NMSIC63 (PDF page 65)2024-07-01/2025-06-30041,24600Other named LGPF beneficiary, not part of common-schools account
New Mexico Highlands University5,214,13025,663-196,199543,0295,586,6230.0153NMSIC63 (PDF page 65)2024-07-01/2025-06-300196,1990.010.02Other named LGPF beneficiary, not part of common-schools account
New Mexico Institute of Mining and Technology40,479,332564,774-1,526,8224,232,48843,749,7720.1201NMSIC63 (PDF page 65)2024-07-01/2025-06-3001,526,8220.100.12Other named LGPF beneficiary, not part of common-schools account
New Mexico Military Institute757,246,68519,466,396-28,628,18879,362,101827,446,9942.2710NMSIC63 (PDF page 65)2024-07-01/2025-06-30028,628,1881.912.27Other named LGPF beneficiary, not part of common-schools account
New Mexico School for the Deaf434,084,4677,438,518-16,390,20145,407,579470,540,3631.2914NMSIC63 (PDF page 65)2024-07-01/2025-06-30016,390,2011.101.29Other named LGPF beneficiary, not part of common-schools account
New Mexico School for the Blind and Visually Impaired433,362,2847,459,548-16,363,56545,333,933469,792,2001.2894NMSIC63 (PDF page 65)2024-07-01/2025-06-30016,363,5651.091.29Other named LGPF beneficiary, not part of common-schools account
New Mexico State Hospital93,992,2699,498,960-3,621,91610,111,825109,981,1380.3018NMSIC63 (PDF page 65)2024-07-01/2025-06-3003,621,9160.240.30Other named LGPF beneficiary, not part of common-schools account
New Mexico State University105,006,2309,018,853-4,028,19011,217,708121,214,6010.3327NMSIC63 (PDF page 65)2024-07-01/2025-06-3004,028,1900.270.33Other named LGPF beneficiary, not part of common-schools account
Northern New Mexico Community College4,275,79025,727-160,998445,6414,586,1600.0126NMSIC63 (PDF page 65)2024-07-01/2025-06-300160,9980.010.01Other named LGPF beneficiary, not part of common-schools account
Penitentiary of New Mexico487,856,86543,928,202-18,727,41652,238,818565,296,4691.5515NMSIC63 (PDF page 65)2024-07-01/2025-06-30018,727,4161.251.55Other named LGPF beneficiary, not part of common-schools account
Public Buildings-Capitol491,032,33270,769,190-19,201,98153,800,461596,400,0021.6369NMSIC63 (PDF page 65)2024-07-01/2025-06-30019,201,9811.281.64Other named LGPF beneficiary, not part of common-schools account
The University of New Mexico320,442,63317,246,120-12,210,95533,992,107359,469,9050.9866NMSIC63 (PDF page 65)2024-07-01/2025-06-30012,210,9550.820.99Other named LGPF beneficiary, not part of common-schools account
The University of New Mexico Saline Lands10,497,053495,823-400,2941,111,20211,703,7840.0321NMSIC63 (PDF page 65)2024-07-01/2025-06-300400,2940.030.03Other named LGPF beneficiary, not part of common-schools account
Water Reservoirs207,018,899755,672-7,781,49321,535,177221,528,2550.6080NMSIC63 (PDF page 65)2024-07-01/2025-06-3007,781,4930.520.61Other named LGPF beneficiary, not part of common-schools account
Western New Mexico University5,239,84625,665-197,164545,6985,614,0450.0154NMSIC63 (PDF page 65)2024-07-01/2025-06-300197,1640.010.02Other named LGPF beneficiary, not part of common-schools account

Download the same complete table (CSV)

New Mexico audited land-office pathways, all 11 rows

SLO governmental fund statement. Its beneficiary distribution line includes transfers to invested LGPF. Reapportionment is retained as a negative line. Not all destination payments are current schools.

Period: New Mexico: July1,2024 to June30,2025. Units: USD exact source dollars, except explicitly labeled percentages or source USD thousands.

Original sources: New Mexico Commissioner of Public Lands FY2025 audit

New Mexico audited land-office pathways; New Mexico: July1,2024 to June30,2025; USD exact source dollars, except explicitly labeled percentages or source USD thousands
measureamount usdperiodsource idsource pagequalification
Oil and gas royalty fund land royalties2,420,433,2282024-07-01/2025-06-30NMSLO20 (PDF page 21)Governmental fund statement; SLO distribution includes deposits to SIC, not all end beneficiaries
Land suspense fund other royalties8,162,6162024-07-01/2025-06-30NMSLO20 (PDF page 21)Governmental fund statement; SLO distribution includes deposits to SIC, not all end beneficiaries
Rental income130,099,3242024-07-01/2025-06-30NMSLO20 (PDF page 21)Governmental fund statement; SLO distribution includes deposits to SIC, not all end beneficiaries
Less reapportionment to beneficiaries-35,205,3812024-07-01/2025-06-30NMSLO20 (PDF page 21)Governmental fund statement; SLO distribution includes deposits to SIC, not all end beneficiaries
Lease revenue right to use assets3,134,0122024-07-01/2025-06-30NMSLO20 (PDF page 21)Governmental fund statement; SLO distribution includes deposits to SIC, not all end beneficiaries
Interest revenue right to use assets4,639,6742024-07-01/2025-06-30NMSLO20 (PDF page 21)Governmental fund statement; SLO distribution includes deposits to SIC, not all end beneficiaries
Other filing fees3,786,8032024-07-01/2025-06-30NMSLO20 (PDF page 21)Governmental fund statement; SLO distribution includes deposits to SIC, not all end beneficiaries
Interest income29,685,5152024-07-01/2025-06-30NMSLO20 (PDF page 21)Governmental fund statement; SLO distribution includes deposits to SIC, not all end beneficiaries
Other income64,9982024-07-01/2025-06-30NMSLO20 (PDF page 21)Governmental fund statement; SLO distribution includes deposits to SIC, not all end beneficiaries
Total revenues after reapportionment2,564,800,7892024-07-01/2025-06-30NMSLO20 (PDF page 21)Governmental fund statement; SLO distribution includes deposits to SIC, not all end beneficiaries
SLO distributions to beneficiaries, including investment deposits2,528,895,1252024-07-01/2025-06-30NMSLO20 (PDF page 21)Governmental fund statement; SLO distribution includes deposits to SIC, not all end beneficiaries

Download the same complete table (CSV)

Exact receipt categories shown in Figure2, all 6 rows

Different entity and category scopes, never a state royalty ranking. Texas broad land income is audited; GLO oil/gas receipt detail is expressly unaudited. New Mexico entries are audited SLO line values. Separate fiscal endpoints remain explicit.

Period: Texas September1,2024 to August31,2025; New Mexico July1,2024 to June30,2025. Units: USD exact source values; Texas state ACFR source thousands converted to USD.

Original sources: New Mexico Commissioner of Public Lands FY2025 audit · Texas FY2025 statewide ACFR · Texas GLO and VLB FY2025 annual financial report

Exact receipt categories shown in Figure2; Texas September1,2024 to August31,2025; New Mexico July1,2024 to June30,2025; USD exact source values; Texas state ACFR source thousands converted to USD
entitymeasureamount usdperiodbasissource idsource pagequalification
Texas governmental Permanent School FundLand income1,555,187,0002024-09-01/2025-08-31Audited source valueTXSTATE51Printed amounts in thousands converted to USD; separate from PSF Corporation
Texas GLO deposits to PSF Fund 0044 Agency 305Oil royalty896,091,5012024-09-01/2025-08-31Unaudited agency scheduleTXGLO142UNAUDITED Schedule 4; retain source classification; not PSF Corporation contribution
Texas GLO deposits to PSF Fund 0044 Agency 305Gas royalty394,907,983.262024-09-01/2025-08-31Unaudited agency scheduleTXGLO142UNAUDITED Schedule 4; retain source classification; not PSF Corporation contribution
New Mexico State Land OfficeOil and gas royalty fund land royalties2,420,433,2282024-07-01/2025-06-30Audited source valueNMSLO20 (PDF page 21)Governmental fund statement; SLO distribution includes deposits to SIC, not all end beneficiaries
New Mexico State Land OfficeLand suspense fund other royalties8,162,6162024-07-01/2025-06-30Audited source valueNMSLO20 (PDF page 21)Governmental fund statement; SLO distribution includes deposits to SIC, not all end beneficiaries
New Mexico State Land OfficeRental income130,099,3242024-07-01/2025-06-30Audited source valueNMSLO20 (PDF page 21)Governmental fund statement; SLO distribution includes deposits to SIC, not all end beneficiaries

Download the same complete table (CSV)

Source precision and beneficiary reconciliation, all 4 rows

Published amounts are preserved. $1 NM audit difference has no invented cause. Texas $137 current-year history difference reflects source thousands precision. Other beneficiaries are not all noneducation.

Period: Texas: September1,2024 to August31,2025; New Mexico: July1,2024 to June30,2025. Units: USD exact source dollars, except explicitly labeled percentages or source USD thousands.

Original sources: Texas Permanent School Fund Corporation FY2025 ACFR · New Mexico Commissioner of Public Lands FY2025 audit · New Mexico State Investment Council FY2025 audit · New Mexico SLO June 2025 revenue schedules, updated October 6, 2025

Source precision and beneficiary reconciliation; Texas: September1,2024 to August31,2025; New Mexico: July1,2024 to June30,2025; USD exact source dollars, except explicitly labeled percentages or source USD thousands
comparisonleft valueright valuedifferenceunitexplanation
NM SLO audit to SIC audit deposit2,428,595,8442,428,595,8451USDBoth audited totals retained; $1 inter-source difference, no cause inferred
NM administrative royalty to SLO audit2,428,595,843.882,428,595,8440.12USDAdministrative cents total rounds to the audited land royalty line
Texas 2025 history to exact audited payout2,156,354,0002,156,354,137137USDHistory table reports thousands of dollars; $137 is source rounding
NM public-schools distribution versus all beneficiaries1,349,820,3461,494,948,456145,128,110USDDifference belongs to 20 other named beneficiaries, including educational institutions

Download the same complete table (CSV)

Texas annual ASF distributions from the historical source schedule, all 10 rows

The report labels the statistical section unaudited. Series preserves predecessor entities and corporate reporting transition in FY2023. USD thousands retained and converted to USD. Fiscal2025 history differs $137 from exact audit due to rounding.

Period: Fiscal years ended August31,2016 through August31,2025. Units: USD exact source dollars, except explicitly labeled percentages or source USD thousands.

Original sources: Texas Permanent School Fund Corporation FY2025 ACFR

Texas annual ASF distributions from the historical source schedule; Fiscal years ended August31,2016 through August31,2025; USD exact source dollars, except explicitly labeled percentages or source USD thousands
fiscal yeardistribution usd thousandsbasissource idsource pagedistribution usd
2,0161,056,412Unaudited statistical schedule using audited statements; includes predecessor entities and SLB transfersTXPSF75 (PDF page 83)1,056,412,000
2,0171,056,412Unaudited statistical schedule using audited statements; includes predecessor entities and SLB transfersTXPSF75 (PDF page 83)1,056,412,000
2,0181,235,835Unaudited statistical schedule using audited statements; includes predecessor entities and SLB transfersTXPSF75 (PDF page 83)1,235,835,000
2,0191,535,835Unaudited statistical schedule using audited statements; includes predecessor entities and SLB transfersTXPSF75 (PDF page 83)1,535,835,000
2,0201,701,670Unaudited statistical schedule using audited statements; includes predecessor entities and SLB transfersTXPSF75 (PDF page 83)1,701,670,000
2,0211,701,670Unaudited statistical schedule using audited statements; includes predecessor entities and SLB transfersTXPSF75 (PDF page 83)1,701,670,000
2,0222,145,708Unaudited statistical schedule using audited statements; includes predecessor entities and SLB transfersTXPSF75 (PDF page 83)2,145,708,000
2,0232,190,708Unaudited statistical schedule using audited statements; includes predecessor entities and SLB transfersTXPSF75 (PDF page 83)2,190,708,000
2,0242,156,354Unaudited statistical schedule using audited statements; includes predecessor entities and SLB transfersTXPSF75 (PDF page 83)2,156,354,000
2,0252,156,354Unaudited statistical schedule using audited statements; includes predecessor entities and SLB transfersTXPSF75 (PDF page 83)2,156,354,000

Download the same complete table (CSV)

Texas total ASF payout and included SLB subset, all 3 rows

Total and subset must not be added. The remainder is AMR subtraction, not a separately identified royalty stream.

Period: Texas: September1,2024 to August31,2025. Units: USD exact source dollars, except explicitly labeled percentages or source USD thousands.

Original sources: Texas Permanent School Fund Corporation FY2025 ACFR

Texas total ASF payout and included SLB subset; Texas: September1,2024 to August31,2025; USD exact source dollars, except explicitly labeled percentages or source USD thousands
componentamount usdroleperiodsource pagesource id
Total PSF Corporation transfer to ASF2,156,354,137Total2024-09-01/2025-08-3119 and 23TXPSF
Amount within total made on behalf of SLB600,000,000Included subset, do not add2024-09-01/2025-08-3123TXPSF
Remainder after included SLB amount1,556,354,137AMR derived remainder2024-09-01/2025-08-3119 and 23TXPSF

Download the same complete table (CSV)

Texas unaudited GLO deposit detail, all 8 rows

Explicitly UNAUDITED Schedule4 p142, PSF Fund0044 Agency305 only. Selected exact receipt lines explain categories, not a complete total. Negative receipts preserved; no cause inferred.

Period: Texas: September1,2024 to August31,2025. Units: USD exact source dollars, except explicitly labeled percentages or source USD thousands.

Original sources: Texas GLO and VLB FY2025 annual financial report

Texas unaudited GLO deposit detail; Texas: September1,2024 to August31,2025; USD exact source dollars, except explicitly labeled percentages or source USD thousands
measureamount usdperiodsource idsource pagequalification
Oil royalty896,091,5012024-09-01/2025-08-31TXGLO142UNAUDITED Schedule 4; retain source classification; not PSF Corporation contribution
Gas royalty394,907,983.262024-09-01/2025-08-31TXGLO142UNAUDITED Schedule 4; retain source classification; not PSF Corporation contribution
Oil and gas lease bonus36,358,330.862024-09-01/2025-08-31TXGLO142UNAUDITED Schedule 4; retain source classification; not PSF Corporation contribution
Shut in mineral royalty104,231,625.282024-09-01/2025-08-31TXGLO142UNAUDITED Schedule 4; retain source classification; not PSF Corporation contribution
Mining lease royalty566,972.152024-09-01/2025-08-31TXGLO142UNAUDITED Schedule 4; retain source classification; not PSF Corporation contribution
Mining lease rental and bonus2,404,382.242024-09-01/2025-08-31TXGLO142UNAUDITED Schedule 4; retain source classification; not PSF Corporation contribution
State Power Program receipts-180,350.092024-09-01/2025-08-31TXGLO142UNAUDITED Schedule 4; retain source classification; not PSF Corporation contribution
Miscellaneous receipts-32,170,442.222024-09-01/2025-08-31TXGLO142UNAUDITED Schedule 4; retain source classification; not PSF Corporation contribution

Download the same complete table (CSV)

Data and downloads

Read the tables directly or download the research. No form or account is required.

Reproducible research bundle (ZIP) · Research reference (PDF, 2 pages, 167 KB) · Full data dictionary · Calculation program (Python)

Derived shares 2025 (CSV)

Fund balance bridges 2025 (CSV)

Fund crosswalk 2025 (CSV)

Newer announcement separate (CSV)

Nm administrative receipts and rentals 2025 (CSV)

Nm beneficiaries 2025 (CSV)

Nm land office audited pathways 2025 (CSV)

Receipt category comparison 2025 (CSV)

Reconciliation register (CSV)

Source cells (CSV)

Texas asf distributions 2016 2025 (CSV)

Texas distribution components 2025 (CSV)

Texas unaudited receipt detail 2025 (CSV)

Cite this page

Preserve the entity, fiscal window, beneficiary account, audit status and stock or flow distinction. AMR calculations credit the original financial reports.

American Mineral Registry. "Mineral Revenue and Public School Funding: Texas and New Mexico." American Mineral Registry, November 2026. https://americanmineralregistry.com/research/mineral-revenue-public-school-funding-statistics/
<a href="https://americanmineralregistry.com/research/mineral-revenue-public-school-funding-statistics/">Mineral Revenue and Public School Funding</a> (American Mineral Registry, November 2026)