Texas collected $8.31B in state oil and natural gas production taxes in fiscal 2026, with $5.88B from oil and $2.43B from natural gas. Oil represented 70.7% of the two taxes combined. Fiscal 2026 ran from September 1, 2025, through August 31, 2026.
Texas collected $8.31B in oil and natural gas production taxes in fiscal 2026. Oil accounted for 70.7%, or $5.88B, while gas accounted for $2.43B. Compare ten fiscal years of state cash receipts and see which commodity drove each annual change.
Key findings
- $8.31B · Combined production taxes in FY2026
Oil and natural gas production tax collections in Texas state funds, excluding trust funds. - 70.7% · Oil’s share in FY2026
Oil production tax divided by the two production taxes combined. - 9.4% · Share of all Texas state tax collections in FY2026
The two production taxes divided by $88.23B of all-funds tax collections, excluding trust funds. - 32.7% · FY2026 receipts below FY2022 after inflation
Purchasing-power comparison using twelve monthly U.S. PCE price index observations per Texas fiscal year.
Texas production tax receipts peaked in fiscal 2022
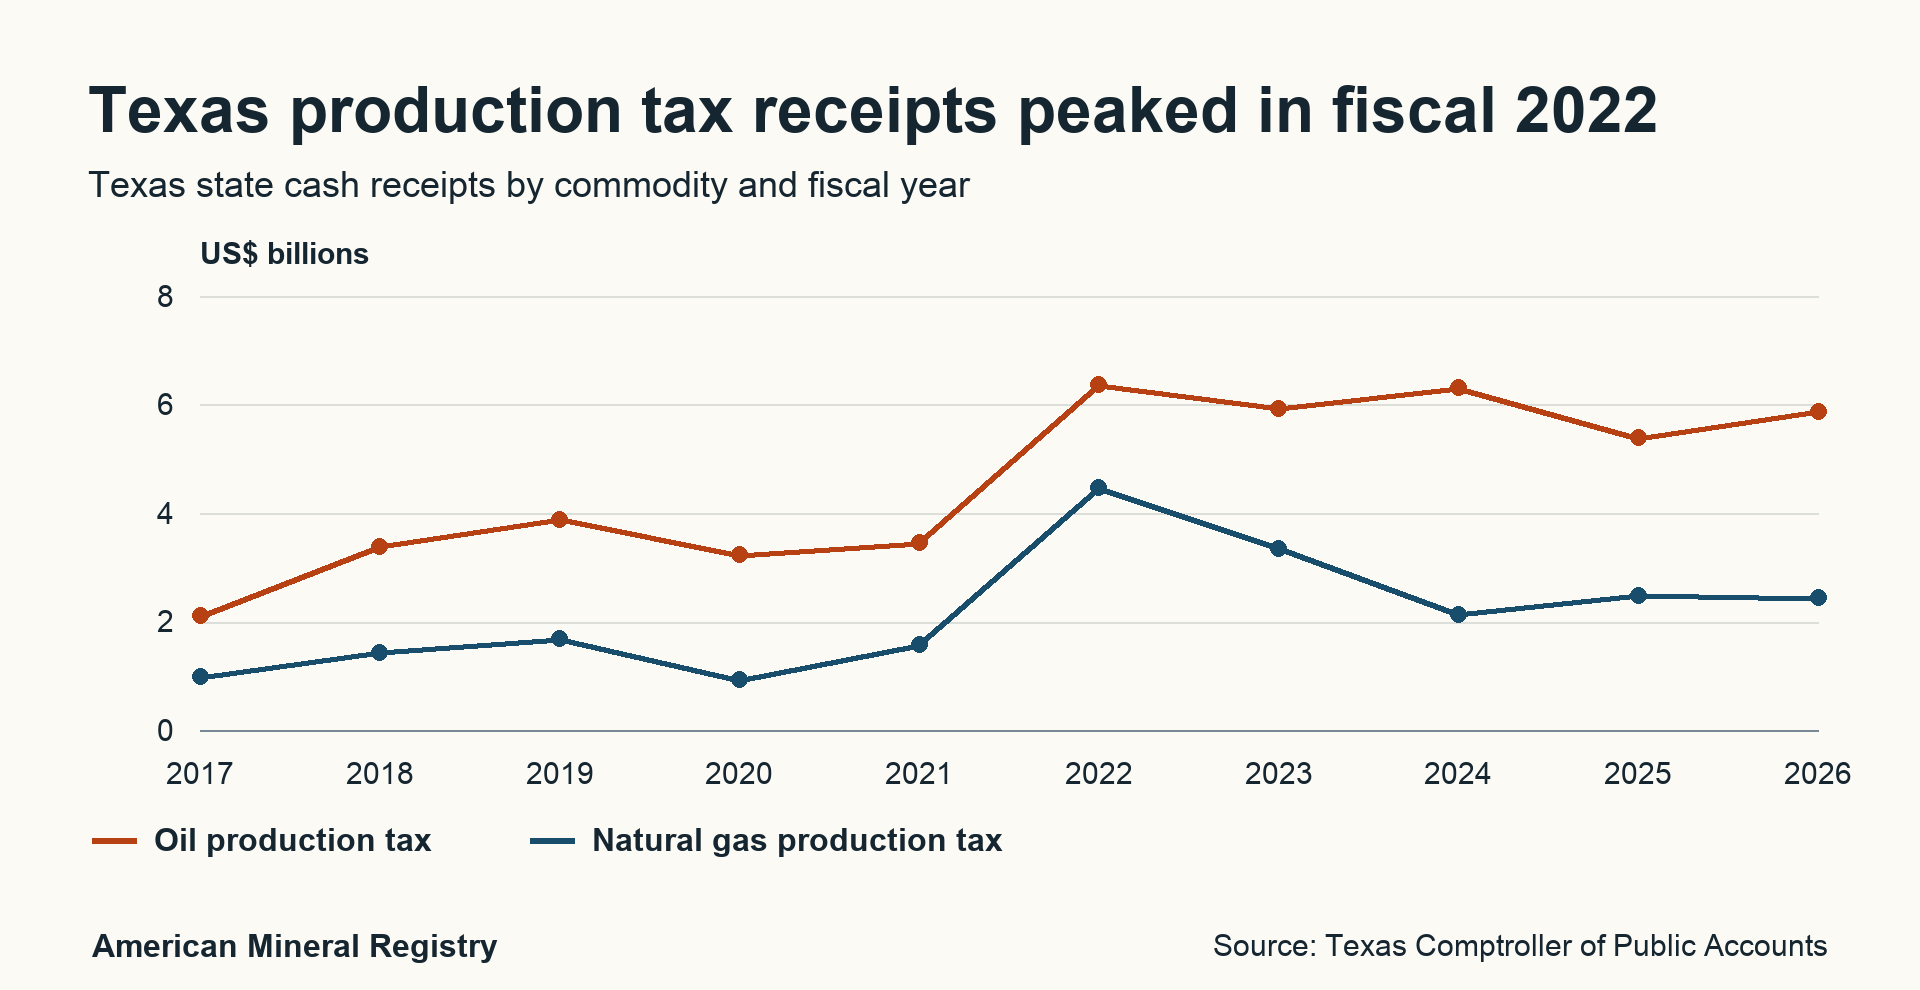
Figure 1 in text
Texas production tax receipts peaked in fiscal 2022. Texas state cash receipts by commodity and fiscal year. Unit: US$ billions.
Texas Comptroller Annual Cash Reports, Table 3. The largest receipt year shown was FY2022 for both commodities. Each Texas fiscal year ends August 31. Values are nominal.
| Label | Oil production tax | Natural gas production tax |
|---|---|---|
| 2017 | 2.107335182 | 0.982762914 |
| 2018 | 3.391517599 | 1.431106198 |
| 2019 | 3.886823879 | 1.685680675 |
| 2020 | 3.229346924 | 0.925472744 |
| 2021 | 3.449131602 | 1.568541762 |
| 2022 | 6.36168747764 | 4.46994545559 |
| 2023 | 5.93104219287 | 3.35037297686 |
| 2024 | 6.30415353178 | 2.13363986643 |
| 2025 | 5.38366822488 | 2.47928262402 |
| 2026 | 5.87655105319 | 2.43440606152 |
Download these plotted values (CSV)
Permanent link to this figure’s text and data · Sources and context
What changed in fiscal 2026?
Combined collections rose 5.7% from fiscal 2025. Oil collections increased by $492.9 million while gas collections fell by $44.9 million. The net increase was $448.0 million. That breakdown explains how the total went up while one of its components went down.
Oil’s share rose from 68.5% to 70.7%. These receipts represented 9.4% of all state tax collections in fiscal 2026. The Comptroller reported total state tax collections of $88.23B, a denominator that includes sales, franchise and other taxes. Annual Cash Report, Table 3
How monthly cash receipts move
Across the 120 receipt months from September 2016 through August 2026, the median combined month was $563.4M. Monthly receipts ranged from $102.9M in June 2020 to $1.23B in July 2022. The largest month was 11.9 times the smallest. Gas reached its monthly peak of $532.3M in July 2022. Oil reached its own peak of $736.4M in June 2026, in a different fiscal year.
The largest three months in fiscal 2026 accounted for 31.9% of the year's combined cash. The biggest monthly increase from the same month a year earlier was $329.3M in June 2026. The biggest year-over-year drop was $155.3M in March 2026. A particularly strong or weak receipt month can dominate a short window.
| Cash receipt month | Oil | Natural gas | Combined | Combined vs. same month in FY2025 |
|---|---|---|---|---|
| September 2025 | $444.0M | $223.6M | $667.6M | -6.6% |
| October 2025 | $405.0M | $228.0M | $633.0M | +2.4% |
| November 2025 | $412.8M | $168.7M | $581.6M | -9.9% |
| December 2025 | $393.8M | $168.6M | $562.4M | -12.8% |
| January 2026 | $383.9M | $189.1M | $572.9M | -11.1% |
| February 2026 | $386.2M | $181.2M | $567.5M | -19.7% |
| March 2026 | $378.2M | $179.6M | $557.8M | -21.8% |
| April 2026 | $567.0M | $223.3M | $790.3M | +18.1% |
| May 2026 | $676.7M | $217.2M | $893.9M | +40.1% |
| June 2026 | $736.4M | $212.1M | $948.5M | +53.2% |
| July 2026 | $566.8M | $241.2M | $808.0M | +32.4% |
| August 2026 | $525.6M | $201.8M | $727.4M | +13.8% |
The source shows $-15.0M in net gas receipts in August 2020. The month remains in the dataset and its fiscal total. A negative cash entry reports a net reduction in booked revenue for that month. The aggregate workbook cannot identify the underlying transactions or their cause.
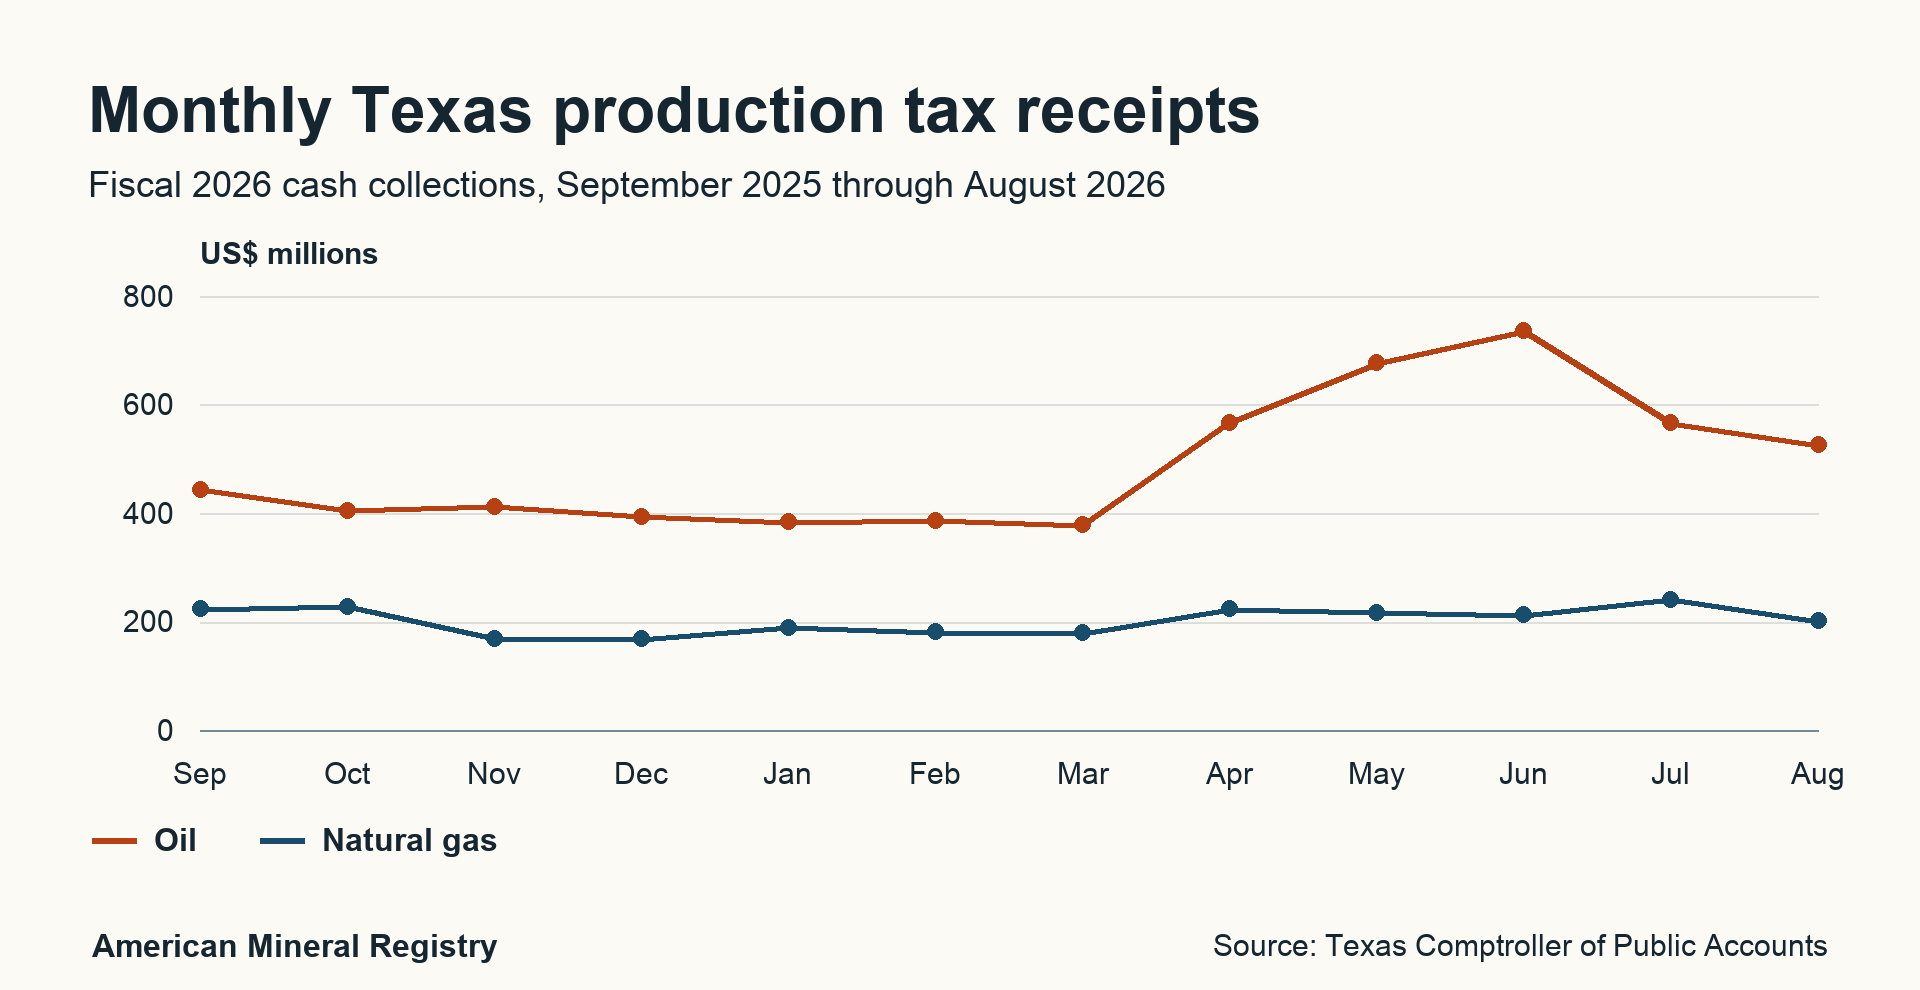
Figure 2 in text
Monthly Texas production tax receipts. Fiscal 2026 cash collections, September 2025 through August 2026. Unit: US$ millions.
Comptroller Monthly State Revenue Watch, All Funds excluding trust funds. The horizontal axis is the month the state recorded cash. Each line is nominal dollars.
| Label | Oil | Natural gas |
|---|---|---|
| Sep | 444.01113 | 223.57918 |
| Oct | 405.01432 | 228.03271 |
| Nov | 412.83377 | 168.74212 |
| Dec | 393.81831 | 168.60068 |
| Jan | 383.8525 | 189.08902 |
| Feb | 386.24833 | 181.21628 |
| Mar | 378.24999 | 179.59781 |
| Apr | 567.02836 | 223.3178 |
| May | 676.69445 | 217.19247 |
| Jun | 736.40065 | 212.05535 |
| Jul | 566.76873 | 241.19668 |
| Aug | 525.63053 | 201.78597 |
Download these plotted values (CSV)
Permanent link to this figure’s text and data · Sources and context
Why the fiscal year and calendar year can tell different stories
Combined fiscal 2026 receipts were down 9.8% through February compared with the first six months of fiscal 2025. Receipts in the second half were up 21.5%. The full fiscal year finished up 5.7%. The four matched cutoffs show how the story evolved as more months came in.
| Cash months counted | FY2025 | FY2026 | FY2026 change |
|---|---|---|---|
| September–November | $1.98B | $1.88B | -4.8% |
| September–February | $3.97B | $3.59B | -9.8% |
| September–May | $5.99B | $5.83B | -2.8% |
| September–August | $7.86B | $8.31B | +5.7% |
Calendar 2022 receipts were $11.77B, compared with $10.83B for fiscal 2022. The same year label covered a different set of months, a difference of $936.7M. Calendar 2025 totaled $7.69B, compared with $7.86B in fiscal 2025. September through December 2025 belongs to fiscal 2026. Use fiscal receipts for a Texas budget question and calendar receipts for a January-through-December comparison.
| Year label | September–August fiscal total | January–December calendar total | Calendar vs. fiscal |
|---|---|---|---|
| 2017 | $3.09B | $3.50B | +13.3% |
| 2018 | $4.82B | $5.43B | +12.5% |
| 2019 | $5.57B | $5.44B | -2.4% |
| 2020 | $4.15B | $3.46B | -16.6% |
| 2021 | $5.02B | $6.82B | +35.9% |
| 2022 | $10.83B | $11.77B | +8.6% |
| 2023 | $9.28B | $8.42B | -9.3% |
| 2024 | $8.44B | $8.07B | -4.3% |
| 2025 | $7.86B | $7.69B | -2.3% |
The study has complete calendar years 2017 through 2025. It reports full fiscal years through August 2026. For an in-progress fiscal year, sum the months available and compare with the same number of months in the prior year.
The ten-year peak and the years when oil’s share moved most
The two taxes brought in $67.38B across fiscal 2017 through 2026. Oil contributed $45.92B, or 68.2% of the decade’s combined receipts. Annual collections ranged from $3.09B in fiscal 2017 to $10.83B in fiscal 2022. Fiscal 2026 collections were 23.3% below that peak.
Oil represented the largest share of the combined receipts in fiscal 2020, at 77.7%. Oil receipts fell 16.9% that year and gas receipts fell 45.1%. Oil gained share because gas receipts fell faster.
In fiscal 2022, oil’s share reached its lowest point in the series at 58.7% even though oil receipts reached their own high. Gas receipts grew 185.0% from fiscal 2021, compared with oil’s 84.4% increase. The two taxes accounted for 14.0% of all state tax collections that year.
How much of the change came from oil or gas?
The combined number can move sharply even when oil and gas move in opposite directions. Use the dollar changes to identify the commodity that contributed most to the movement.
| Fiscal year | Oil | Natural gas | Combined |
|---|---|---|---|
| 2020 | -657.5 | -760.2 | -1,417.7 |
| 2022 | +2,912.6 | +2,901.4 | +5,814.0 |
| 2023 | -430.6 | -1,119.6 | -1,550.2 |
| 2024 | +373.1 | -1,216.7 | -843.6 |
| 2026 | +492.9 | -44.9 | +448.0 |
Gas represented 53.6% of the FY2020 decline. Oil and gas contributed almost equal dollar amounts to the FY2022 increase. Gas represented 72.2% of the FY2023 decline. In FY2024, oil receipts recovered while a larger drop in gas receipts pulled the combined amount down. These are accounting contributions. Explaining why the receipts changed would also require matching the taxable values, production, incentives and timing of payments.
How much buying power did Texas collect?
Fiscal 2026 receipts grew 5.7% in nominal dollars and 2.5% after adjusting for consumer prices. Fiscal 2026 came in 23.3% below the nominal peak and 32.7% below the inflation-adjusted peak. In FY2026 dollars, fiscal 2022 collections equal $12.35B.
| Fiscal year | As collected | In FY2026 dollars | Nominal change | Inflation-adjusted change |
|---|---|---|---|---|
| 2017 | $3.09B | $4.03B | +35.3% | +33.2% |
| 2018 | $4.82B | $6.17B | +56.1% | +53.0% |
| 2019 | $5.57B | $7.01B | +15.5% | +13.7% |
| 2020 | $4.15B | $5.17B | -25.4% | -26.3% |
| 2021 | $5.02B | $6.08B | +20.8% | +17.7% |
| 2022 | $10.83B | $12.35B | +115.9% | +103.0% |
| 2023 | $9.28B | $10.09B | -14.3% | -18.3% |
| 2024 | $8.44B | $8.92B | -9.1% | -11.6% |
| 2025 | $7.86B | $8.11B | -6.8% | -9.1% |
| 2026 | $8.31B | $8.31B | +5.7% | +2.5% |
We use the BEA’s national all-items PCE price index, seasonally adjusted and distributed by the Federal Reserve Bank of St. Louis. For each fiscal year, we average September through August. To express a year's receipts in FY2026 dollars, multiply by the FY2026 average and divide by that year's average. The CSV includes the exact monthly index sums, which give the same ratio because both years contain twelve months. The index measures U.S. consumer purchasing power. State construction, payroll and energy costs can follow different patterns.
How much did production taxes move the statewide total?
Fiscal 2026 production taxes were 9.4% of all state tax collections. They were 4.4% of the broader $188.90B in total net state revenue, which also includes federal income and other nontax receipts. Both denominators use the Comptroller’s all-funds scope excluding trust funds.
| Fiscal year | Production taxes, percentage points | All other state taxes, percentage points | Total growth |
|---|---|---|---|
| 2020 | -2.39 | -0.98 | -3.4% |
| 2022 | +9.46 | +16.14 | +25.6% |
| 2023 | -2.01 | +8.40 | +6.4% |
| 2024 | -1.03 | +0.70 | -0.3% |
| 2025 | -0.70 | +3.54 | +2.8% |
| 2026 | +0.53 | +4.25 | +4.8% |
For fiscal 2026, production taxes added 0.53 percentage points to the 4.8% growth in total tax collections. Production taxes pulled against statewide growth in fiscal 2023 and fiscal 2025, when other taxes grew enough to leave the total higher. Divide each component’s dollar change by the previous year’s total tax collections to calculate its contribution. Comptroller Table 3, including total net revenue
What these Texas production tax figures measure
We use the Comptroller’s Oil Production Tax and Natural Gas Production Tax revenue lines, listed as object codes 3290 and 3291 in the fiscal 2026 report. These are amounts collected and recorded in the state treasury. Cash receipts reflect when the state collected the money and can include payments or adjustments tied to production in an earlier period. Annual Cash Report archive
Texas lists a headline oil production tax rate of 4.6% of market value and a natural gas production tax rate of 7.5% of market value. The Comptroller also lists separate rules for condensate, incentives and regulatory fees. Those rates and rules describe tax calculation. This study measures the resulting recorded receipts. The two receipts are one part of a broader state and local fiscal picture.
For fiscal 2025, TXOGA reported $27.0 billion in state and local taxes and state royalties. The Comptroller’s two state production taxes totaled $7.86B for that same fiscal year. Use the broader number for TXOGA’s industry measure and the narrower number when describing the two state production taxes. Each figure needs its own label in a chart or headline.
Production volume, taxable prices, incentives and the timing of payments can all affect receipts. The receipt series shows how much collections changed. Measuring the contribution of each factor would require separate production, price and tax-accounting data for the matching periods.
How Texas calculates oil and gas production tax
The Comptroller’s oil and gas tax FAQ describes the standard rates as percentages of net taxable value. Its producer instructions calculate that value on lease detail and show oil governmental royalty value separately where the exempt status applies. This is one reason statewide receipts divided by a statutory rate cannot recover statewide gross sales value.
| Commodity | Standard tax | Usual reporting or payment role |
|---|---|---|
| Crude oil | 4.6% of market value subject to tax | Texas describes the first purchaser as the usual payer. Crude oil production tax |
| Natural gas | 7.5% of market value subject to tax | Primarily the producer, with a purchaser able to agree to pay under the contract. Natural gas production tax |
| Condensate | 4.6% of market value subject to tax | The Comptroller lists this rate on its natural gas tax page. |
At the standard rates, $100,000 of net taxable value would produce $4,600 of crude oil tax or $7,500 of natural gas tax before any separate fee or relief. The Comptroller lists cleanup regulatory fees separately, including a gas fee based on taxable volume. The worked amounts are base tax examples. A statewide cash collection records the proceeds under its booked revenue line.
The Comptroller’s rate history shows those standard oil and gas rates were already in place before the study period and remained in place across it. When cash receipts change, check taxable value, production volumes, applicable relief and cash timing before drawing a conclusion about the rate. A benchmark oil or gas price alone cannot account for the values reported across all leases.
How exemptions, credits and fees affect the amount paid
A tax exemption or reduced rate changes how the liability is calculated on eligible production. A verified credit can affect the amount paid in a later reporting period or be refunded. A separate regulatory fee is reported in its own calculation.
| Mechanism | Official example | How to interpret receipts |
|---|---|---|
| Certified reduced rate | Enhanced oil recovery can qualify for a 2.3% rate. Certified high-cost gas can qualify for a well-specific rate from 0% to 7.5%. | Eligible production can generate less tax on the same taxable value. |
| Certified exemption | Qualifying gas from two-year inactive wells can be taxed at 0%. | Statewide production counts and taxable production can have different coverage. |
| Credits and relief | The Comptroller publishes rules for low-producing oil leases and low-producing gas wells. Its processing guidance explains refunds after verification. | A cash entry can reflect the resolution of an earlier liability. |
| Separate regulatory fee | The oil producer return instructions show the cleanup assessment and production tax on separate lines. | Use the named production tax receipt line for the comparisons here. |
The low-producing rules require qualifying production and a price test. For the August 2026 reporting period, the certified oil price was $53.55 per barrel, above the $30 credit ceiling. The certified gas price was $1.36 per Mcf, within the 100% credit band for qualifying gas. The gas rules exclude casinghead gas from oil wells and condensate from gas wells from that particular credit. These are certified tax-program prices and apply under the program’s eligibility rules.
The oil producer return instructions also describe transferring an outstanding credit from one reporting period to offset tax and fees in another. The study can measure aggregate cash, including any net adjustments in the state’s reported lines. Assigning a monthly movement to a specific incentive would require a separate series for the affected liabilities or transactions.
When production is reported and when cash appears
Ordinary monthly crude oil reports are due on the 25th of the month after production. Monthly gas reports are due on the 20th of the second month after production. The Comptroller lists February 20 for qualifying annual gas filers for the preceding year. The official calendar and applicable filing status govern individual deadlines.
Consider July production with an ordinary monthly filing schedule. Its crude oil report is due in August and its natural gas report is due in September, crossing the August 31 state fiscal cutoff. A scheduled due date helps explain why the receipt months can differ. The cash table books the actual cash period, so an early, late, corrected or annual payment can change the month that appears in the dataset.
The Annual Cash Report records revenue when cash is collected. An accrual or production-month series attaches an amount to a different accounting event. A comparison with Railroad Commission volumes needs the appropriate production dates, product definitions and data vintages as well as a defensible cash-to-production mapping. The Comptroller FAQ distinguishes the RRC production report from the Comptroller tax return and describes how corrections can change the tax due.
For a particular mineral interest, the statewide table cannot identify who filed, which production was included, how a payment was allocated or which charge appears on the royalty statement. Use the applicable lease, operator statement and official filing information when asking those questions.
Where do the production taxes go?
The Comptroller reported a $5.48 billion transfer to the Economic Stabilization Fund and the State Highway Fund in November 2024. The transfer was calculated from production tax revenues above the corresponding 1987 thresholds. The Comptroller describes the eligible amount as 75% of that excess, with the distribution subject to constitutional rules including the stabilization fund cap.
The same announcement describes the highway allocation as funding non-toll highway construction, maintenance and right-of-way acquisition. A collection, an interfund transfer and a later program expenditure belong to different accounting stages. Adding a later transfer to the original receipts double-counts the movement of money.
The $8.44B recorded in fiscal 2024 and the $5.48 billion announced after year-end are different accounting events. The first is tax collected. The second is a transfer of eligible proceeds between funds. In its fiscal 2026 year-end release, the Comptroller announced a $2.69 billion November 2026 transfer to the State Highway Fund and said the Economic Stabilization Fund would receive no transfer because it was above its cap.
Which figure should you use in a story?
| Question | Figure to use | Scope |
|---|---|---|
| How much did Texas collect from producing oil and gas? | $8.31B in FY2026 | Texas state oil and natural gas production tax receipts |
| How large were these taxes within state tax receipts? | 9.4% in FY2026 | The same two lines divided by all state tax collections excluding trust funds |
| How did these taxes compare with the 2022 peak? | 32.7% lower in FY2026 dollars | Compare a consistent fiscal-year purchasing-power basis |
| What was the wider industry figure? | $27.0B in FY2025 | TXOGA’s measure of state and local taxes and state royalties, for the fiscal year specified |
For a budget comparison, say which denominator you used. For a commodity comparison, give both receipts lines or use the combined total. For an industry comparison, keep the same fiscal year and name the taxes and royalties included. A transfer, a tax rate and the value of production answer separate questions.
How to verify or reuse the data
- Use the year ended August 31 in the Comptroller’s Annual Cash Report Table 3. The row-level download links to the source edition and exact column or cells.
- Add Oil Production Tax and Natural Gas Production Tax to get combined collections. For fiscal 2026, $5,876,551,053.19 plus $2,434,406,061.52 equals $8,310,957,114.71.
- Divide oil receipts by combined receipts for the commodity mix. Divide combined receipts by Total Tax Collections for their share of all state tax collections. Multiply each ratio by 100.
- For year-over-year change, divide current-year receipts by prior-year receipts, subtract 1, and multiply by 100. The CSV gives the fiscal 2016 inputs used to calculate fiscal 2017 changes.
We reconciled both production tax lines for each of the ten study years against the All Funds Historical workbook and the General Revenue-related Funds Historical workbook. The annual Cash Report is the source for the figures shown here. Earlier PDFs display whole dollars. The fiscal 2026 workbook provides dollar-and-cent amounts for fiscal 2022 through 2026.
For monthly work, use the second download. In each named fiscal-year worksheet, the 12 September-through-August columns sit in B through M. Row 8 is oil, row 11 is gas and row 16 is all state tax collections in the All Funds workbook. The monthly source reports thousands of dollars. The download converts those values to dollars and preserves the source cell references. The oil and gas values were checked month by month against the General Revenue-related Funds workbook. Use the All Funds workbook for the total-tax denominator. Independently rounded monthly values can sum to slightly different totals than the Annual Cash Report.
When citing the series, give the fiscal year, the denominator and the source. The decade share uses the sum of oil receipts divided by the sum of both receipts, so years with more collections carry more weight. The downloaded CSV supports that calculation and comparisons in both nominal and FY2026 dollars. Displayed components can sum to a slightly different figure after rounding.
For a partial fiscal year, compare collections through the same month in both years. For a full-year comparison, use the annual tables after August. The current series ends in August 2026.
Texas oil and natural gas production tax collections, FY2017 to FY2026
| Fiscal year | Oil | Natural gas | Combined | Oil share | Oil YoY | Gas YoY | Combined YoY | Share of all state taxes |
|---|---|---|---|---|---|---|---|---|
| 2017 | $2.11B | $0.98B | $3.09B | 68.2% | +23.6% | +69.8% | +35.3% | 6.2% |
| 2018 | $3.39B | $1.43B | $4.82B | 70.3% | +60.9% | +45.6% | +56.1% | 8.7% |
| 2019 | $3.89B | $1.69B | $5.57B | 69.8% | +14.6% | +17.8% | +15.5% | 9.4% |
| 2020 | $3.23B | $0.93B | $4.15B | 77.7% | -16.9% | -45.1% | -25.4% | 7.2% |
| 2021 | $3.45B | $1.57B | $5.02B | 68.7% | +6.8% | +69.5% | +20.8% | 8.2% |
| 2022 | $6.36B | $4.47B | $10.83B | 58.7% | +84.4% | +185.0% | +115.9% | 14.0% |
| 2023 | $5.93B | $3.35B | $9.28B | 63.9% | -6.8% | -25.0% | -14.3% | 11.3% |
| 2024 | $6.30B | $2.13B | $8.44B | 74.7% | +6.3% | -36.3% | -9.1% | 10.3% |
| 2025 | $5.38B | $2.48B | $7.86B | 68.5% | -14.6% | +16.2% | -6.8% | 9.3% |
| 2026 | $5.88B | $2.43B | $8.31B | 70.7% | +9.2% | -1.8% | +5.7% | 9.4% |
Common questions
How much did Texas collect in oil and gas production taxes in FY2026?
Texas collected $8.31B, including $5.88B in oil production tax and $2.43B in natural gas production tax.
What percentage of Texas oil and gas production tax revenue came from oil?
Oil accounted for 70.7% of the two taxes combined in fiscal 2026. Across fiscal 2017 through 2026, it accounted for 68.2% of cumulative receipts.
What share of Texas state tax collections came from production taxes?
Oil and gas production taxes accounted for 9.4% of all Texas state tax collections in fiscal 2026, using the Comptroller’s all-funds measure excluding trust funds.
Which fiscal year had the highest combined receipts?
Fiscal 2022 had the highest combined receipts in the FY2017 to FY2026 study, at $10.83B.
Do these receipts cover county property taxes or mineral royalties?
The series covers the two Texas state production tax lines. County property taxes, private royalty payments and state royalty receipts are separate measures.
When does the Texas fiscal year end?
The Texas fiscal year ends August 31. Fiscal 2026 covers September 1, 2025, through August 31, 2026.
Did Texas production tax receipts rise after inflation in FY2026?
Yes. Receipts rose 2.5% in FY2026 dollars compared with FY2025 using fiscal-year average PCE prices. The nominal increase was 5.7%.
How do I compare Texas production tax receipts before the fiscal year ends?
Sum cash collections from September through the latest available month and compare with the same months in the preceding fiscal year. The monthly download gives fiscal-month numbers for matching. Fiscal 2026 was down 9.8% through February and up 5.7% by the full-year close.
What are the standard Texas oil and gas production tax rates?
The standard rates are 4.6% of taxable market value for crude oil and condensate and 7.5% for natural gas. The Comptroller lists different rules for qualified exemptions, credits and separately assessed regulatory fees.
Why can tax cash arrive months after production?
Monthly oil returns ordinarily fall due in the next month. Monthly gas returns ordinarily fall due in the second month after production. The state cash series is recorded when payment is collected. Annual filing, credits, amended returns and early or late payments can affect when it is recorded.
Sources and downloads
- Download the complete data (CSV)
- Download 120 months of Texas production tax receipts (CSV) September 2016 through August 2026. Both production tax lines, all state taxes, fiscal labels and source cells.
- Download chart (PNG)
- Texas Comptroller Annual Cash Report archive · State treasury cash accounting basis and annual editions.
- FY2020 Annual Cash Report · Table 3, printed pages 12 and 13. FY2016 baseline and FY2017 through FY2020 input amounts.
- FY2022 Annual Cash Report · Table 3, printed page 13 for FY2021. Overlapping earlier years and FY2022 provide cross-checks.
- FY2026 Annual Cash Report workbook · Table 3 for FY2022 through FY2026 amounts. Table 12 identifies codes 3290 and 3291.
- Monthly State Revenue Watch, All Funds · Historical workbooks reconcile the production tax lines for all ten years.
- All Funds Historical workbook · 120 monthly cash records across ten named fiscal worksheets. Columns B through M, rows 8, 11 and 16.
- General Revenue-related Funds Historical workbook · Reconciliation source for the two commodity lines. Total tax collections have a different scope.
- Texas Comptroller FY2026 revenue release · Cross-check of rounded receipts and annual changes, and the announced November 2026 fund transfer.
- Texas Comptroller November 2024 fund transfer · Actual transfer amount and description of the excess-revenue calculation.
- BEA PCE price index · Definition and release information for the national consumer price index used for the adjustment.
- BEA monthly PCE price index via the St. Louis Fed · Monthly, seasonally adjusted, 2017 = 100. The study uses September 2015 through August 2026.
- Texas Comptroller oil production tax · Oil tax base, rate, regulatory items and exemptions.
- Texas Comptroller natural gas production tax · Gas tax base and rate, condensate, incentives and fees.
- Texas Comptroller production tax FAQ · Net taxable value, liability questions and the distinction between production and tax reports.
- Texas Comptroller rate history · Dates and standard rates for oil, natural gas and condensate.
- Texas Comptroller crude oil producer form instructions · Lease detail, net taxable value, filing timing, fees and credit transfers.
- Texas Comptroller low-producing oil lease credits · Oil qualification rules, certified reporting-month prices and price bands.
- Texas Comptroller low-producing gas well credits · Gas qualification rules, certified reporting-month prices and exclusions.
- Texas Comptroller credit processing · Verification, offset and refund treatment.
- TXOGA annual impact report · Defines the broader headline that combines state and local taxes and state royalties.
Attribute AMR’s analysis and chart to American Mineral Registry. Reuse the analysis and chart under CC BY 4.0. Original source materials retain the issuers’ own terms.