Across all 24 production months of 2023 and 2024, the Railroad Commission of Texas revised its first statewide crude oil totals upward by a median of 22.2% and its natural gas totals by 15.8% in the following year's same-month releases. Both commodities were revised upward in every month.
Updated statewide volumes show 2024 crude oil production rose 5.19% and natural gas rose 4.84% from 2023. Comparing first 2024 volumes with updated 2023 volumes makes both appear to fall. The study also compares first-half 2025 and 2024 at matched reporting ages.
Key findings
- +22.2% · Median crude oil revision
24 statewide monthly comparisons across 2023 and 2024. Oil from oil leases, excluding condensate. - +15.8% · Median natural gas revision
24 statewide monthly comparisons across 2023 and 2024. Gas volumes reported in Mcf. - 12 of 12 · Oil growth comparisons that flipped sign
October and every other 2025 month changed direction when using the updated 2024 base.
How much the first Texas production figures changed
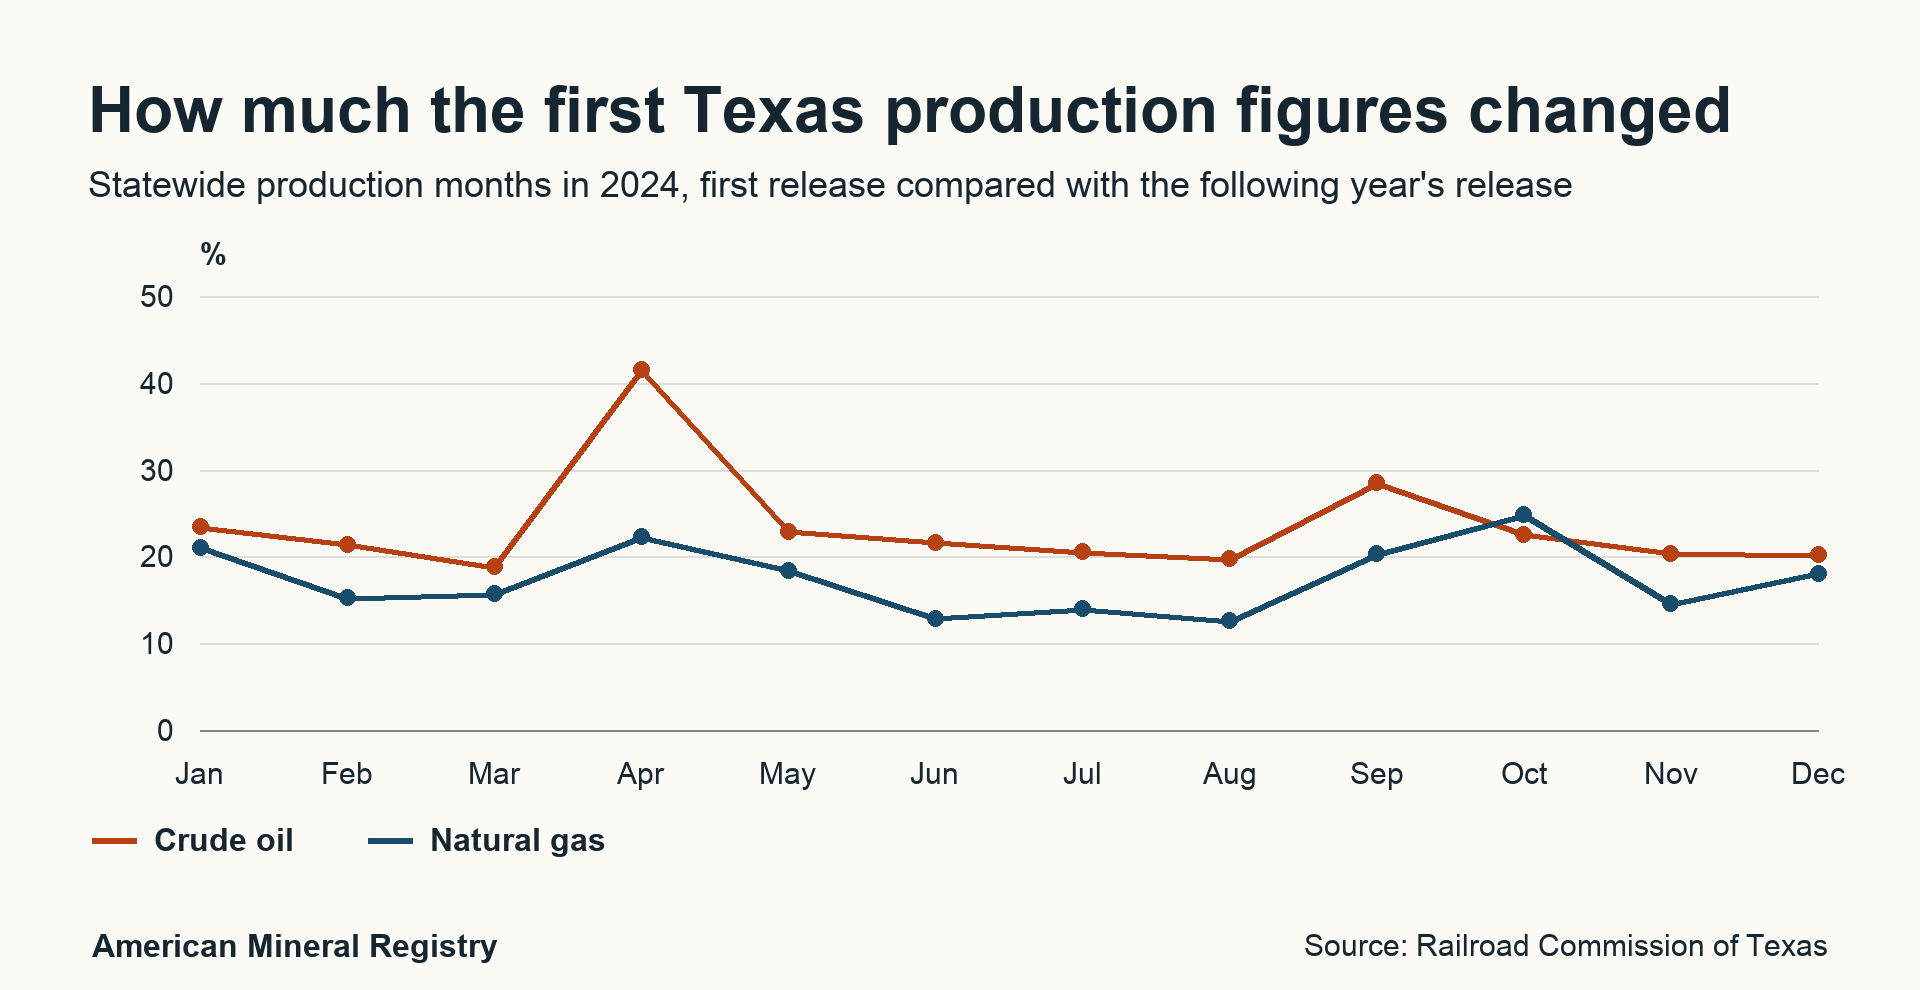
Figure 1 in text
How much the first Texas production figures changed. Statewide production months in 2024, first release compared with the following year's release. Unit: %.
Change as a percentage of the first reported volume. Source: AMR calculations using Railroad Commission of Texas monthly releases.
| Label | Crude oil | Natural gas |
|---|---|---|
| Jan | 23.41 | 21.04 |
| Feb | 21.41 | 15.23 |
| Mar | 18.79 | 15.69 |
| Apr | 41.52 | 22.25 |
| May | 22.87 | 18.4 |
| Jun | 21.64 | 12.85 |
| Jul | 20.56 | 13.95 |
| Aug | 19.75 | 12.59 |
| Sep | 28.48 | 20.3 |
| Oct | 22.54 | 24.78 |
| Nov | 20.34 | 14.54 |
| Dec | 20.21 | 18.05 |
Download these plotted values (CSV)
Permanent link to this figure’s text and data · Sources and context
Does the revision pattern hold across two full years?
All 24 crude oil months and all 24 gas months moved upward when the RRC published the following year's same-month report. Across the 2023 and 2024 production months, the typical increase was 22.22% for crude oil and 15.83% for natural gas. The two crude oil medians are close, but the range widened in 2024. Gas had a wider range in 2023. Retain those differences when describing an individual month.
| Production year and product | Months | Median monthly revision | Smallest to largest revision | Change in the sum |
|---|---|---|---|---|
| 2023 crude oil | 12 | +22.79% | +20.13% to +35.37% | +23.83% |
| 2024 crude oil | 12 | +21.52% | +18.79% to +41.52% | +23.34% |
| 2023–2024 crude oil | 24 | +22.22% | +18.79% to +41.52% | +23.58% |
| 2023 natural gas | 12 | +15.75% | +9.36% to +26.16% | +16.07% |
| 2024 natural gas | 12 | +16.87% | +12.59% to +24.78% | +17.36% |
| 2023–2024 natural gas | 24 | +15.83% | +9.36% to +26.16% | +16.72% |
| Product | Upward | At least 20% | At least 25% | Median first figure shortfall vs later |
|---|---|---|---|---|
| Crude oil | 24 of 24 | 22 of 24 | 4 of 24 | 18.18% |
| Natural gas | 24 of 24 | 6 of 24 | 1 of 24 | 13.66% |
The last column uses the later number as its denominator. For example, a first figure of 100 rising to 125 is an upward revision of 25%, and the first figure was 20% below 125. Choose the denominator that answers your question and name it in the citation. These counts describe observed releases and do not estimate the probability of any particular revision in a new report.
| Production year | Month-end to first release | Median | First release to follow-up | Median |
|---|---|---|---|---|
| 2023 | 61 to 80 days | 71 days | 348 to 377 days | 362 days |
| 2024 | 61 to 76 days | 66 days | 352 to 373 days | 364.5 days |
The rows compare the same stage in the publication cycle. Actual calendar lags vary. The second snapshot is a dated follow-up, and the statewide database can continue to change after that date.
For January 2023, the first crude total was 111,616,919 barrels and the follow-up was 137,802,952, an increase of 23.46%. Original Table 1. Follow-up Table 2.
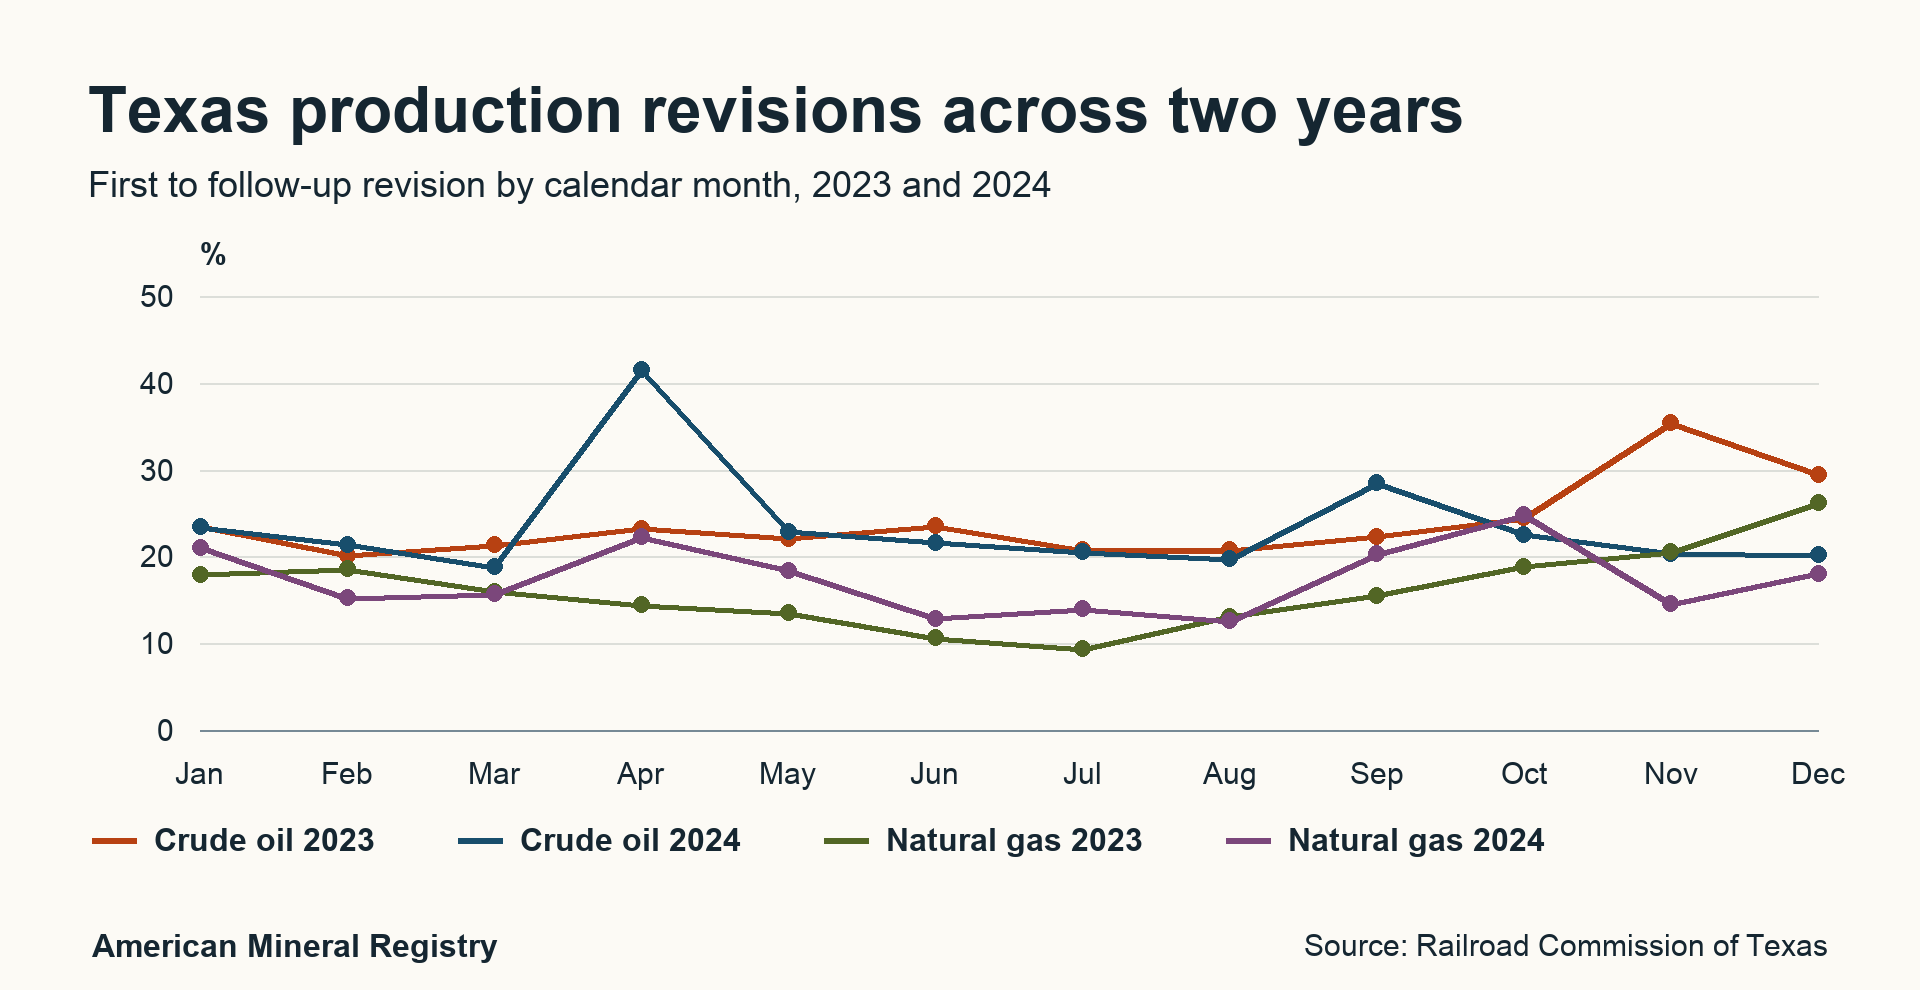
Figure 2 in text
Texas production revisions across two years. First to follow-up revision by calendar month, 2023 and 2024. Unit: %.
Change as a percentage of the first statewide report for each production month. RRC crude oil excludes condensate.
| Label | Crude oil 2023 | Crude oil 2024 | Natural gas 2023 | Natural gas 2024 |
|---|---|---|---|---|
| Jan | 23.46 | 23.41 | 17.93 | 21.04 |
| Feb | 20.13 | 21.41 | 18.6 | 15.23 |
| Mar | 21.35 | 18.79 | 15.97 | 15.69 |
| Apr | 23.23 | 41.52 | 14.43 | 22.25 |
| May | 22.08 | 22.87 | 13.51 | 18.4 |
| Jun | 23.53 | 21.64 | 10.65 | 12.85 |
| Jul | 20.76 | 20.56 | 9.36 | 13.95 |
| Aug | 20.77 | 19.75 | 13.09 | 12.59 |
| Sep | 22.35 | 28.48 | 15.53 | 20.3 |
| Oct | 24.45 | 22.54 | 18.85 | 24.78 |
| Nov | 35.37 | 20.34 | 20.55 | 14.54 |
| Dec | 29.46 | 20.21 | 26.16 | 18.05 |
Download these plotted values (CSV)
Permanent link to this figure’s text and data · Sources and context
Can mixed reporting ages reverse a full-year comparison?
Yes. Using updated volumes for both years, 2024 statewide crude oil volume was up 5.19% and natural gas was up 4.84% from 2023. Combining first 2024 figures with updated 2023 figures makes the same products look down 14.71% and 10.66%. The 12-month aggregation leaves the reporting-age mismatch in place.
| Comparison | Crude oil | Natural gas |
|---|---|---|
| First volumes for both years | +5.60% | +3.69% |
| First 2024 volume vs updated 2023 volume | -14.71% | -10.66% |
| Updated volumes for both years | +5.19% | +4.84% |
| Updated daily rates, 366 days vs 365 days | +4.90% | +4.56% |
| Product and unit | First 2023 | Updated 2023 | First 2024 | Updated 2024 |
|---|---|---|---|---|
| Crude oil (bbl) | 1,337,872,538 | 1,656,621,046 | 1,412,858,610 | 1,742,615,898 |
| Natural gas (Mcf) | 10,577,460,681 | 12,276,837,191 | 10,967,724,103 | 12,871,297,132 |
At the monthly level, swapping only the prior-year number changed the apparent direction in 11 of 12 crude comparisons and 8 of 12 gas comparisons. The updated annual totals sum the 12 dated snapshots for each year. They can differ from a single current statewide query. Daily rates also account for the extra production day in 2024.
The size of the revisions
Every 2024 production month had a higher reported statewide total in the later release, for both products. Crude oil revisions ranged from 18.8% to 41.5%. Natural gas revisions ranged from 12.6% to 24.8%. The oil revision was larger in 11 of 12 months.
April had the largest crude revision, from 112,811,542 to 159,653,729 barrels. The increase was 46,842,187 barrels, or 41.5% of the first figure. October had the largest gas revision, from 898,859,331 to 1,121,552,053 Mcf, up 24.8%. These are increases in the reported totals for the same production months. The releases do not identify which late or corrected submissions explain each increase. RRC April follow-up, Table 2. RRC October follow-up, Table 2.
Why one oil headline can show growth or decline
Take October 2025. The RRC initially reported 125,078,417 barrels of crude. The first October 2024 release had 122,145,230 barrels, so a first-to-first comparison was up 2.40%. The January 2026 release put the updated October 2024 total at 149,680,107 barrels. Using that denominator puts the same October 2025 number down 16.44%. RRC original October 2024 release. RRC October 2025 release, Tables 1 and 2.
Changing only the prior-year denominator flipped the sign in 12 of 12 oil months and 11 of 12 gas months in the 2025 comparisons. For gas, March was the exception. Both comparisons gave a decline. Each comparison describes the reported numbers available at particular dates. To assess production growth, compare figures at similar reporting ages, or use the latest available comparable values and disclose any difference in their maturity.
When reporting a fresh release, state the production month, release date, product scope and whether each number is preliminary or updated. Record the previous release if you plan to quantify a revision. A link to a rolling dashboard alone will not preserve the original comparison.
What changes when both years have follow-up figures?
January through June gives a complete six-month test with both first and later totals for both years. The updated 2024 figures come from the reports for those production months in 2025. The updated 2025 figures come from Table 2 of the corresponding 2026 reports. The 2025 follow-ups were published 364 to 369 days after the first reports. This compares similar reporting ages. Later figures remain dated snapshots.
Mixing the first 2025 totals with the updated 2024 totals makes first-half oil volume appear 15.46% lower and gas 6.81% lower. Using the updated volumes for both years puts oil 1.03% lower and gas 5.56% higher. That changes the gas headline from decline to growth and reduces the apparent oil decline.
| Reporting age | Crude oil | Natural gas |
|---|---|---|
| First totals for both years | +5.54% | +9.47% |
| First 2025 totals versus updated 2024 totals | -15.46% | -6.81% |
| Updated totals for both years | -1.03% | +5.56% |
| Updated daily averages for both years | -0.48% | +6.14% |
| Commodity and unit | First 2024 | Updated 2024 | First 2025 | Updated 2025 |
|---|---|---|---|---|
| Crude oil (bbl) | 691,097,560 | 862,817,262 | 729,411,361 | 853,970,141 |
| Natural gas (Mcf) | 5,345,200,402 | 6,279,387,729 | 5,851,505,799 | 6,628,517,688 |
Across the same six months, median first-to-updated revisions were 22.25% for 2024 oil and 16.66% for 2025 oil. For gas they were 17.04% and 11.71%. Even comparisons that match first reports can change once the revisions arrive. Six matched months provide a check on the method. The six-month figures do not measure full-year 2025 growth.
How month length and large revisions change the result
February 2024 had 29 calendar days and February 2025 had 28. The later oil figures were 133,504,532 and 130,465,949 barrels. That is 2.28% less volume, and 1.21% more oil per day. Use total volume for questions about how much was produced and daily average for questions about the production rate. The first half also had one fewer day in 2025.
March gas shows why even two first estimates can point the wrong way relative to the later releases. The first figures showed 1.41% lower volume. The updated comparison showed 4.36% higher volume. April oil shows the reverse pattern, from 8.07% higher using first figures to 10.10% lower using later ones.
| Month | Commodity | First vs. first | First 2025 vs. updated 2024 | Updated vs. updated | Updated daily rate | 2025 follow-up |
|---|---|---|---|---|---|---|
| January | Crude oil | +9.22% | -11.50% | +4.78% | +4.78% | Table 2 |
| January | Natural gas | +16.65% | -3.62% | +7.06% | +7.06% | Table 2 |
| February | Crude oil | +3.45% | -14.79% | -2.28% | +1.21% | Table 2 |
| February | Natural gas | +3.70% | -10.01% | +1.09% | +4.71% | Table 2 |
| March | Crude oil | +0.49% | -15.40% | +1.91% | +1.91% | Table 2 |
| March | Natural gas | -1.41% | -14.78% | +4.36% | +4.36% | Table 2 |
| April | Crude oil | +8.07% | -23.64% | -10.10% | -10.10% | Table 2 |
| April | Natural gas | +17.34% | -4.02% | +6.80% | +6.80% | Table 2 |
| May | Crude oil | +6.85% | -13.04% | +0.49% | +0.49% | Table 2 |
| May | Natural gas | +14.73% | -3.10% | +7.65% | +7.65% | Table 2 |
| June | Crude oil | +5.46% | -13.30% | +0.22% | +0.22% | Table 2 |
| June | Natural gas | +6.86% | -5.31% | +6.19% | +6.19% | Table 2 |
What the 12-month totals show
Adding the 12 first reports gives 1,412,858,610 barrels of crude oil, compared with 1,742,615,898 across the 12 follow-ups, a 23.3% increase. For gas, the summed figures rose from 10,967,724,103 to 12,871,297,132 Mcf, up 17.4%.
The monthly median gives every month equal weight. The change in the sum gives more weight to months with more preliminary production. Use the median to describe a typical month in this study and the change in the sum to describe the cumulative volume. The updated sum combines 12 dated follow-ups. A current statewide query may return a different total as records continue to change. RRC monthly production data.
April's 41.5% oil revision was the largest. Omitting April for a sensitivity check moves the oil median from 21.52% to 21.41% and the change in summed volumes from 23.34% to 21.76%. April stays in the published result. The check shows why the median is more stable than the total when one month changes unusually much.
How the Railroad Commission reports production
A production month is when the oil or gas was produced. A release date is when the RRC published a snapshot of the reports it had received. In this study, first releases appeared 61 to 76 days after month-end. The matched follow-up releases appeared 352 to 373 days after the first releases. Those are observed lags for this set of releases.
The agency says it updates preliminary volumes as late and corrected operator reports arrive. The crude series is oil from oil leases, in barrels. RRC reports condensate separately. The broader total-oil series in the RRC's production data includes both crude and condensate. Statewide natural gas totals include gas well gas and casinghead gas. One Mcf is one thousand cubic feet. Match those commodity definitions before comparing with another series. The tables report statewide totals and cannot resolve a specific lease, county or royalty check. RRC reporting notes. RRC monthly production definitions.
Which Texas or federal production series should you use?
Use a source suited to the question and record the production month, geographic coverage, product, unit and extraction or release date. The Railroad Commission says production is reported by lease. An oil lease total can include many wells. County rankings, lease reports and state totals describe different levels of aggregation.
| Question | Source | What to record |
|---|---|---|
| What did the first report say? | Dated RRC statewide news release, Table 1 | Production month, publication date, units and preliminary status |
| How much did that figure change? | Original Table 1 and next year's same-month Table 2 | Both publication dates and the check against the reprinted first figure |
| What total does the agency show today? | RRC statewide monthly data | Product series, extraction date and any preliminary note |
| Which county or lease produced it? | RRC county rankings or PDQ | County or lease ID, reporting period and product |
| What does EIA estimate? | EIA-914 methodology and the relevant federal data series | Exact federal series name, unit and release date |
RRC's crude oil press-release series excludes condensate. Its statewide monthly data separately identify crude, condensate and total oil, so use the total-oil line when you want crude plus condensate. EIA's definition of crude oil can include lease condensate. For gas, the RRC statewide figure includes gas well gas and casinghead gas. EIA separately publishes gross withdrawals, marketed production and dry production. Where a federal table uses million cubic feet, 1,000 Mcf equals one million cubic feet. Also check the product definition and reporting date. RRC statewide definitions. EIA crude oil glossary. EIA natural gas series.
The published EIA-914 methodology describes sampling operators in Texas and estimating statewide totals. The RRC press releases compile operator reports received for the state totals. A difference between an EIA estimate and an RRC preliminary count can reflect coverage, commodity scope and timing together. Use two dated RRC releases of the same series to measure an RRC revision. EIA-914 methodology.
The RRC's query FAQ says current data can reflect revised, corrected or delinquent operator reports and describes historical records as substantially complete after about six months. Its county ranking notes that significant preliminary changes can continue for about six to eight months and later corrections can still occur. Use the dated reports for what was public then and the current statewide tables for the latest aggregate. RRC Production Data Query FAQ. RRC county ranking notes.
This study measures the net change between two dated snapshots. To measure what changed by the sixth month, save a dated statewide extract at that point and compare it with an earlier extract of the same series.
How to compare a new release before writing a headline
- Record the month produced and publication date for both figures. Preserve the dated release and identify its statewide table, commodity and unit.
- Decide what you are reporting. Compare a first figure with the original first figure from the same month a year earlier for a like-stage comparison. Use both updated figures when comparable follow-ups exist. In a mixed-age comparison, explicitly name the newer preliminary number and older updated number.
- For a rate, divide each volume by the calendar days it covers before computing the change. For a half-year or annual total, add the volumes before comparing them. Averaging monthly growth percentages gives each month equal weight and answers a different question.
- If the sign changes between defensible comparisons, report which stage produced which result. Link both inputs and identify the next follow-up that would let readers check again.
Methodology and how to reproduce the figures
- For each month from January to December 2023 and 2024, copy the preliminary statewide crude oil and natural gas totals from Table 1 of that month's original RRC release.
- Open the release for the same production month of 2024 or 2025, respectively. In Table 2, copy the updated totals and check the reprinted preliminary values against the originals. All 48 reprinted values matched.
- Subtract the first value from the updated value, divide by the first value and multiply by 100. For an even set of 12 months, average the sixth and seventh percentages after sorting to obtain the median. For the combined 24 months, average the twelfth and thirteenth percentages. Round after calculation.
- For the year-over-year examples, keep the 2025 preliminary figure in Table 1 fixed. Compute percentage changes using the first and updated 2024 figures separately as denominators.
- For the six-month extension, take January through June 2025 updated volumes from Table 2 of the six 2026 releases. Reconcile their reprinted first figures with 2025 Table 1. Compare first with first, first 2025 with updated 2024, and updated with updated. For the daily averages, divide each total by its own calendar days before comparing.
Worked example. October 2024 oil rose by 27,534,877 barrels. Divide that change by 122,145,230 and multiply by 100 to get 22.54%. The CSV has the exact inputs, release dates, source links and calculations for every row.
These are descriptive statistics for two full production years and two release snapshots per month, plus a separate first-half 2025 comparison. They describe the published revisions observed in this sample. Future reports and other geographies need their own comparisons. Later reported totals can still change.
First and updated Texas production volumes by month
| Production month | First oil (bbl) | Updated oil (bbl) | Oil revision | First gas (Mcf) | Updated gas (Mcf) | Gas revision |
|---|---|---|---|---|---|---|
| January 2023 | 111,616,919 | 137,802,952 | +23.46% | 845,190,651 | 996,694,297 | +17.93% |
| February 2023 | 102,867,009 | 123,573,098 | +20.13% | 760,548,931 | 901,998,102 | +18.60% |
| March 2023 | 115,344,551 | 139,965,600 | +21.35% | 896,198,533 | 1,039,300,198 | +15.97% |
| April 2023 | 108,989,942 | 134,304,924 | +23.23% | 876,531,275 | 1,002,983,877 | +14.43% |
| May 2023 | 113,851,974 | 138,990,538 | +22.08% | 917,272,001 | 1,041,241,051 | +13.51% |
| June 2023 | 109,053,025 | 134,709,407 | +23.53% | 904,389,540 | 1,000,712,997 | +10.65% |
| July 2023 | 117,769,397 | 142,219,234 | +20.76% | 954,647,301 | 1,043,987,233 | +9.36% |
| August 2023 | 117,783,828 | 142,244,583 | +20.77% | 930,548,995 | 1,052,393,888 | +13.09% |
| September 2023 | 111,887,873 | 136,895,681 | +22.35% | 890,886,382 | 1,029,279,576 | +15.53% |
| October 2023 | 114,547,597 | 142,554,792 | +24.45% | 893,803,295 | 1,062,326,913 | +18.85% |
| November 2023 | 103,432,924 | 140,016,636 | +35.37% | 859,711,071 | 1,036,406,434 | +20.55% |
| December 2023 | 110,727,499 | 143,343,601 | +29.46% | 847,732,706 | 1,069,512,625 | +26.16% |
| January 2024 | 111,122,407 | 137,140,265 | +23.41% | 857,816,970 | 1,038,267,710 | +21.04% |
| February 2024 | 109,964,867 | 133,504,532 | +21.41% | 869,159,709 | 1,001,547,553 | +15.23% |
| March 2024 | 120,766,747 | 143,460,647 | +18.79% | 931,558,354 | 1,077,682,226 | +15.69% |
| April 2024 | 112,811,542 | 159,653,729 | +41.52% | 846,267,158 | 1,034,587,471 | +22.25% |
| May 2024 | 119,144,564 | 146,390,317 | +22.87% | 907,474,673 | 1,074,483,869 | +18.40% |
| June 2024 | 117,287,433 | 142,667,772 | +21.64% | 932,923,538 | 1,052,818,900 | +12.85% |
| July 2024 | 121,314,280 | 146,256,609 | +20.56% | 953,623,122 | 1,086,634,782 | +13.95% |
| August 2024 | 123,916,622 | 148,390,542 | +19.75% | 981,131,829 | 1,104,615,595 | +12.59% |
| September 2024 | 112,553,191 | 144,612,280 | +28.48% | 890,775,106 | 1,071,567,286 | +20.30% |
| October 2024 | 122,145,230 | 149,680,107 | +22.54% | 898,859,331 | 1,121,552,053 | +24.78% |
| November 2024 | 119,466,796 | 143,764,045 | +20.34% | 945,100,698 | 1,082,479,452 | +14.54% |
| December 2024 | 122,364,931 | 147,095,053 | +20.21% | 953,033,615 | 1,125,060,235 | +18.05% |
Common questions
How much are Texas oil and gas production figures revised?
Across all 24 production months of 2023 and 2024, the Railroad Commission of Texas revised its first statewide crude oil totals upward by a median of 22.2% and its natural gas totals by 15.8% in the following year's same-month releases. Both commodities were revised upward in every month.
Why does Texas revise oil and gas production data?
The Railroad Commission publishes a preliminary total from operator reports, then updates it when late or corrected reports are received. Its monthly releases show the first figure and a later figure for the same month of the previous year.
Is the revised Texas production number final?
The study uses a dated follow-up figure. Subsequent late and corrected reports can change the state's running total. Cite the date of the release or extract used.
Where can I find the current Texas production figures or an older release?
Use the Railroad Commission's monthly statewide data for current statewide totals. Use dated news releases for figures as first published. Use the Production Data Query for records by lease, field, operator, district or county.
How much did statewide Texas production rise in 2024?
Using the updated figures from the following year's same-month releases, statewide crude oil was up 5.19% and natural gas up 4.84% from 2023. The summed volumes use comparable reporting stages.
Does Texas crude oil production include condensate in this study?
The crude oil column uses the Railroad Commission's volume for oil from oil leases. The agency reports condensate separately.
Can I use the statewide median to estimate a county or a royalty check?
Use the study to understand uncertainty in a first statewide release. A county estimate or royalty reconciliation requires its own geographic or property records, reporting dates and commodity definitions.
How should I compare a new preliminary number to last year?
State which release produced each number. Compare similar reporting ages when possible. If using an updated prior-year figure, label it so readers know the two months differ in reporting maturity.
How much did first-half Texas oil and gas production change in 2025?
In the matched later releases, statewide January through June 2025 crude oil volume was 1.03% lower and natural gas volume was 5.56% higher than in the first half of 2024. Dividing by calendar days puts the rate changes at -0.48% for oil and +6.14% for gas. These are dated estimates.
Sources and downloads
- Download the complete 2024 cohort (CSV)
- Download the first-half vintage comparison (CSV) Twelve commodity-month rows with all four values, the three release dates and URLs, and volume and daily-rate comparisons.
- Download the complete 2023 cohort (CSV) Twenty-four commodity-month rows with each first figure, updated figure, reprint check, direct source links and change calculations.
- Download chart (PNG)
- RRC news archive for 2023 · Original January through September 2023 production releases, Table 1.
- RRC news archive for 2024 · First releases for October through December 2023 and January through September 2024, plus 2023 follow-up figures.
- RRC news archive for 2025 · First reports for October through December 2024 production and follow-ups for January through September 2024 production.
- RRC news archive for 2026 · Follow-ups for October through December 2024 and January through June 2025 production.
- RRC October 2024 production release · January 13, 2025. Table 1 contains the first October 2024 volume used in the example.
- RRC October 2025 production release · January 21, 2026. Table 1 gives the 2025 figure. Table 2 records both October 2024 figures.
- RRC statewide monthly production data · Current statewide production totals. Use dated news releases to recover the original figures.
- RRC Production Data Query FAQ · Lease reporting, revisions, timing, aggregation and available query scopes.
- RRC monthly county rankings · Product definitions, preliminary timing and later corrections.
- EIA crude oil definitions · Crude oil and crude oil excluding lease condensate are distinct federal definitions.
- EIA natural gas gross withdrawals and production · Distinguishes gross withdrawals, marketed production and dry production.
- EIA-914 production survey methodology · Explains how EIA samples Texas operators and produces statewide estimates.
- RRC January 2026 production release · Published 2026-04-01. Table 2 gives the corresponding 2025 first and updated volumes.
- RRC February 2026 production release · Published 2026-05-04. Table 2 gives the corresponding 2025 first and updated volumes.
- RRC March 2026 production release · Published 2026-06-02. Table 2 gives the corresponding 2025 first and updated volumes.
- RRC April 2026 production release · Published 2026-07-06. Table 2 gives the corresponding 2025 first and updated volumes.
- RRC May 2026 production release · Published 2026-08-05. Table 2 gives the corresponding 2025 first and updated volumes.
- RRC June 2026 production release · Published 2026-09-03. Table 2 gives the corresponding 2025 first and updated volumes.
Attribute AMR’s analysis and chart to American Mineral Registry. Reuse the analysis and chart under CC BY 4.0. Original source materials retain the issuers’ own terms.