Across EIA’s 13 January outlooks for 2013 through 2025, the median absolute error in its same-year annual price forecast was $4.92 per barrel for WTI, $5.17 per barrel for Brent and $0.47 per million Btu for Henry Hub natural gas. EIA’s forecast was closer than carrying forward the prior year’s price in 10 of 13 years for both oil benchmarks and eight of 13 for gas.
The January results use 39 benchmark-year comparisons. Two additional analyses compare January, July and October releases for the same annual price and test forecasts made a calendar year earlier.
Key findings
- $4.92 / bbl · WTI median absolute error
10 of 13 January forecasts beat the prior-year price baseline. - $5.17 / bbl · Brent median absolute error
10 of 13 January forecasts beat the prior-year price baseline. - $0.47 / MMBtu · Henry Hub median absolute error
8 of 13 January forecasts beat the prior-year price baseline.
January price forecast error by year
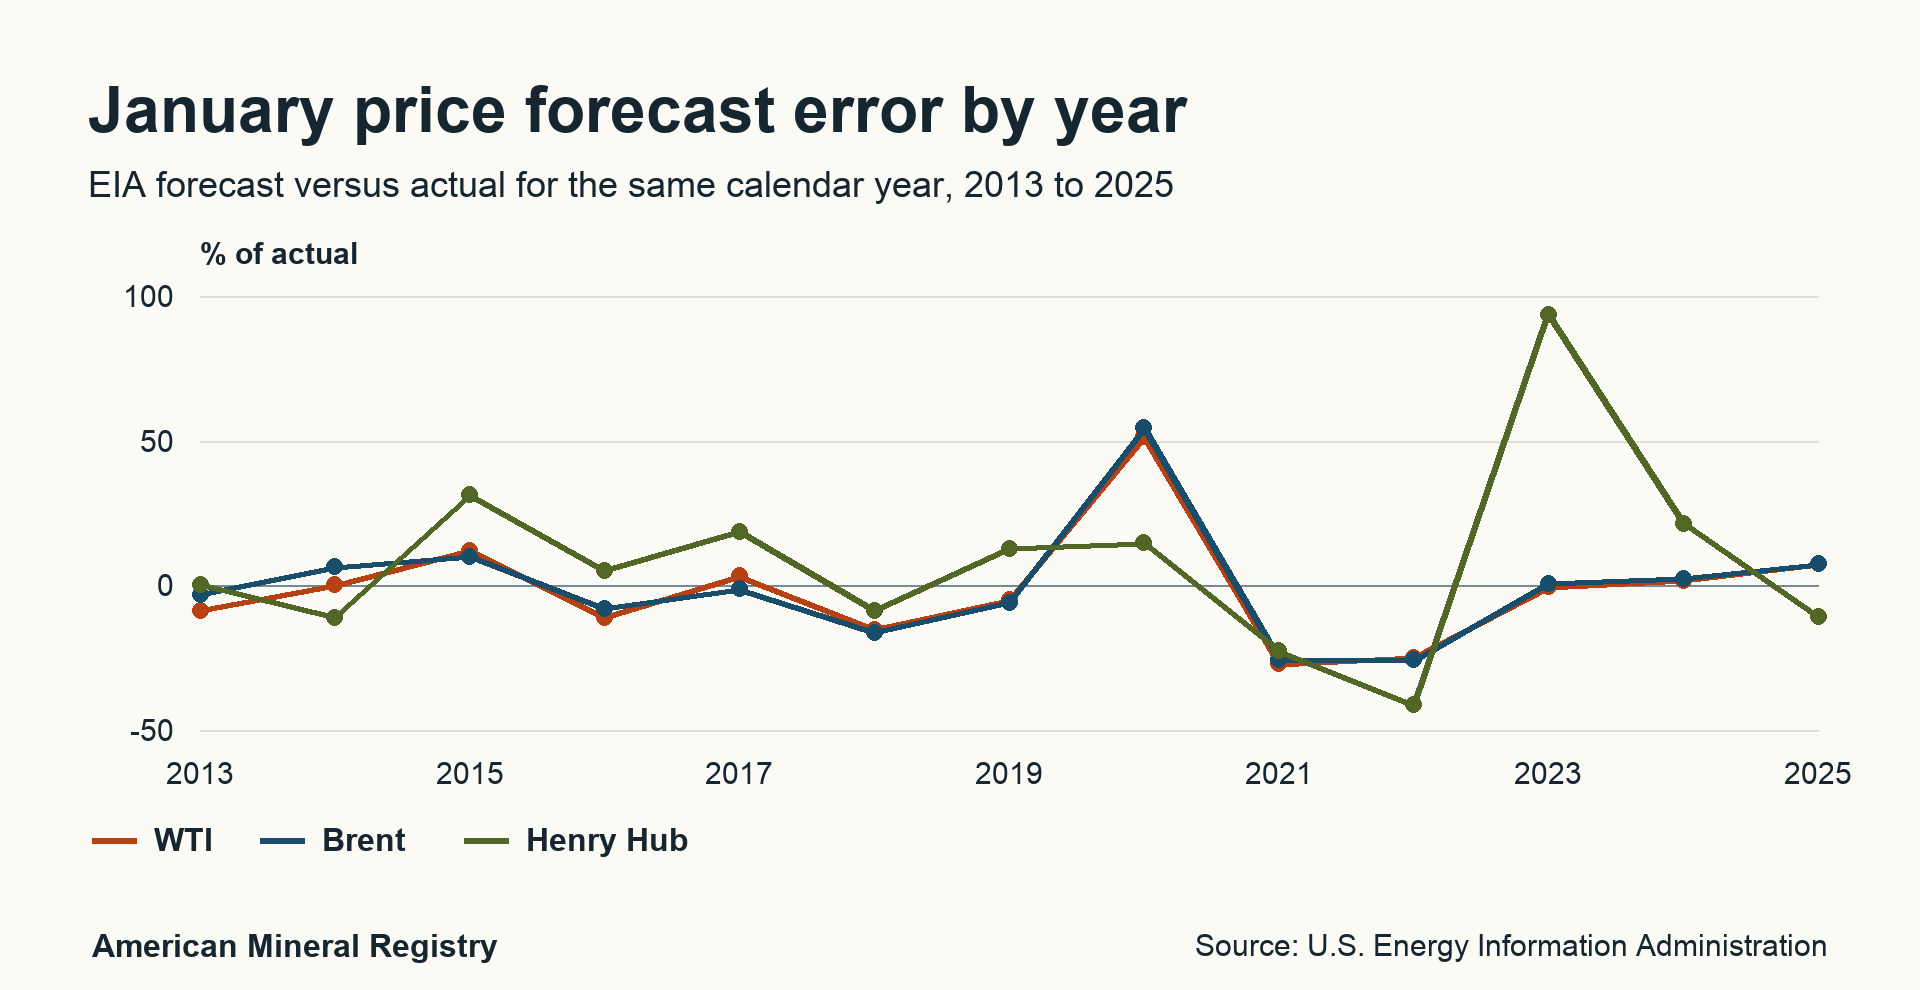
Figure 1 in text
January price forecast error by year. EIA forecast versus actual for the same calendar year, 2013 to 2025. Unit: % of actual.
Above zero means EIA forecast a higher price than the actual. Each series is expressed as a percentage of its own annual actual so the three benchmarks can share one axis.
| Label | WTI | Brent | Henry Hub |
|---|---|---|---|
| 2013 | -8.6 | -3.1 | 0.3 |
| 2014 | 0.2 | 6.5 | -11.0 |
| 2015 | 12.2 | 10.1 | 31.3 |
| 2016 | -11.0 | -8.0 | 5.2 |
| 2017 | 3.3 | -1.2 | 18.7 |
| 2018 | -15.2 | -16.3 | -8.6 |
| 2019 | -4.9 | -5.9 | 12.9 |
| 2020 | 51.3 | 54.5 | 14.8 |
| 2021 | -27.1 | -25.6 | -22.6 |
| 2022 | -24.8 | -25.7 | -41.2 |
| 2023 | -0.5 | 0.7 | 93.7 |
| 2024 | 1.8 | 2.4 | 21.5 |
| 2025 | 7.5 | 7.5 | -10.8 |
Download these plotted values (CSV)
Permanent link to this figure’s text and data · Sources and context
What the EIA outlook measures
The Short-Term Energy Outlook is EIA’s monthly forecast for energy markets. This study uses its benchmark spot price estimates. WTI and Brent are crude oil references measured in dollars per barrel. Henry Hub is a natural gas reference measured in dollars per million Btu. The annual figures cover the full calendar year in the column heading.
Read the table horizontally. The January issue can show quarterly data, an estimate for the prior year and forecasts for two annual periods. The Energy Prices table in the January 2025 issue uses gray shading for estimates and forecasts and gives source notes below the rows. Later issues combine more of the year’s observed prices with estimates for the rest. A named benchmark, issue month and target year make a quote auditable. For a household spending forecast with a separately identified workbook vintage, use the winter household costs reference.
How much did the forecasts miss by?
Absolute error measures distance from the eventual annual average. A one-dollar overshoot and a one-dollar undershoot count the same toward typical error. The median is the middle of the 13 errors after sorting. The mean gives the largest misses more influence.
| Benchmark and unit | Median error | Mean error | Smallest miss | Largest miss | Years high | Years low |
|---|---|---|---|---|---|---|
| WTI ($/bbl) | $4.92 | $7.88 | $0.16 | $23.58 | 6 | 7 |
| Brent ($/bbl) | $5.17 | $8.41 | $0.61 | $25.98 | 6 | 7 |
| Henry Hub ($/MMBtu) | $0.47 | $0.74 | $0.01 | $2.66 | 8 | 5 |
The January outlook was below actual in seven of 13 years for each oil benchmark and five of 13 for Henry Hub. All three benchmarks had their largest dollar or dollar-per-MMBtu miss in 2022. Each was an underestimate. January WTI came in at $71.32 per barrel against $94.90 actual. Brent was $74.95 against $100.93. Henry Hub was $3.79 per MMBtu against $6.45.
Did EIA beat last year’s price?
A reader could have assumed that the previous calendar year’s average would repeat. We take that price from the same January edition, using only information the edition reported at the time. Then we compare both forecasts with the same eventual annual actual.
| Benchmark | EIA median | Prior-year median | EIA mean | Prior-year mean | EIA closer | EIA got direction right |
|---|---|---|---|---|---|---|
| WTI | $4.92 | $11.21 | $7.88 | $14.74 | 10 of 13 | 10 of 13 |
| Brent | $5.17 | $11.42 | $8.41 | $16.61 | 10 of 13 | 11 of 13 |
| Henry Hub | $0.47 | $0.64 | $0.74 | $1.17 | 8 of 13 | 9 of 13 |
For example, the January 2022 outlook used a 2021 WTI average of $68.21 per barrel and forecast $71.32 for 2022. The actual $94.90 was $23.58 above EIA’s forecast and $26.69 above the prior-year baseline. EIA improved on the simple forecast by $3.11 while both forecasts materially understated the actual. Direction means both the forecast and the actual moved the same way from the same prior-year price.
In 2015 the baseline would have carried forward $93.26 per barrel for WTI. The January forecast was $54.58 and the annual actual was $48.66. EIA’s miss was $5.92, compared with $44.60 for the baseline. That $38.68 improvement shows why the size of a win matters as well as the number of winning years.
The table measures three different things. The win count shows frequency. The mean shows the cost of large misses in price units. The direction count answers whether EIA got the sign of the year-over-year change right. A win can coexist with a large miss, and good direction can coexist with a poor estimate of the size.
How often were the forecasts close?
Compare benchmarks on the same percentage scale by dividing each miss by that year’s actual. For each forecast, the threshold counts check whether the absolute error was at most 10% or 20% of actual. These thresholds are descriptive cutoffs chosen for this study.
| Benchmark | Median absolute % error | Within 10% | Within 20% | Largest % miss and year |
|---|---|---|---|---|
| WTI | 8.6% | 7 of 13 | 10 of 13 | 51.3% (2020) |
| Brent | 7.5% | 8 of 13 | 10 of 13 | 54.5% (2020) |
| Henry Hub | 14.8% | 3 of 13 | 8 of 13 | 93.7% (2023) |
Brent was within 10% in eight of 13 years, WTI in seven and Henry Hub in three. Henry Hub’s typical error in percentage terms was larger than either crude benchmark’s. For a cross-commodity comparison, use the percentages. For a story about a specific benchmark, give the price-unit error alongside the reference price and the sample dates.
How much does the choice of years matter?
The study shows the 2013 through 2025 result and the original 2018 through 2025 window side by side. The earlier five years add a view of the period before the largest oil misses. Each column uses the same forecast definition and the same absolute-error formula.
| Benchmark | 2013 to 2017 (5 years) | 2018 to 2025 (8 years) | 2013 to 2025 (13 years) | Range if any one year is omitted |
|---|---|---|---|---|
| WTI | $4.75 | $7.41 | $4.92 | $4.84 to $5.42 |
| Brent | $3.49 | $8.39 | $5.17 | $4.48 to $5.22 |
| Henry Hub | $0.48 | $0.43 | $0.47 | $0.43 to $0.48 |
For WTI, the typical miss was $4.75 per barrel in the earlier window and $7.41 in the later one. For Brent it was $3.49 and $8.39. Henry Hub was $0.48 and $0.43 per MMBtu. The last column recomputes the full-window median 13 times, leaving out one year at a time. That is a check on how sensitive the descriptive figure is to any one observation. Both time windows are small, and the difference between them does not establish a trend.
How does accuracy change through the year?
We scored January, July and October estimates for the same calendar year against the same eventual annual spot price, for all 13 years and three benchmarks. October had the smallest median error for all three. It was closer than January in 11 of 13 years for each oil benchmark and 12 of 13 for gas.
| Benchmark | January median error | July median error | October median error | October closer than January | October closer than July | October–July ties |
|---|---|---|---|---|---|---|
| WTI | $4.92 | $2.59 | $0.73 | 11 of 13 | 10 of 13 | 0 |
| Brent | $5.17 | $3.12 | $0.93 | 11 of 13 | 10 of 13 | 0 |
| Henry Hub | $0.47 | $0.16 | $0.08 | 12 of 13 | 11 of 13 | 2 |
The oil figures are dollars per barrel and Henry Hub is dollars per MMBtu. Later outlooks have more of the year in view. They estimate the same annual average with more observed months available, which makes this a comparison of release timing and information available at the time. It does not test performance at equal lead times.
Later figures can move farther from the actual. In 2023, the Brent forecast was $83.10 in January, $79.34 in July and $84.09 in October, against $82.49 actual. January was closest that year. In 2025, Brent’s July error was $0.25 per barrel and October’s was $0.50. Quote the release month so readers can see which estimate was used.
The July and October data come from the current-year annual column of Table 2 in each original outlook. The comparison CSV includes all 117 values, source pages, actuals and calculation fields, including the January rows used as the starting point.
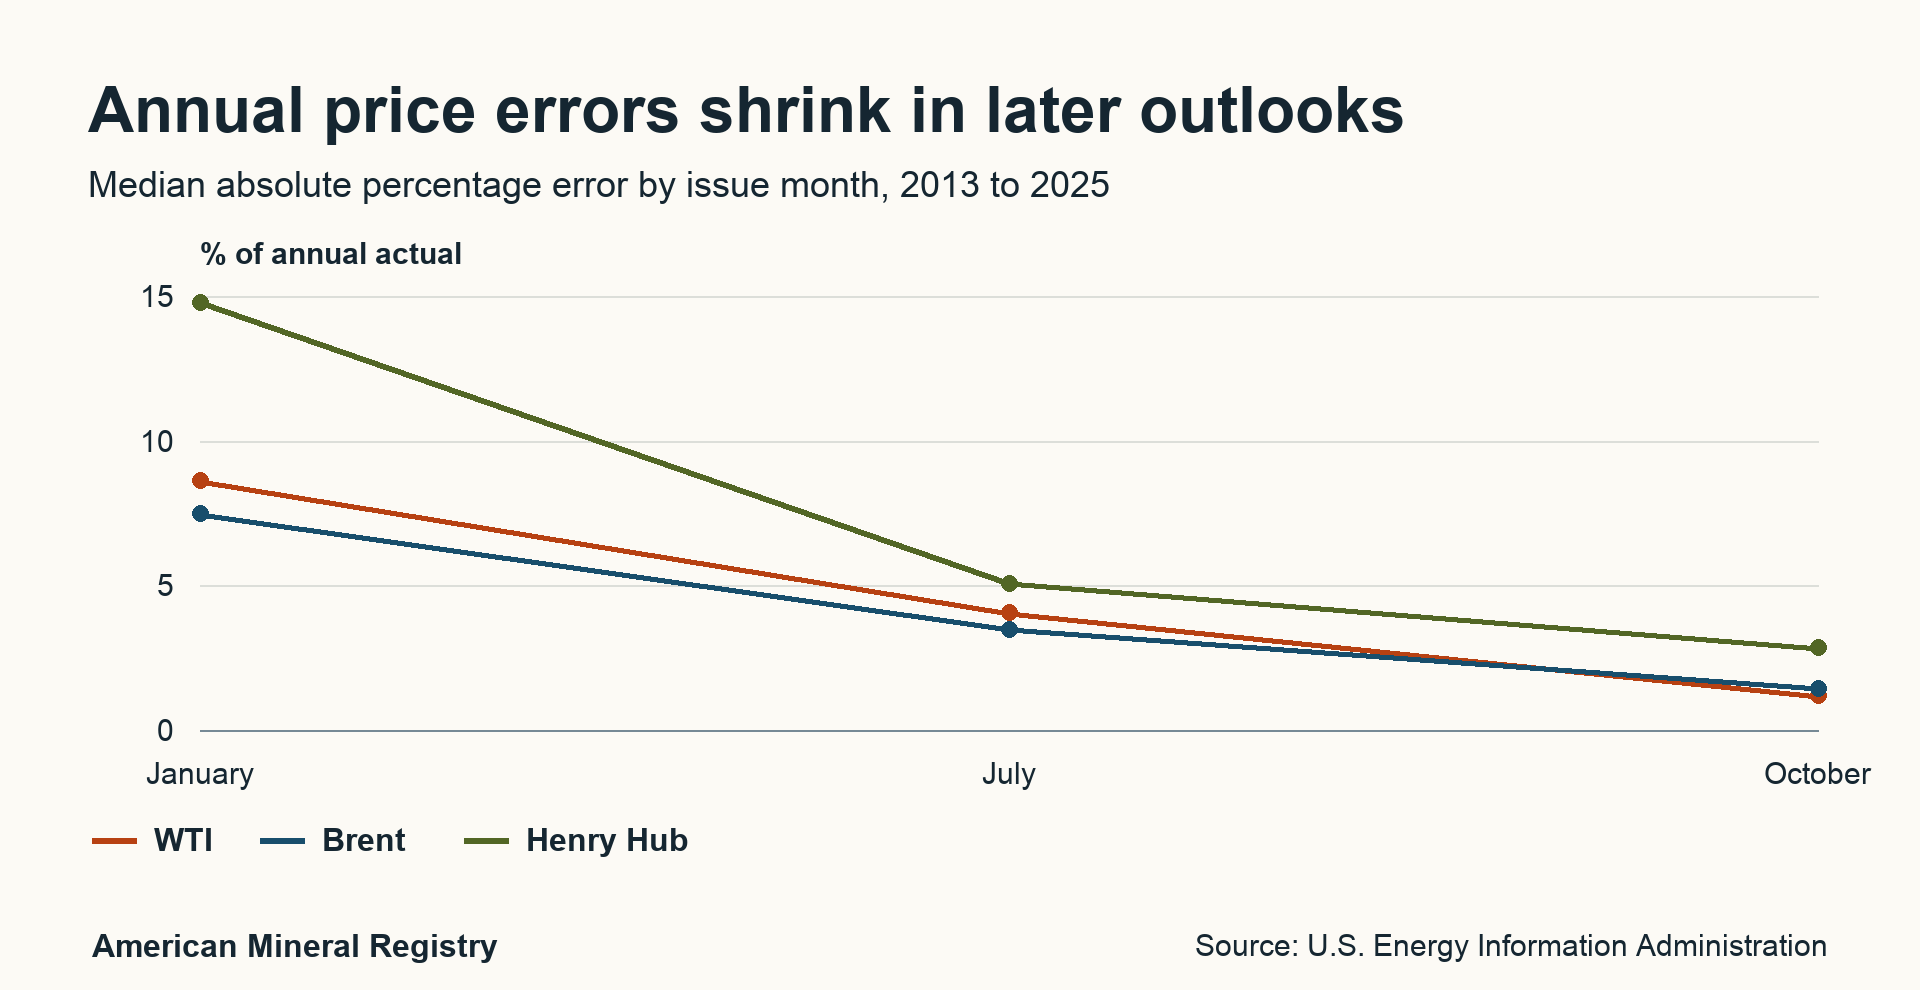
Figure 2 in text
Annual price errors shrink in later outlooks. Median absolute percentage error by issue month, 2013 to 2025. Unit: % of annual actual.
Each point is the median across 13 same-year estimates. Later issues have more observed months. See the price-unit table for errors in dollars per barrel and dollars per MMBtu.
| Label | WTI | Brent | Henry Hub |
|---|---|---|---|
| January | 8.61 | 7.48 | 14.78 |
| July | 4.06 | 3.48 | 5.08 |
| October | 1.18 | 1.45 | 2.84 |
Download these plotted values (CSV)
Permanent link to this figure’s text and data · Sources and context
How accurate is the forecast for the following year?
The January outlook can contain annual estimates for two different calendar years. We compared forecasts for the same target year issued in two successive January editions. For each benchmark, the forecast issued in January of the target year had a smaller median error than the forecast issued the previous January.
| Benchmark | Previous January median error | Same-year January median error | Same-year January closer |
|---|---|---|---|
| WTI | $9.82 | $4.84 | 10 of 12 |
| Brent | $12.67 | $5.22 | 8 of 12 |
| Henry Hub | $1.00 | $0.48 | 9 of 12 |
The matched sample covers 12 target years, 2014 through 2025. Errors are in dollars per barrel for crude oil and dollars per MMBtu for gas. The smaller sample is intentional. Each target year needs both forecast vintages and the same eventual actual, so the same-year medians here differ slightly from the 13-year headline figures.
Take 2022 WTI. The January 2021 outlook put 2022 at $49.81 per barrel. The January 2022 outlook raised that estimate to $71.32. The annual average was $94.90, leaving errors of $45.09 and $23.58 per barrel respectively. Both estimates covered the same calendar year. The year in a report's title and the year over the data column each matter.
What the biggest errors show
The January 2020 forecast was above the eventual annual average by $20.09 per barrel for WTI and $22.87 for Brent. In 2021 it missed in the other direction by $18.43 for WTI and $18.16 for Brent. In 2022 the errors grew to $23.58 and $25.98 below actual. That sequence is a reminder that a single typical-error figure leaves out extreme years and that a miss can reverse direction between January editions.
Natural gas followed a different pattern. The 2022 forecast was $2.66 per MMBtu low, then the 2023 forecast was $2.37 high. The 2022 miss was the larger dollar amount. In percentage terms, the 2023 miss was larger because the actual was $2.53 per MMBtu, compared with $6.45 in 2022. The largest percentage oil misses were in 2020, while the largest dollar misses were in 2022.
In its January 2021 retrospective, EIA described how pandemic-related changes in activity reduced demand and affected 2020 oil prices. EIA’s 2022 crude oil review points to supply concerns and lower inventories around Russia’s February invasion of Ukraine. Its 2022 gas review describes production disruptions, storage withdrawals and export demand. These reports explain market conditions over the year. The forecast score does not allocate the error among those events.
How to track a year before the actual is known
Two outlooks for the same year let you measure a forecast revision. The eventual annual actual lets you measure a forecast error. In November 2026, EIA’s estimate of full-year WTI was $36.08 per barrel higher than in January. That compares two published estimates of 2026 and says nothing yet about the size of the error.
| Benchmark | January 2026 outlook for 2026 | November 2026 outlook for 2026 | Change |
|---|---|---|---|
| WTI | $52.21/bbl | $88.29/bbl | +$36.08/bbl |
| Brent | $55.87/bbl | $97.44/bbl | +$41.57/bbl |
| Henry Hub | $3.46/MMBtu | $3.37/MMBtu | −$0.09/MMBtu |
Source columns are Table 2 in the January 2026 outlook and the November 2026 outlook. The scored panel ends in 2025. To extend it, wait for all three full calendar-year spot averages, record the date of the actual-price data, and score the archived outlooks against that common actual.
How to read a new January forecast
- Find the full-year forecast column for the calendar year you are discussing. January outlooks can also show a second forecast year, quarterly prices and the prior-year estimate.
- Match the benchmark to the claim. WTI is the Cushing crude oil benchmark, Brent is the Europe Brent crude oil benchmark, and Henry Hub is the natural gas spot benchmark. Crude oil prices here are in dollars per barrel and natural gas is in dollars per million Btu.
- For a year-ahead story, give the published forecast and the historical median error with the 13-year scope. Use a specific past miss to illustrate uncertainty, without treating the median or observed extremes as a forecast interval.
- For royalty context, check the payment statement’s own pricing basis, production volume, ownership decimal and any applicable adjustments. A national benchmark is a market reference. Realized pricing and royalty payments can differ.
The EIA release calendar lists the upcoming editions. This historical comparison can be updated after a complete calendar year has official actuals for all three benchmarks.
Which price and error should you cite?
| If you are writing about | Use | Record alongside it |
|---|---|---|
| What EIA expected at the start of the year | The January full-year forecast | Issue month, target calendar year, benchmark, unit and table |
| What the agency expects now | The latest comparable issue | Its release date and how much of the year has already passed |
| Whether forecasts tend to be close | Median absolute error in the matching units | Benchmark, sample dates and number of observations |
| How often the estimate is within a given distance | The observed 10% or 20% counts | The threshold and actual-price denominator, with no probability claim |
| What happened to one owner’s royalty price | The actual sales and payment records | Realized pricing, applicable contract terms, volume and ownership decimal |
For example, assume a payment statement covers 1,000 barrels and a 0.01 royalty decimal. A $5 change in the realized price changes the gross royalty calculation by $50 if those inputs stay fixed, before any applicable adjustments. A $5 move in benchmark WTI does not establish a $5 change in that realized price. Use the actual statement for the calculation.
Methodology and how to reproduce it
- Open the original January PDF for each year, 2013 through 2025. Read the same-year annual WTI and Brent values in Table 2. Henry Hub is from Table 2 in 2013 through 2017 and Table 1 in 2018 through 2025. Read the preceding annual column for the baseline. The CSV supplies the PDF page and table number for every observation.
- Read the corresponding annual spot-price series from EIA for the eventual actual. The study uses annual reported prices in nominal dollars, recorded November 11, 2026. The actual series can receive revisions. The archived January forecast remains fixed.
- Compute signed error as January forecast minus actual. For the chart, divide that difference by actual and multiply by 100. Take the absolute value of the dollar error for the median and mean tables. Compare the absolute error with the prior-year baseline using the same actual. The CSV’s improvement field subtracts the EIA absolute error from the baseline absolute error. Positive improvement means EIA was closer. A tie would count separately. There were no ties in this panel.
Thirteen observations per benchmark give descriptive results for the years shown. The analysis does not assign causes to specific misses, score other release months, estimate the accuracy of next-year projections or establish a confidence interval. Each commodity keeps its own units.
Every January forecast and actual price
| Year | Benchmark | Unit | Prior-year price | January forecast | Actual | Forecast miss | Error % of actual | Prior-year absolute error |
|---|---|---|---|---|---|---|---|---|
| 2013 | WTI | USD/bbl | $94.12 | $89.54 | $97.98 | $8.44 low | -8.6% | $3.86 |
| 2013 | Brent | USD/bbl | $111.65 | $105.17 | $108.56 | $3.39 low | -3.1% | $3.09 |
| 2013 | Henry Hub | USD/MMBtu | $2.75 | $3.74 | $3.73 | $0.01 high | 0.3% | $0.98 |
| 2014 | WTI | USD/bbl | $97.91 | $93.33 | $93.17 | $0.16 high | 0.2% | $4.74 |
| 2014 | Brent | USD/bbl | $108.64 | $105.42 | $98.97 | $6.45 high | 6.5% | $9.67 |
| 2014 | Henry Hub | USD/MMBtu | $3.73 | $3.89 | $4.37 | $0.48 low | -11.0% | $0.64 |
| 2015 | WTI | USD/bbl | $93.26 | $54.58 | $48.66 | $5.92 high | 12.2% | $44.60 |
| 2015 | Brent | USD/bbl | $99.02 | $57.58 | $52.32 | $5.26 high | 10.1% | $46.70 |
| 2015 | Henry Hub | USD/MMBtu | $4.39 | $3.44 | $2.62 | $0.82 high | 31.3% | $1.77 |
| 2016 | WTI | USD/bbl | $48.67 | $38.54 | $43.29 | $4.75 low | -11.0% | $5.38 |
| 2016 | Brent | USD/bbl | $52.32 | $40.15 | $43.64 | $3.49 low | -8.0% | $8.68 |
| 2016 | Henry Hub | USD/MMBtu | $2.63 | $2.65 | $2.52 | $0.13 high | 5.2% | $0.11 |
| 2017 | WTI | USD/bbl | $43.33 | $52.50 | $50.80 | $1.70 high | 3.3% | $7.47 |
| 2017 | Brent | USD/bbl | $43.74 | $53.50 | $54.13 | $0.63 low | -1.2% | $10.39 |
| 2017 | Henry Hub | USD/MMBtu | $2.51 | $3.55 | $2.99 | $0.56 high | 18.7% | $0.48 |
| 2018 | WTI | USD/bbl | $50.79 | $55.33 | $65.23 | $9.90 low | -15.2% | $14.44 |
| 2018 | Brent | USD/bbl | $54.15 | $59.74 | $71.34 | $11.60 low | -16.3% | $17.19 |
| 2018 | Henry Hub | USD/MMBtu | $2.99 | $2.88 | $3.15 | $0.27 low | -8.6% | $0.16 |
| 2019 | WTI | USD/bbl | $65.06 | $54.19 | $56.99 | $2.80 low | -4.9% | $8.07 |
| 2019 | Brent | USD/bbl | $71.19 | $60.52 | $64.30 | $3.78 low | -5.9% | $6.89 |
| 2019 | Henry Hub | USD/MMBtu | $3.15 | $2.89 | $2.56 | $0.33 high | 12.9% | $0.59 |
| 2020 | WTI | USD/bbl | $57.02 | $59.25 | $39.16 | $20.09 high | 51.3% | $17.86 |
| 2020 | Brent | USD/bbl | $64.36 | $64.83 | $41.96 | $22.87 high | 54.5% | $22.40 |
| 2020 | Henry Hub | USD/MMBtu | $2.57 | $2.33 | $2.03 | $0.30 high | 14.8% | $0.54 |
| 2021 | WTI | USD/bbl | $39.17 | $49.70 | $68.13 | $18.43 low | -27.1% | $28.96 |
| 2021 | Brent | USD/bbl | $41.69 | $52.70 | $70.86 | $18.16 low | -25.6% | $29.17 |
| 2021 | Henry Hub | USD/MMBtu | $2.03 | $3.01 | $3.89 | $0.88 low | -22.6% | $1.86 |
| 2022 | WTI | USD/bbl | $68.21 | $71.32 | $94.90 | $23.58 low | -24.8% | $26.69 |
| 2022 | Brent | USD/bbl | $70.89 | $74.95 | $100.93 | $25.98 low | -25.7% | $30.04 |
| 2022 | Henry Hub | USD/MMBtu | $3.91 | $3.79 | $6.45 | $2.66 low | -41.2% | $2.54 |
| 2023 | WTI | USD/bbl | $94.91 | $77.18 | $77.58 | $0.40 low | -0.5% | $17.33 |
| 2023 | Brent | USD/bbl | $100.94 | $83.10 | $82.49 | $0.61 high | 0.7% | $18.45 |
| 2023 | Henry Hub | USD/MMBtu | $6.42 | $4.90 | $2.53 | $2.37 high | 93.7% | $3.89 |
| 2024 | WTI | USD/bbl | $77.58 | $77.99 | $76.63 | $1.36 high | 1.8% | $0.95 |
| 2024 | Brent | USD/bbl | $82.41 | $82.49 | $80.52 | $1.97 high | 2.4% | $1.89 |
| 2024 | Henry Hub | USD/MMBtu | $2.54 | $2.66 | $2.19 | $0.47 high | 21.5% | $0.35 |
| 2025 | WTI | USD/bbl | $76.60 | $70.31 | $65.39 | $4.92 high | 7.5% | $11.21 |
| 2025 | Brent | USD/bbl | $80.56 | $74.31 | $69.14 | $5.17 high | 7.5% | $11.42 |
| 2025 | Henry Hub | USD/MMBtu | $2.19 | $3.14 | $3.52 | $0.38 low | -10.8% | $1.33 |
Common questions
What does the January EIA oil price forecast refer to?
This study uses the annual average WTI and Brent spot prices forecast for the same calendar year as the January outlook. It also scores the matching Henry Hub natural gas forecast.
How often was EIA closer than the prior year’s price?
Ten of 13 years for WTI, ten of 13 for Brent and eight of 13 for Henry Hub from 2013 through 2025. Each comparison uses the previous annual average as reported in that January issue.
Which forecast was usually closest in percentage terms?
Brent had the smallest median absolute percentage error, 7.5%, followed by WTI at 8.6% and Henry Hub at 14.8%. The denominator is the actual annual spot price for each benchmark and year.
Does the median error give a range for next year’s prices?
The median describes past absolute errors in this 13-year sample. It is a historical benchmark. A probability range would require a separate method and evidence.
Is the October outlook always closer?
No. October was closer than January in 11 of 13 years for WTI and Brent and 12 of 13 for Henry Hub. In 2023, January Brent was closer than both July and October. All three issues were estimating the same full calendar year.
Can I score this year’s forecast before the year ends?
Compare the dated outlooks to track changes in the estimate. To score an annual error, use the official full calendar-year spot price for that benchmark once it is published.
Can I apply the WTI or Henry Hub forecast to a royalty check?
Use it as market context. A specific check depends on production, the pricing arrangement, local realized prices, the ownership decimal, payment timing and applicable adjustments.
Sources and downloads
- Download the complete data (CSV)
- Download January, July and October forecasts (CSV) All 117 scored estimates with source PDF, page and matched annual actual.
- Download same-year and following-year comparisons (CSV) 36 benchmark-year comparisons with both January forecast issues and the annual actual.
- Download chart (PNG)
- January 2013 Short-Term Energy Outlook · Table 2, PDF page 27.
- January 2014 Short-Term Energy Outlook · Table 2, PDF page 28.
- January 2015 Short-Term Energy Outlook · Table 2, PDF page 29.
- January 2016 Short-Term Energy Outlook · Table 2, PDF page 32.
- January 2017 Short-Term Energy Outlook · Table 2, PDF page 35.
- January 2018 Short-Term Energy Outlook · Tables 1 and 2, PDF pages 36 and 37.
- January 2019 Short-Term Energy Outlook · Tables 1 and 2, PDF pages 35 and 36.
- January 2020 Short-Term Energy Outlook · Tables 1 and 2, PDF pages 32 and 33.
- January 2021 Short-Term Energy Outlook · Tables 1 and 2, PDF pages 36 and 37.
- January 2022 Short-Term Energy Outlook · Tables 1 and 2, PDF pages 37 and 38.
- January 2023 Short-Term Energy Outlook · Tables 1 and 2, PDF pages 28 and 29.
- January 2024 Short-Term Energy Outlook · Tables 1 and 2, PDF pages 31 and 32.
- January 2025 Short-Term Energy Outlook · Tables 1 and 2, PDF pages 35 and 36.
- EIA annual WTI spot price · Full calendar-year actuals, 2013 through 2025.
- EIA annual Brent spot price · Full calendar-year actuals, 2013 through 2025.
- EIA annual Henry Hub spot price · Full calendar-year actuals, 2013 through 2025.
- EIA 2022 crude oil review · Market context for the large 2022 crude price misses.
- EIA 2022 Henry Hub review · Market context and the 2022 annual gas price.
- EIA January 2026 outlook · Table 2 for the open-year example.
- EIA November 2026 outlook · Table 2 for the open-year example.
- EIA Short-Term Energy Outlook archive · Original July and October PDFs are linked row by row in the release-month CSV.
- EIA outlook release schedule · Dates for upcoming editions.
Attribute AMR’s analysis and chart to American Mineral Registry. Reuse the analysis and chart under CC BY 4.0. Original source materials retain the issuers’ own terms.