In four Texas General Land Office oil and gas lease sale tabulations from April 2025 through October 2026, 53 lease-numbered bid entries totaled $51,077,259.61 across 10,650.93 listed acres. The median tract bid was $2,600 per listed acre. Dividing all dollars by all acres gives $4,796 per listed acre.
One Loving County entry represented 75.5% of October 2025 tabulated bid dollars. The study explains why the statewide sale headline, typical tract and a private lease offer require different figures.
Key findings
- $51,077,259.61 · tabulated bid dollars
53 lease-numbered entries in four GLO sale documents. - $2,600 · median per listed acre
The same entries had an aggregate rate of $4,796 per listed acre. - 75.5% · October 2025 share from one tract
$8,284,479.12 on 462.51 listed Loving County acres.
Texas state lease bids per listed acre
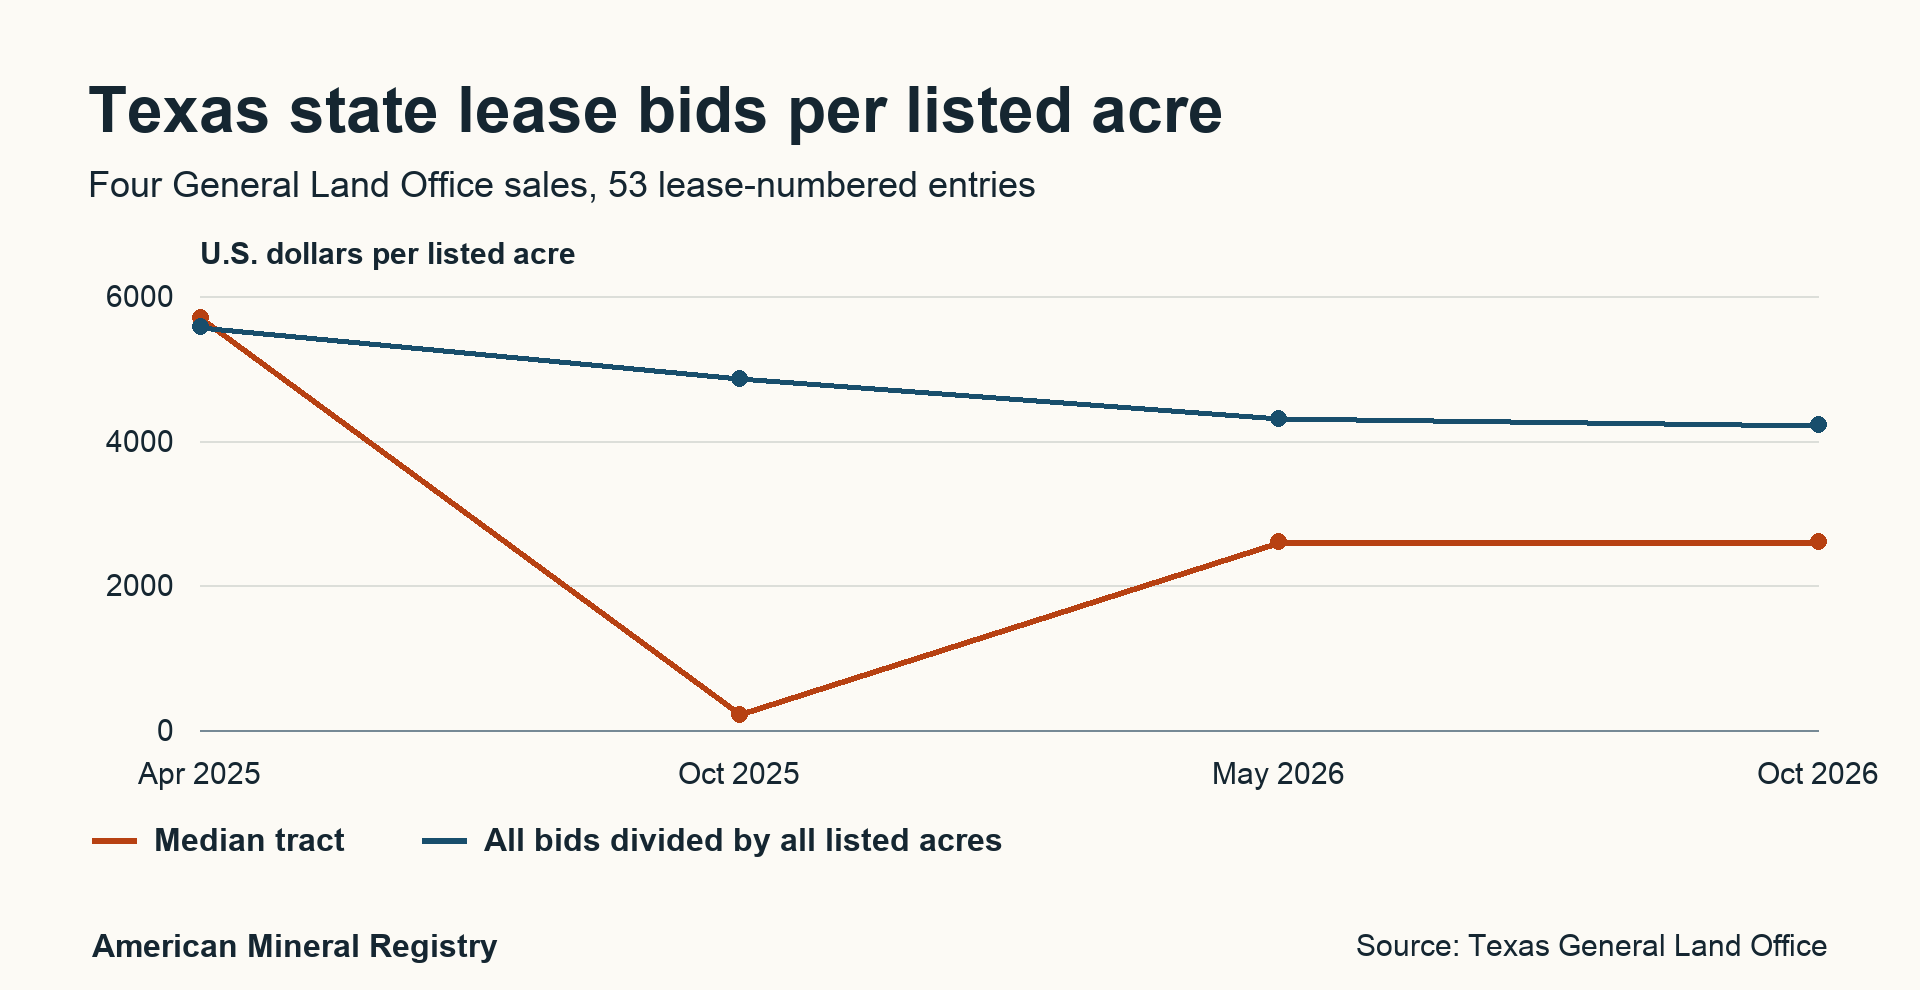
Figure 1 in text
Texas state lease bids per listed acre. Four General Land Office sales, 53 lease-numbered entries. Unit: U.S. dollars per listed acre.
The tract median gives each listed tract one vote. The aggregate rate divides the tabulated bids by their combined listed acreage. In October 2025, one Loving County entry represented 75.5% of the sale's tabulated dollars.
| Label | Median tract | All bids divided by all listed acres |
|---|---|---|
| Apr 2025 | 5701.0 | 5577.570007639325 |
| Oct 2025 | 217.96 | 4863.019596715555 |
| May 2026 | 2600.0 | 4308.712228231063 |
| Oct 2026 | 2600.0 | 4222.785626191277 |
Download these plotted values (CSV)
Permanent link to this figure’s text and data · Sources and context
What happened in October 2025?
In October 2025 the overall rate was $4,863 per listed acre, while the median tract was $217.96, a ratio of about 22.3 to one. The sale included a Loving County entry of $8,284,479.12 for 462.51 listed acres. That one entry accounted for 75.5% of the tabulated dollars. Removing it lowers the sale-wide rate to $1,497 per listed acre. The total changes with the composition of the sale, and the median describes the middle tract regardless of acreage.
Eight of the 15 lease-numbered entries were in St. Charles Bay or Tabbs Bay, with rates from $200 to $217.96 per listed acre. Those entries explain why the middle tract remained near $218 even as a single Loving County tract pushed the sale-wide ratio above $4,800.
The full-bids report identifies the $8.28 million entry with lease number MF-122310. A second line shows the same bidder and amount under a different application number, but marks it rejected. The comparison counts the lease-numbered line once.
GLO October 2025 full-bids report
How much did the leading tracts account for?
The three largest entries across all four sales accounted for 32.7% of the tabulated dollars. The largest single entry accounted for 16.2% of the entire panel. The following rows rank by bid dollars. A per-acre ranking would answer a different question because a small tract can carry a high rate without adding much to the sale total.
| Sale | County | Tract | Lease number | Listed acres | Bid | Bid per acre |
|---|---|---|---|---|---|---|
| Oct 21, 2025 | Loving | 1 | MF-122310 | 462.51 | $8,284,479.12 | $17,912.00 |
| Apr 15, 2025 | Loving | 6 | MF-122053 | 480.00 | $4,800,000.00 | $10,000.00 |
| Oct 20, 2026 | Ward | 30 | MF122686 | 640.00000 | $3,606,400.00 | $5,635.00 |
| Apr 15, 2025 | Loving | 9 | MF-122056 | 451.07 | $3,428,583.07 | $7,601.00 |
| May 12, 2026 | Ward | 34 | MF122482 | 440.00000 | $3,344,000.00 | $7,600.00 |
| Oct 20, 2026 | Reeves | 25 | MF122684 | 640.00000 | $3,269,120.00 | $5,108.00 |
| Apr 15, 2025 | Reeves | 11 | MF-122058 | 640.00 | $2,496,640.00 | $3,901.00 |
| May 12, 2026 | Ward | 30 | MF122478 | 322.85000 | $2,421,375.00 | $7,500.00 |
| May 12, 2026 | Culberson | 7 | MF122475 | 640.00000 | $2,019,840.00 | $3,156.00 |
| Apr 15, 2025 | Reeves | 10 | MF-122057 | 508.00 | $1,981,708.00 | $3,901.00 |
How concentrated were the four sales?
The three largest entries by dollars made up more than half of each sale’s tabulated bonus total. The smallest share among these four sales was in April 2025. October 2025 had the largest share. Compare this alongside the count of listed entries and the acreage, because the group of tracts changes with each sale.
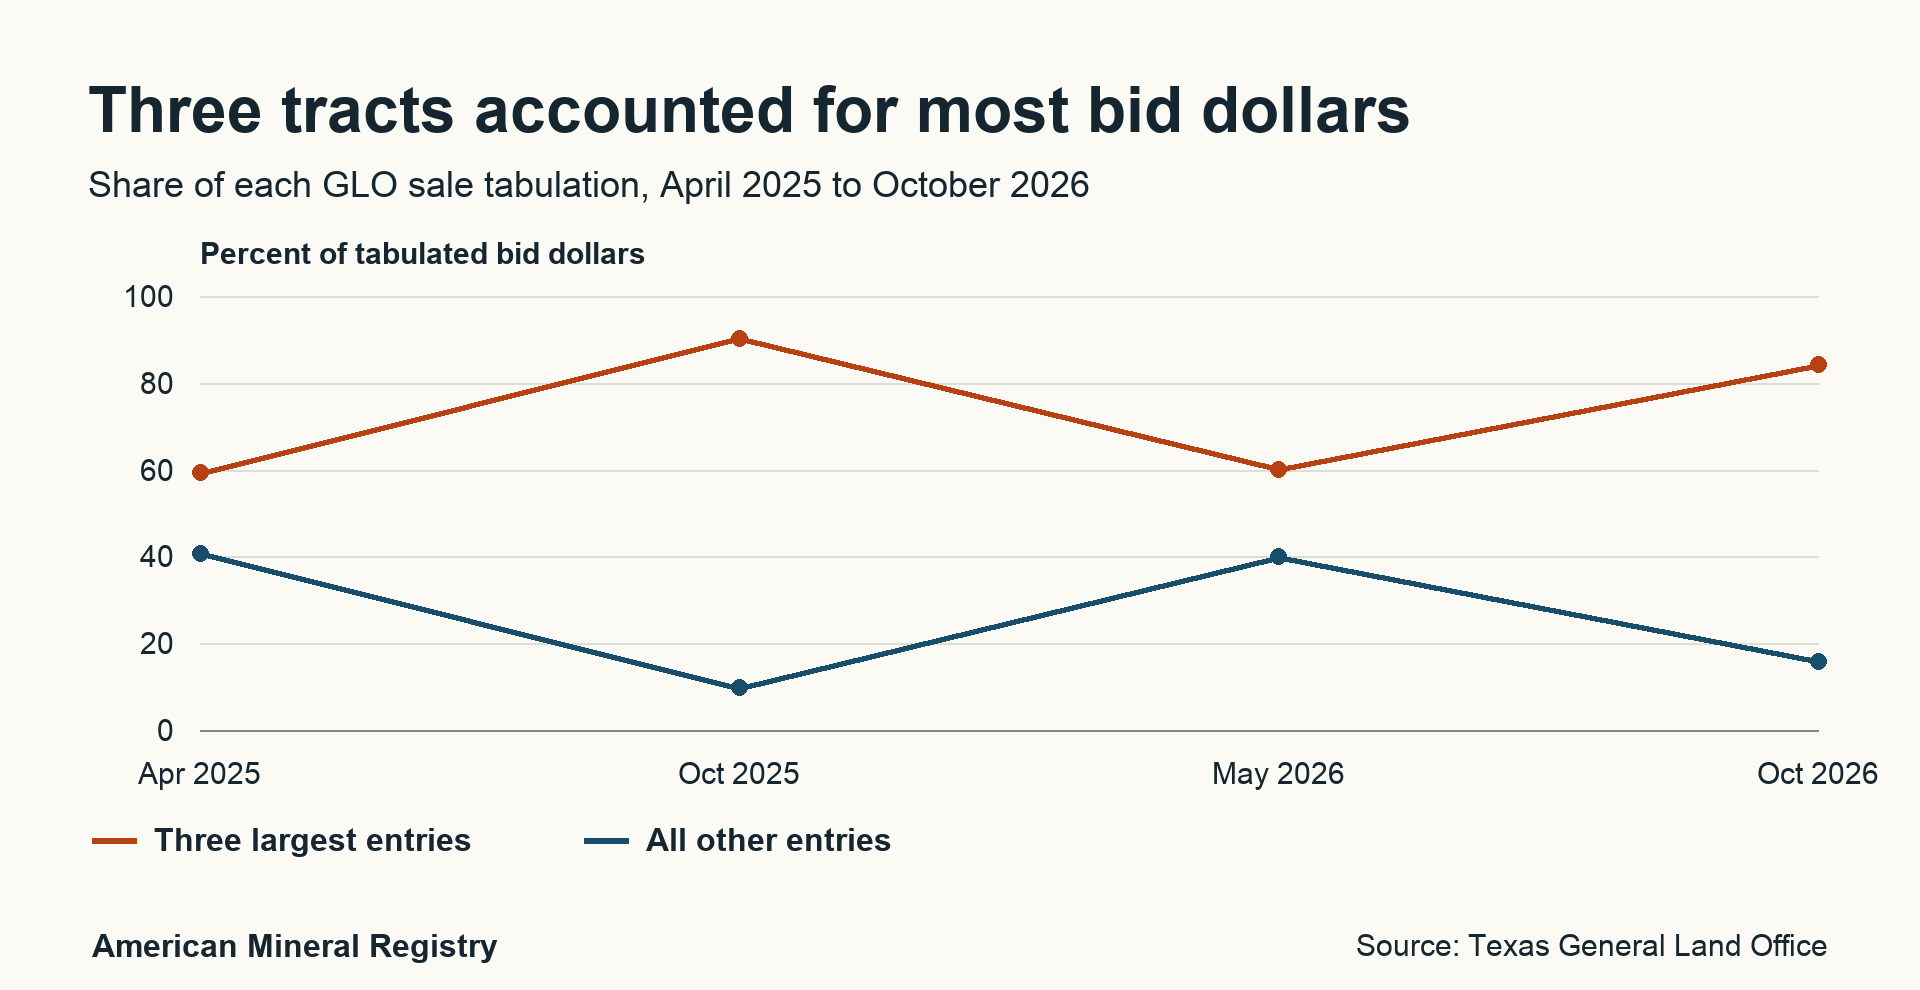
Figure 2 in text
Three tracts accounted for most bid dollars. Share of each GLO sale tabulation, April 2025 to October 2026. Unit: Percent of tabulated bid dollars.
Tracts are ranked separately in each sale by reported bid dollars. The denominator is the sum of lease-numbered entries in the same GLO tabulation.
| Label | Three largest entries | All other entries |
|---|---|---|
| Apr 2025 | 59.23312219334003 | 40.76687780665997 |
| Oct 2025 | 90.24725499245497 | 9.752745007545027 |
| May 2026 | 60.05771089625847 | 39.94228910374153 |
| Oct 2026 | 84.11786714777513 | 15.882132852224872 |
Download these plotted values (CSV)
Permanent link to this figure’s text and data · Sources and context
What changed between the two 2026 sales?
The May 2026 tabulation covered 3,008.53 listed acres and $12,962,890 of bids. October showed 2,140.56 acres and $9,039,126. The total fell 30.3%, while the aggregate bid rate fell 2.0%. The median was $2,600 in both sales.
The sale total and per-acre measure changed by very different amounts because October included fewer acres in the scored entries. Acreage and rate both enter the total. These two auctions offered different groups of tracts, so the comparison does not establish how the same acreage would have been priced in both months.
Where were the bid dollars concentrated?
Loving, Reeves and Ward together accounted for 90.2% of bid dollars in the four tabulations. This describes which of the observed tracts attracted the largest amounts. It does not measure the amount of mineral acreage or leasing demand in each county outside those tabulations. County labels below are those shown in the GLO PDFs.
| County | Entries | Listed acres | Tabulated dollars | Share of dollars | Median bid per acre |
|---|---|---|---|---|---|
| Loving | 6 | 1,786.59 | $20,184,483.29 | 39.5% | $10,000.00 |
| Reeves | 15 | 4,005.62 | $15,705,486.00 | 30.7% | $3,050.00 |
| Ward | 9 | 1,741.75 | $10,197,796.70 | 20.0% | $2,550.00 |
| Culberson | 1 | 640.00 | $2,019,840.00 | 4.0% | $3,156.00 |
| Midland | 1 | 160.00 | $1,200,011.00 | 2.3% | $7,500.07 |
| Dawson | 1 | 32.76 | $494,676.00 | 1.0% | $15,100.00 |
| Yoakum | 1 | 160.00 | $416,638.40 | 0.8% | $2,603.99 |
| Pecos | 4 | 408.22 | $399,818.30 | 0.8% | $1,250.00 |
| Aransas | 6 | 937.00 | $196,069.32 | 0.4% | $209.74 |
| Atascosa | 1 | 21.80 | $75,000.00 | 0.1% | $3,440.37 |
| Fisher | 1 | 160.00 | $48,000.00 | 0.1% | $300.00 |
| Jones | 1 | 118.32 | $35,496.00 | 0.1% | $300.00 |
| Harris | 2 | 177.10 | $35,420.00 | 0.1% | $200.00 |
| Jack | 1 | 175.96 | $28,153.60 | 0.1% | $160.00 |
| Galveston | 1 | 100.00 | $20,001.00 | 0.0% | $200.01 |
| Gregg | 1 | 25.65 | $19,365.00 | 0.0% | $754.97 |
| Live Oak | 1 | 0.16 | $1,005.00 | 0.0% | $6,281.25 |
What range of bids per acre did the records show?
The observed range ran from $73 per listed acre for October 2026 tract 40 in Pecos County to $17,912 for October 2025 tract 1 in Loving County. The low-rate Pecos tract had 164.10 listed acres and a $11,979.30 entry. In the same sale a 0.16-acre Live Oak County tract had a $1,005 entry, or $6,281.25 per listed acre. An acreage-normalized rate is useful for comparing bids, but a small denominator can amplify the rate without making the transaction large.
Which per-acre number should I cite?
| Question | Use this measure | State the denominator |
|---|---|---|
| What was the middle bid per listed acre? | Median tract rate | One observation per lease-numbered tract |
| How many bid dollars were shown per combined acre? | Aggregate bid rate | Sum of listed acres for those same entries |
| What did a single bidder offer? | That tract's tabulated bid | MGL number, lease number, sale date and listed acres |
| How much money reached a public fund? | A receipt or fund accounting record | Account, receipt period and component |
For a reporter covering a new sale, quote the sale's nominal total, the tract count, both rate measures and the largest tract's share. That gives readers the headline amount and shows whether it is representative of most entries.
What a bid can tell a mineral owner
A dollar bid for a state lease concerns the opportunity described by that state tract, including its legal description and any depth restrictions. A comparable private offer also depends on the acreage actually owned, the rights included, the agreement's royalty and term, and the economics of the acreage. A bid amount is an upfront lease amount. Royalties are based on production under the lease, and a mineral purchase pays for an ownership interest. Compare like transaction types and units first.
The GLO leasing guide describes separate state pathways, including sealed bid sales, Relinquishment Act leasing and roadway leasing. April 2025's tabulation also includes a tract described as Fort Richardson State Historical Park. The bid total alone does not establish how much was ultimately collected or which account received money from every tract. For recorded school fund receipts and subsequent account flows, use the school fund receipts and distributions crosswalk.
How the comparison was built
- Open the four GLO tabulations for April 15 and October 21, 2025, and May 12 and October 20, 2026. Use the printed dates inside the PDFs.
- Keep the dollar entry on the same row as a lease number, along with the tract, county, listed acres and physical PDF page. Keep one entry per lease number and tract in each sale.
- Divide each entry's bid by that same entry's listed acres. For the median, rank these tract rates and use the middle value, or average the middle two. For the aggregate rate, divide the sum of bids by the sum of listed acres.
- Calculate concentration using bid dollars before rounding. Rank within the relevant sale or across the four tabulations as labeled. Check the page and lease number for each cited amount in the CSV.
The GLO describes these PDFs as preliminary tabulations. This study covers the entries that carry lease numbers in those four documents. A skipped tract number does not establish a no-bid or withdrawn tract. The analysis does not calculate offer-to-lease conversion, bidder counts, premiums above minimum, recorded lease totals or cash collections.
Texas state lease auction bid statistics by sale
| Sale date | Entries | Listed acres | Bid dollars | Median per acre | Aggregate per acre | Largest bid share |
|---|---|---|---|---|---|---|
| Apr 15, 2025 | 12 | 3,246.36 | $18,106,800.17 | $5,701.00 | $5,577.57 | 26.5% |
| Oct 21, 2025 | 15 | 2,255.48 | $10,968,443.44 | $217.96 | $4,863.02 | 75.5% |
| May 12, 2026 | 15 | 3,008.53 | $12,962,890.00 | $2,600.00 | $4,308.71 | 25.8% |
| Oct 20, 2026 | 11 | 2,140.56 | $9,039,126.00 | $2,600.00 | $4,222.79 | 39.9% |
Common questions
What was the median bid per acre in the four Texas state lease sales?
The median was $2,600 per listed acre across 53 lease-numbered entries in the GLO tabulations for April and October 2025 and May and October 2026.
Why was the total divided by all acres higher than the median?
The aggregate rate reflects the size and dollar value of each tract. The median ranks the tract rates and gives every tract one observation. Large bids on substantial tracts can pull the aggregate rate above the median.
What was the largest bid in the sample?
An October 21, 2025 Loving County entry associated with lease MF-122310 totaled $8,284,479.12 for 462.51 listed acres, equal to $17,912 per listed acre.
Does the tabulation establish receipts or executed leases?
The GLO describes its bid tabulations as preliminary. The study aggregates rows carrying lease numbers. Verify receipts in a financial record and executed leases in the relevant official lease file.
Can I treat a missing tract number as an unbid tract?
Use the corresponding official offered inventory and recorded outcome for that tract. A numbering gap in a bid tabulation alone does not establish what happened to it.
Can I use these numbers to price a private mineral sale?
They are state lease bids with the acreage and rights described in state records. A purchase of private mineral rights involves ownership, production, and other terms that a state lease bid does not measure.
Sources and downloads
- GLO bid tabulation, Apr 15, 2025 · 12 lease-numbered entries. Physical PDF page and lease number appear in the CSV.
- GLO bid tabulation, Oct 21, 2025 · 15 lease-numbered entries. Physical PDF page and lease number appear in the CSV.
- GLO bid tabulation, May 12, 2026 · 15 lease-numbered entries. Physical PDF page and lease number appear in the CSV.
- GLO bid tabulation, Oct 20, 2026 · 11 lease-numbered entries. Physical PDF page and lease number appear in the CSV.
- Texas GLO past bid sales archive · Lists the four tabulations used here. Dates for the comparison come from the PDFs.
- GLO October 2025 full-bids report · Provides application records and confirms the lease-numbered Loving County example.
- Texas GLO leasing guide · Describes the state leasing pathways and the October 2026 sealed bid sale.
Attribute AMR’s analysis and chart to American Mineral Registry. Reuse the analysis and chart under CC BY 4.0. Original source materials retain the issuers’ own terms.