In seven of 16 large producing states studied, entities at 15 barrels of oil equivalent per day or less accounted for at least 70% of producing entities but under 10% of reported natural gas output in 2024. Pennsylvania had 86.4% of its producing entities in that bracket and 1.0% of its gas output. Kansas had 99.0% of producing entities and 91.5% of gas output, with the source reporting Kansas at the lease level.
A fixed 16-state panel compares well-count, oil and gas shares and separately ranks volumes from the low-production class. The study uses the EIA's final production-rate edition.
Key findings
- 7 of 16 · Large producing states with a count-versus-gas gap
At least 70% of producing entities and under 10% of reported gas were in the ≤15 BOE/day class in 2024. - 110.159 million bbl · Texas low-rate oil volume
The 2024 figure exceeded the 106.748 million barrels reported for all Wyoming rate classes. - 5.8% · Share of gas from low-rate entities across the panel
These entities accounted for 77.6% of the 16 states' producing entities in 2024.
Low-producing entities and their output, 2020 to 2024
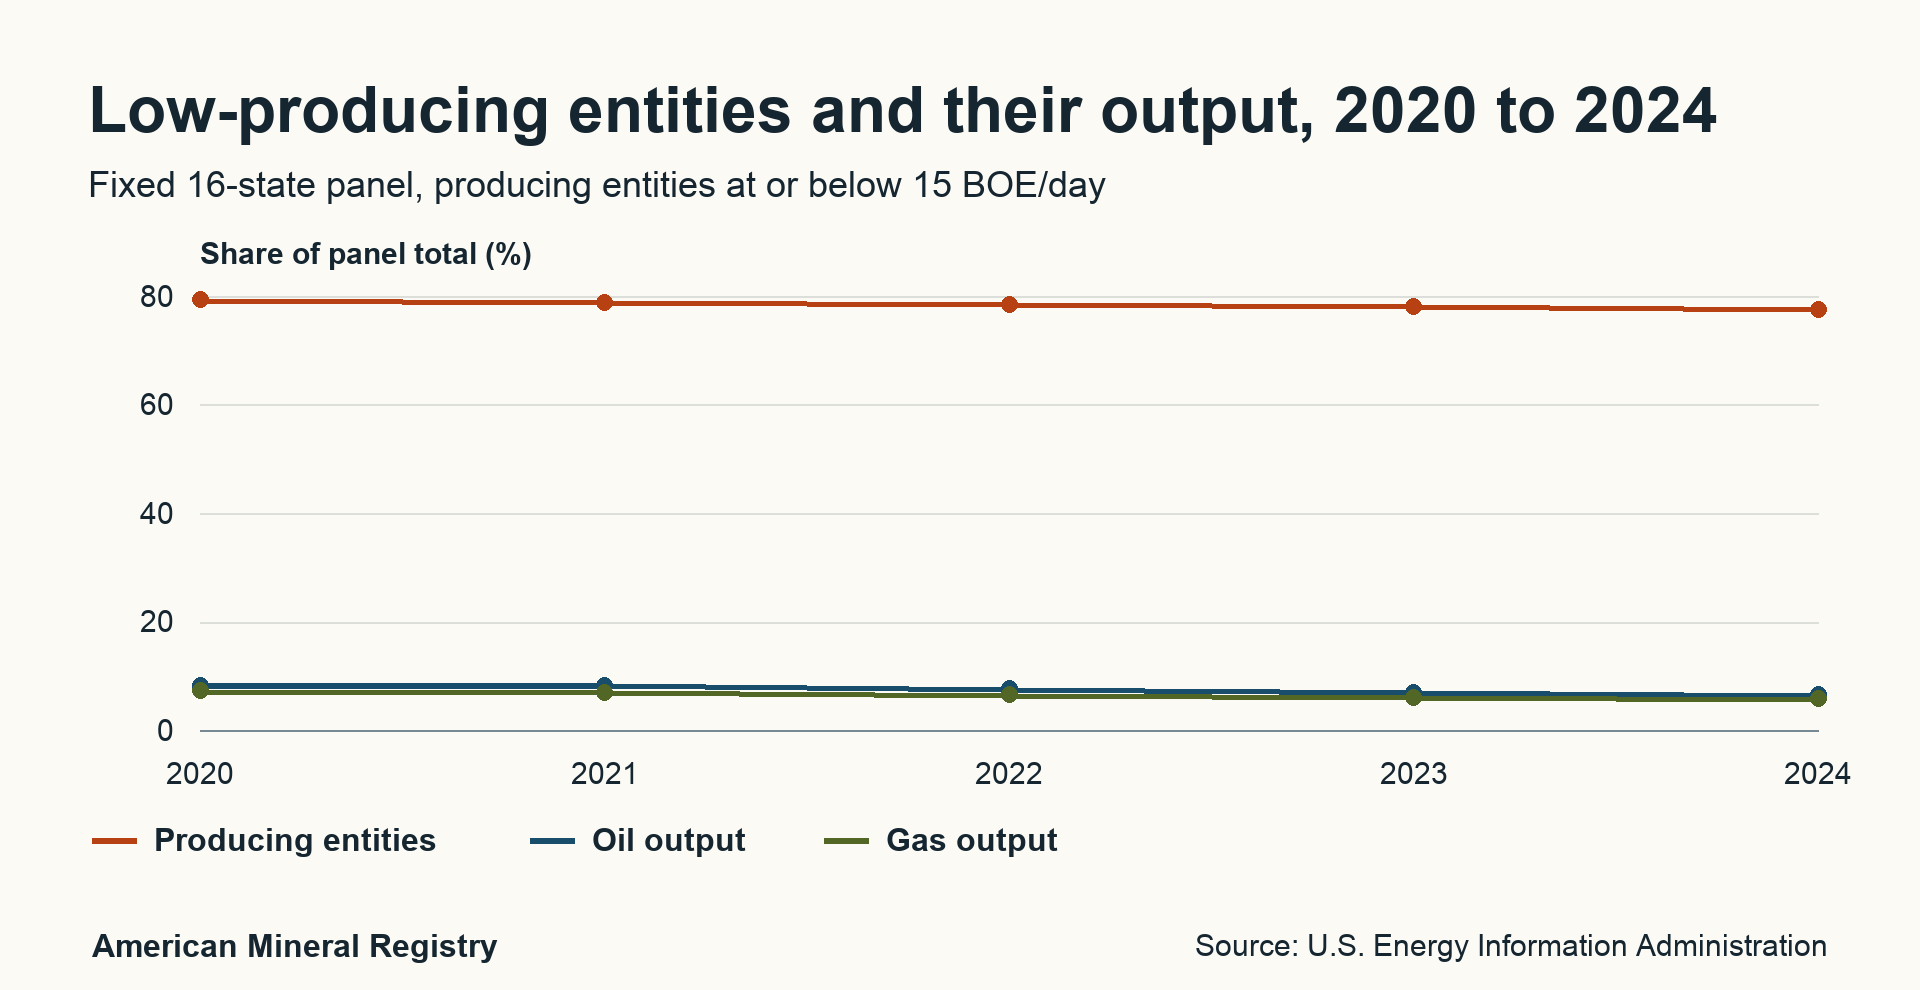
Figure 1 in text
Low-producing entities and their output, 2020 to 2024. Fixed 16-state panel, producing entities at or below 15 BOE/day. Unit: Share of panel total (%).
Each panel share divides summed low-rate amounts by the summed all-rate amount for the same metric and year. Source: U.S. Energy Information Administration, final 2024 edition.
| Label | Producing entities | Oil output | Gas output |
|---|---|---|---|
| 2020 | 79.31 | 8.27 | 7.22 |
| 2021 | 78.87 | 8.25 | 6.93 |
| 2022 | 78.44 | 7.57 | 6.51 |
| 2023 | 78.07 | 6.96 | 6.01 |
| 2024 | 77.58 | 6.53 | 5.8 |
Download these plotted values (CSV)
Permanent link to this figure’s text and data · Sources and context
Why the answer depends on the state and commodity
Use the state table for three distinct questions. The entity share describes how common low rates are. The oil share measures how much of the state's oil these entities produced. The gas share measures how much of its natural gas they produced. Each share uses the all-rate total for that metric from the same state and year.
The seven states with at least 70% of entities in the low-rate class and under 10% of gas output from that class are Louisiana, New Mexico, Ohio, Oklahoma, Pennsylvania, Texas and West Virginia. They span different volumes and well mixes. That result identifies a count-versus-gas-output gap, with no finding about any particular well's economics.
In Pennsylvania, 72,961 out of 84,427 entities were at or below the cutoff. They supplied 75.197 of 7,463.857 Bcf of reported gas. Their share of the much smaller Pennsylvania oil total was 19.5%. In California, the low-rate class supplied 45.1% of reported oil and 29.4% of gas. Kansas has a markedly different gas profile from Pennsylvania, and the EIA workbook labels Kansas as lease-level data.
A large percentage can describe a small amount of output. New York's displayed low-rate and total oil volumes are both 0.206 million barrels at the workbook's precision. Read that result as 100% of the displayed oil volume, and compare the state volumes separately before assessing their national importance.
Which states produced the most from low-rate entities?
Texas led the 16-state panel in low-rate entity count, oil output and gas output. Its 110.159 million barrels exceeded the 106.748 million barrels recorded for all rate classes in Wyoming. Low-rate oil still accounted for only 5.3% of the oil recorded for Texas. The absolute and percentage comparisons answer different questions.
| Rank | State by low-rate oil output | Million barrels | State by low-rate gas output | Bcf |
|---|---|---|---|---|
| 1 | Texas | 110.159 | Texas | 714.472 |
| 2 | California | 51.142 | New Mexico | 336.064 |
| 3 | Kansas | 21.582 | Colorado | 252.921 |
| 4 | Oklahoma | 18.243 | Oklahoma | 250.530 |
| 5 | New Mexico | 12.819 | Wyoming | 159.303 |
Texas accounted for 40.8% of low-rate oil and 28.1% of low-rate gas in the separate EIA national benchmark. That benchmark has broader geographic coverage than the 16-state panel and incorporates the reporting exceptions described below. For within-state dependence, divide by Texas's state total instead of the national low-rate total.
Did the gap change between 2020 and 2024?
Using the same 16 states throughout, the low-rate share fell from 79.3% to 77.6% for producing entities, from 8.3% to 6.5% for oil and from 7.2% to 5.8% for gas. Combined shares come from summing all 16 numerators and denominators separately. An arithmetic average of state percentages would give a small-volume state the same weight as Texas.
| Year | Low-rate entities | Low-rate oil, million bbl | Low-rate gas, Bcf | Entity share | Oil share | Gas share |
|---|---|---|---|---|---|---|
| 2020 | 708,769 | 274.556 | 2,555.872 | 79.3% | 8.3% | 7.2% |
| 2021 | 694,579 | 271.512 | 2,523.361 | 78.9% | 8.2% | 6.9% |
| 2022 | 694,353 | 268.211 | 2,511.865 | 78.4% | 7.6% | 6.5% |
| 2023 | 688,374 | 267.242 | 2,435.369 | 78.1% | 7.0% | 6.0% |
| 2024 | 675,176 | 259.861 | 2,354.589 | 77.6% | 6.5% | 5.8% |
Between the two endpoints, reported low-rate oil and gas volumes fell within this panel while all-rate oil and gas volumes rose. Annual percentages compare production groups as they were classified in each year. They cannot distinguish decline at an individual well from entry, retirement or a move between rate classes.
| State | Low-rate gas share in 2020 | In 2024 | Change |
|---|---|---|---|
| Texas | 7.9% | 5.6% | -2.2 pp |
| New Mexico | 18.2% | 9.5% | -8.8 pp |
| Pennsylvania | 1.2% | 1.0% | -0.2 pp |
| Kansas | 89.7% | 91.5% | +1.8 pp |
New Mexico's gas share fell more than Texas's in percentage points, while the Kansas share increased. The state series can move in different directions even when the pooled share falls.
How much does the production cutoff matter?
The headline uses the EIA subtotal at 15 BOE/day. The same workbook supplies the 0–1 bracket and the subtotal at 10 BOE/day, so readers can see how tighter thresholds change the picture. These are nested groups, so each row already includes the narrower group above it.
| 2024 rate cutoff | Entities | Entity share | Oil output share | Gas output share |
|---|---|---|---|---|
| 0–1 BOE/d | 326,260 | 37.49% | 0.43% | 0.31% |
| ≤10 BOE/d | 631,601 | 72.57% | 4.70% | 4.01% |
| ≤15 BOE/d | 675,176 | 77.58% | 6.53% | 5.80% |
The 0–1 BOE/day bracket accounts for more than one-third of producing entities in the panel and less than one-half of one percent of either commodity's output. Moving from the 10 to the 15 threshold admits a relatively small additional fraction of entities and a larger incremental share of volume relative to the narrow group's volume. Choose the published cutoff that matches your question and give it alongside the figure.
What is counted as a low-producing well?
BOE/day is a combined oil and gas rate used to assign a production bracket. For classification, EIA converts natural gas using 6,000 cubic feet per barrel of oil equivalent and adds the liquid volume. The rate uses calendar days under EIA's first-year, last-year and intervening-year rules. Oil and gas volumes in the shares remain separate commodity measures. EIA methodology
The workbook counts producing entities, which may be individual wellheads, sidetracks, completions, recompletions or leases. EIA describes allocation where a lease's wells are known and possible undercounting where lease-level data lack a well count. Appendix A lists Kansas as lease-level and Pennsylvania as well-level. The comparison uses EIA's categories without assuming that the records in those states represent the same physical unit. The Appendix A reporting status and the separate table of available record types answer different questions. EIA Appendix A, table A2
For regulatory comparisons, read the applicable program's own scope. For example, EPA's marginal conventional well discussion identifies a well geometry, known owner or operator, and a prior 12-month period. Those criteria are outside this tabulation. EPA definition and scope
How to reproduce and cite the state comparison
The inclusion rule is fixed across 2020 through 2024. A state needed at least 10,000 producing entities in 2024 and a Complete reporting status in EIA Appendix A for every study year. That yields 16 states and 80 complete state-years with positive denominators for all three metrics. The threshold is a comparison choice, with no implication that states below it have no low-producing wells. Kentucky meets the count threshold in the workbook but its 2024 figures are carried from 2023. Federal offshore areas are outside the state panel.
For each state-year, read the Appendix C Data sheet's total producing entities, annual oil and annual gas columns, S through U. Read class 8.5 for the ≤15 subtotal and class 23 for the all-rate total. Divide each subtotal by its matching all-rate value. The CSV supplies the source row for all four cutoffs, the input amounts and the calculated percentages. Independently adding the non-overlapping brackets reconciles the totals within source rounding. Appendix B separately displays the 2024 inputs.
Give the year, geography, cutoff, commodity and denominator with any statistic. For an emissions comparison, use an emissions study with matching years and well-site coverage. Production volume alone cannot establish emissions, tax eligibility, operating margin, well condition or royalty value.
The source edition was released in December 2025 and ends in 2024. EIA says this report stopped being updated effective October 15, 2026. Current state totals can come from other sources, but substitute data need a matched rate classification and entity definition before extending this series. EIA report status
Low-producing oil and gas wells by state in 2024
| State | Producing entities | Entities at ≤15 BOE/d | Entity share | Oil output share | Gas output share |
|---|---|---|---|---|---|
| Texas | 281,164 | 199,563 | 71.0% | 5.3% | 5.6% |
| Pennsylvania | 84,427 | 72,961 | 86.4% | 19.5% | 1.0% |
| Oklahoma | 67,302 | 52,529 | 78.0% | 12.5% | 9.7% |
| Kansas | 65,607 | 64,973 | 99.0% | 80.4% | 91.5% |
| New Mexico | 62,044 | 44,940 | 72.4% | 1.7% | 9.5% |
| West Virginia | 56,630 | 52,561 | 92.8% | 7.8% | 3.2% |
| California | 46,766 | 40,084 | 85.7% | 45.1% | 29.4% |
| Colorado | 43,860 | 29,772 | 67.9% | 3.2% | 13.6% |
| Ohio | 35,866 | 32,399 | 90.3% | 5.7% | 1.3% |
| Wyoming | 30,273 | 19,897 | 65.7% | 10.5% | 13.1% |
| Louisiana | 28,836 | 22,532 | 78.1% | 20.5% | 1.6% |
| North Dakota | 20,871 | 4,142 | 19.8% | 1.9% | 1.1% |
| Utah | 12,806 | 9,903 | 77.3% | 9.9% | 27.3% |
| Michigan | 12,662 | 12,462 | 98.4% | 50.7% | 92.0% |
| Arkansas | 10,667 | 5,981 | 56.1% | 46.0% | 17.2% |
| New York | 10,494 | 10,477 | 99.8% | 100.0% | 82.8% |
Common questions
Are low-producing wells the same as orphaned wells?
No. A low-producing well is classified by its production rate. Orphan status concerns legal or operational responsibility. The workbook does not identify which entities are orphaned. For the responsibility and inventory criteria, use the national orphan well inventory definitions.
Why are the Texas low-rate shares small if its absolute volumes are large?
The state also records a large volume from entities above 15 BOE/day. The absolute production and the share of a statewide total have different denominators.
Can I compare the EIA state percentages to a national emissions percentage?
Only after checking that the definitions, years and coverage agree. This study measures production and producing-entity counts. It does not estimate methane emissions.
Why do other estimates report a different number of wells?
Some count physical wellheads or well sites. EIA's workbook counts producing entities and documents lease allocations, reporting gaps and carry-forward data in the national benchmark.
Does 15 BOE/day mean 15 barrels of oil per day?
No. BOE/day combines oil and gas after energy conversion. A producer can be in the class with little or no oil production.
Which states are included?
Arkansas, California, Colorado, Kansas, Louisiana, Michigan, New Mexico, New York, North Dakota, Ohio, Oklahoma, Pennsylvania, Texas, Utah, West Virginia and Wyoming. The full five-year panel is in the CSV.
Is there a later edition?
The agency discontinued this production-rate publication effective October 15, 2026. The last edition shown by EIA covers years through 2024.
Sources and downloads
- EIA well production-rate report · Final edition, released December 2025, with data through 2024 and publication status.
- EIA Appendix C full datasheet · Data sheet, columns S–U. Source row IDs appear in the study CSV.
- EIA Appendix A reporting and record types · Tables A1 and A2 determine reporting coverage and describe producing-entity records.
- EIA Appendix B summary tables · 2024 state tabs and the national 2024 block independently display the matching source values.
- EIA methods · Definitions, oil-equivalent calculation, source pressure base and days in production.
- EIA FAQ · Reporting lags and data scope.
- AMR national low-producing well statistics · Companion reference on the national figures.
Attribute AMR’s analysis and chart to American Mineral Registry. Reuse the analysis and chart under CC BY 4.0. Original source materials retain the issuers’ own terms.