This reference reconciles all national program funding rows, every state award recipient, federal project targets, Tribal award labels and the actual reporting cutoffs. American Mineral Registry provides reproducible tables, specific finding links and downloads. The comparison preserves source precision and unresolved differences, distinguishes documented inventory from all abandoned wells, and explains what the records establish about plugging, land restoration and public spending.
Key Takeaways
- 13,108 wells were reported plugged nationally with IIJA funds through June 30, 2026. (DOI, FY 2026 report, Nov 2026).
- $1,862,875,009 in cumulative State Program awards covered 27 recipients through September 30, 2026. (DOI, FY 2026 report, Nov 2026).
- 130,121 documented unplugged wells appear in the September 2026 USGS release description, covering 28 states. (USGS, documented well database, Sep 2026).
- 130,122 is the separate documented inventory figure quoted in DOI's FY 2026 report. (DOI, FY 2026 report, Nov 2026).
- 117,672 documented wells were recorded in the August 2022 inventory described by DOI. (DOI, FY 2026 report, Nov 2026).
- $338.3 million was awarded or transferred across programs during FY 2026, according to DOI. (DOI, FY 2026 report, Nov 2026).
- 60.76% of reported cumulative state awards were Formula Grants, using DOI's exact dollar totals. (DOI, FY 2026 report, Nov 2026).
- 45.82% of state awards went to the five recipients with the largest reported award totals. (DOI, FY 2026 report, Nov 2026).
- 12,658 State Program wells were reported plugged through June 2026. (DOI, FY 2026 report, Nov 2026).
- 346 Federal Program wells were reported plugged through June 30, 2026. (DOI, FY 2026 report, Nov 2026).
- 127 Tribal Program wells were reported plugged through the later September 30, 2026 cutoff. (DOI, FY 2026 report, Nov 2026).
- 11,409 records in DOI's plugged well dataset reflect submissions received through January 31, 2026. (DOI, plugged well dataset, Apr 2026).
- 6,554 restored acres through June 30, 2026 include estimated acreage where recipient reports were missing. (DOI, FY 2026 report, Nov 2026).
What does the national orphan well inventory actually count?
The current USGS release counts qualifying documented unplugged orphaned wells in contributing state data. It is an inventory of known records under varying state definitions. It is not a comprehensive count of every abandoned well, nor a fixed starting cohort for measuring federal cleanup completion.

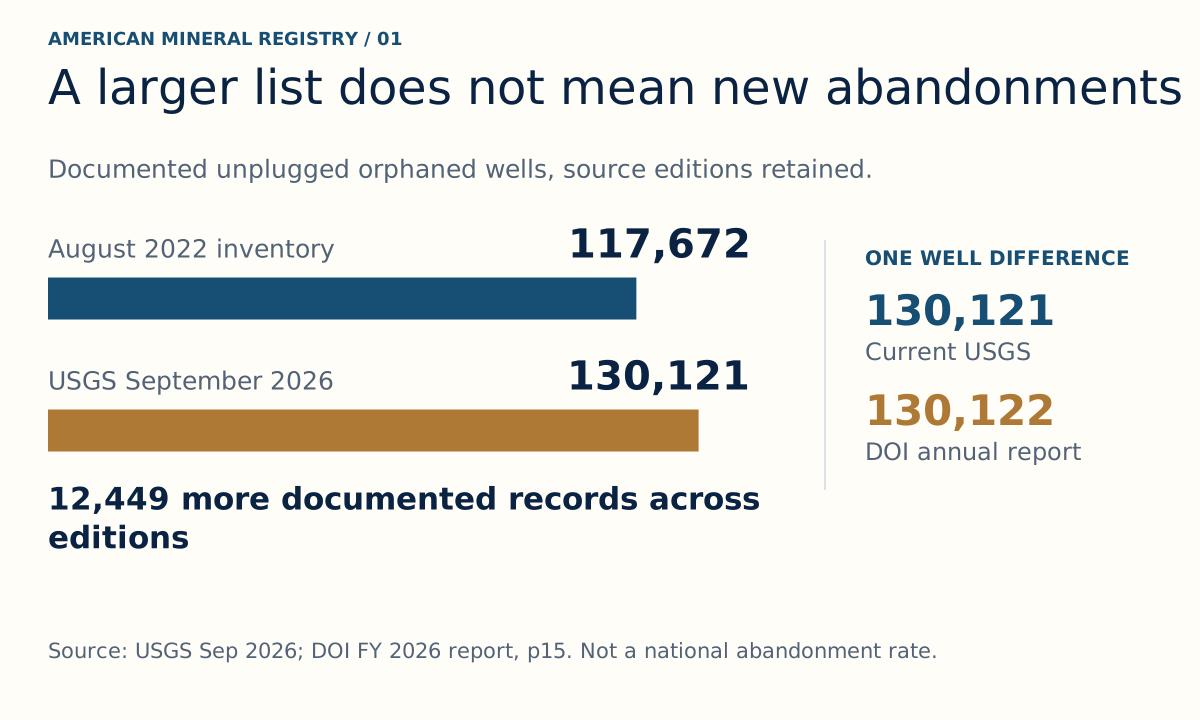

Figure 1 in text
Documented records, different vintages Known unplugged orphan inventory grew as documentation improved. Current USGS and annual report differ by one record.
AMERICAN MINERAL REGISTRY / 01 A larger list does not mean new abandonments Documented unplugged orphaned wells, source editions retained. August 2022 inventory
117,672 USGS September 2026
130,121
12,449 more documented records across
editions
ONE WELL DIFFERENCE
130,121 Current USGS
130,122 DOI annual report Source: USGS Sep 2026; DOI FY 2026 report, p15. Not a national abandonment rate.
Additional phone figure text: One well remains unresolved · Both figures stay attributed. No · record-level cause is established.
Source and data: USGS, September 2026 release · DOI FY 2026 report, p15
Permanent link to this figure’s text and data · Sources and context
How is an orphaned well different from an abandoned or idle well?
Orphan status concerns the absence of an available responsible operator as well as the well's operating and plugging status. An inactive well is not automatically an orphan, and a documented orphan inventory does not count every abandoned well. For a separate classification based on output, see how low producing wells are counted.
DOI describes the infrastructure law's general category as wells no longer used for an authorized purpose for which no operator can be located, or whose operator cannot plug and restore the site. It also explains that states apply their own definitions on state and private lands. Those legal and administrative differences affect which records enter a database. (DOI, FY 2026 report, Nov 2026).
USGS's current description includes state identified unplugged orphans or wells meeting its listed conditions concerning inactivity, plugging status, responsible parties and documented location. The inactive period varies by state. A database compiled from those records can support planning and research while remaining different from a uniform national inspection of all legacy wells. (USGS, documented well database, Sep 2026).
The practical implication is to retain the qualifying words documented, unplugged and orphaned when quoting the inventory. Removing documented implies coverage of unknown wells. Removing unplugged changes the physical status. Substituting abandoned changes the responsible party and classification question. The same well can also appear in an operational database and later in a funded plugging database at different stages of its history.
Why does the documented inventory rise between releases?
More complete records and broader coverage can enlarge a database even while plugging work removes wells. A comparison between database editions is therefore a comparison of documented records, not a direct measure of newly created liabilities.
DOI compares an August 2022 documented inventory of 117,672 wells with an updated count of 130,122. On the report's own figures, the difference is 12,450 records. The report attributes the increase to improved collection, refined classifications, updated databases and expanded inspections, much of it supported by infrastructure law funding. (DOI, FY 2026 report, Nov 2026).
Using the current USGS description's 130,121 count instead gives a difference of 12,449 from the same historical count. This is American Mineral Registry's arithmetic across identified vintages. It is not an estimate of wells newly orphaned during the intervening period. The newer USGS description also covers a different number of contributing states. (USGS, documented well database, Sep 2026).
A genuine stock and flow account would follow an identified starting population, newly discovered or newly qualifying wells, removals, reclassifications and completed plugging records. The reviewed national descriptions do not supply that matched transition table. Subtracting cumulative plugged wells from an old inventory would omit those other changes and could create an inaccurate apparent remainder.
Which current inventory figure should a writer quote?
Use the figure belonging to the source being described and disclose the small discrepancy when comparing them. There is no verified basis here for assigning the difference to a particular well or silently choosing a corrected report value.
The September 30, 2026 USGS release description says 130,121 documented unplugged wells in 28 states. DOI's FY 2026 annual report says 130,122. The difference is one whole well, and the reviewed records do not explain it. A quotation of the database should use the USGS description; a quotation of the report should retain DOI's figure and attribution. (USGS, documented well database, Sep 2026) (DOI, FY 2026 report, Nov 2026).
A release date is also not a promise that every contributing state observed its wells on that day. The inventory is compiled from source databases. The archived description and the downloadable source ledger preserve the edition used for this page so that a later revision can be examined without rewriting what this comparison originally measured.
For the separate geographic question, see which Texas counties have the most listed orphan wells. That study groups a specific Texas regulator workbook by county. It does not supply the denominator for this national federal funding account.
How much federal orphan well funding has moved?
DOI's funding table reports different financial stages at different precision. Original allocations, deductions, direct program amounts, annual awards and cumulative distributions answer different questions. Keeping every column prevents a rounded program ceiling from being mistaken for paid cleanup work.

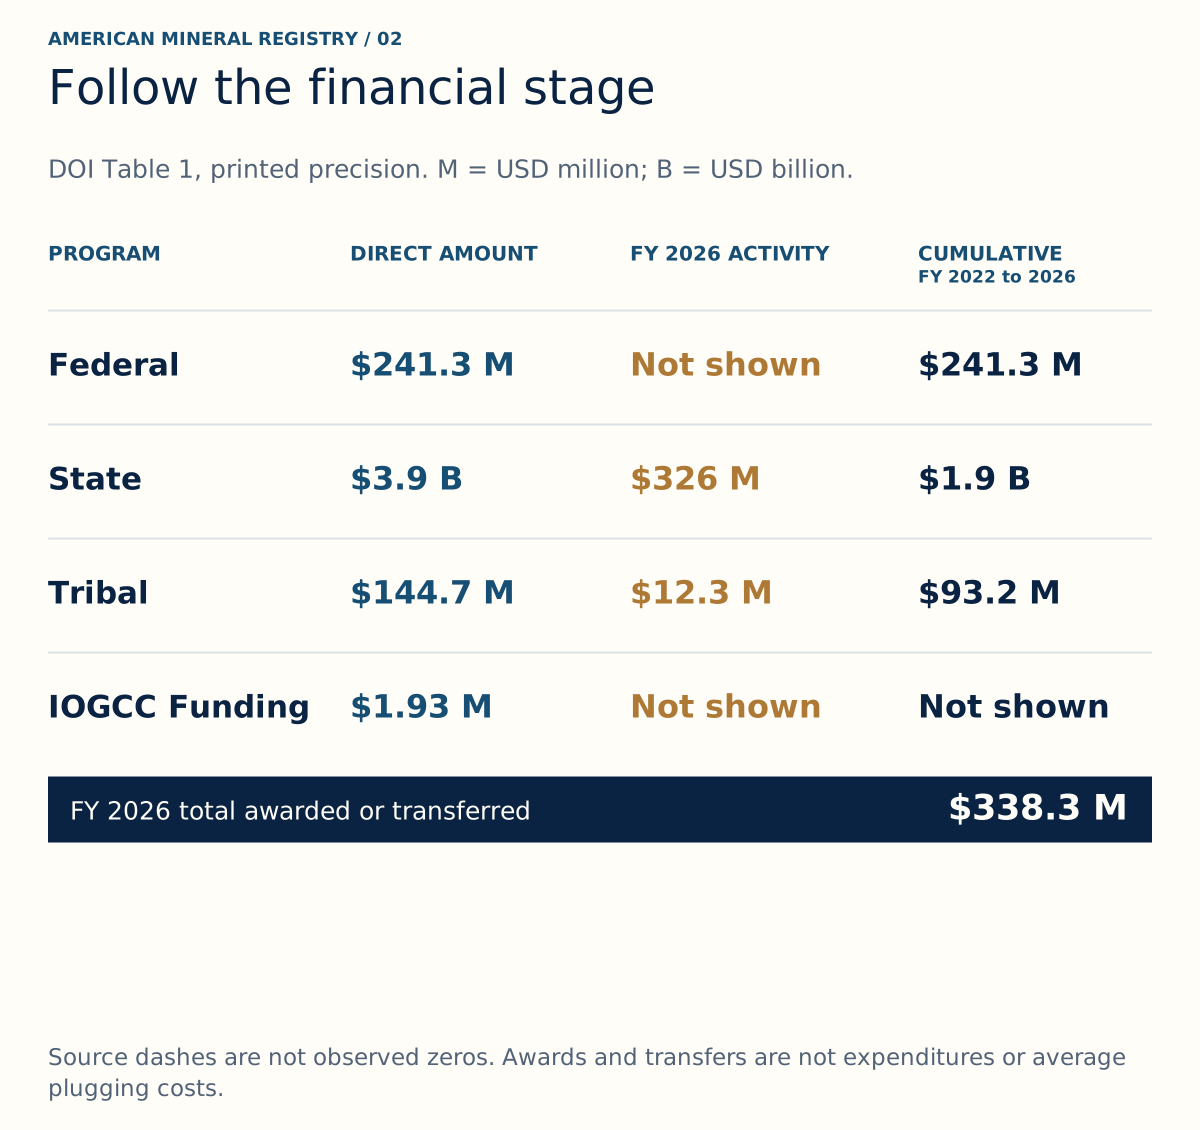
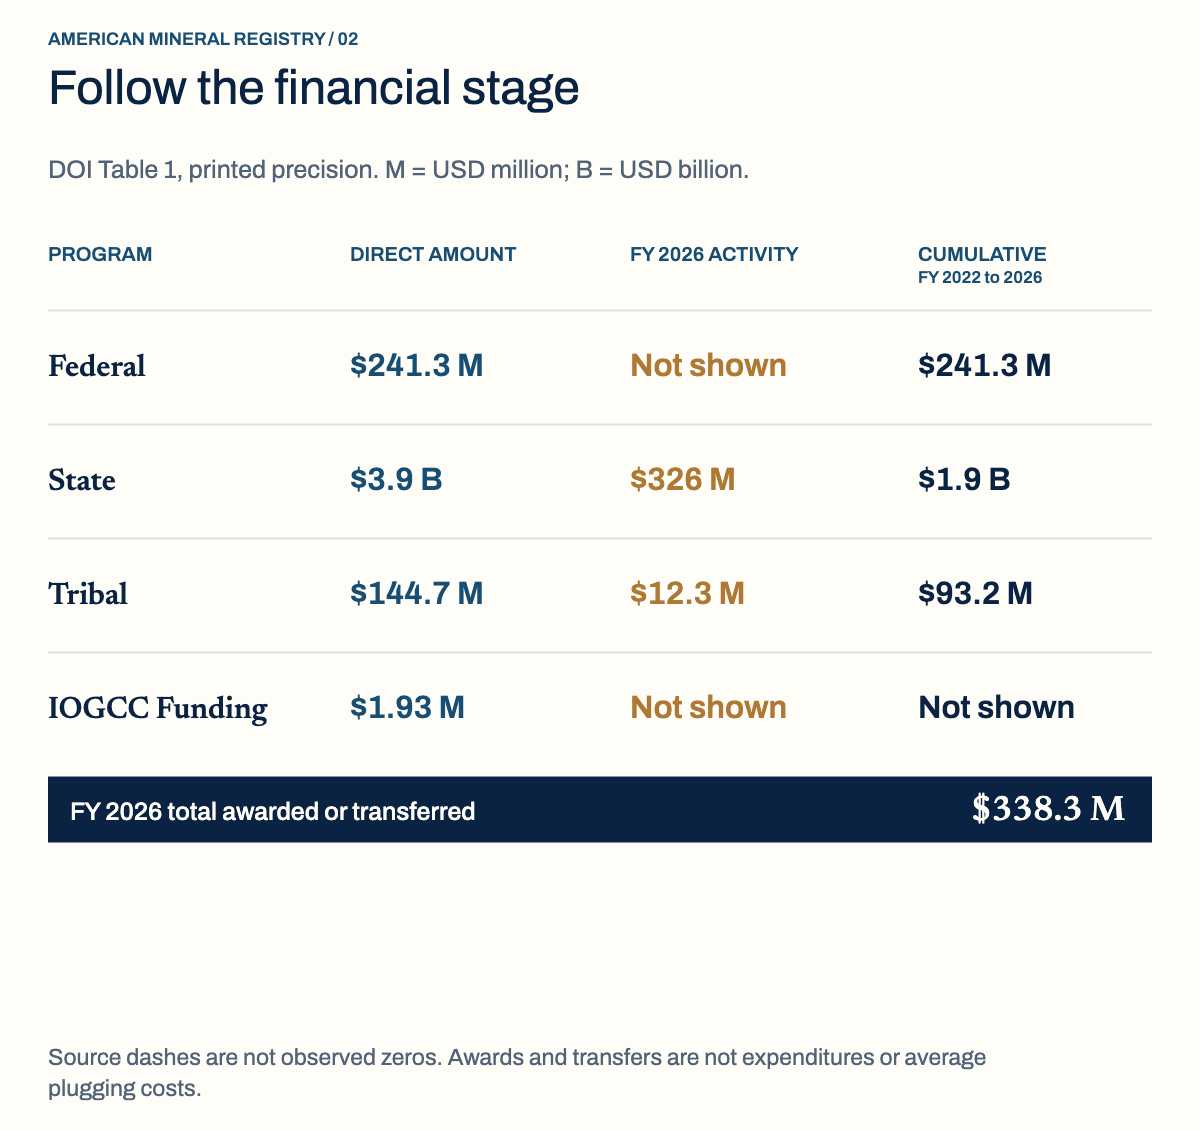
Figure 2 in text
Funding has separate financial stages Four program rows preserve the printed direct amounts and annual transfers or awards, without exact net calculations from rounded values.
AMERICAN MINERAL REGISTRY / 02 Follow the financial stage DOI Table 1, printed precision. M = USD million; B = USD billion.
PROGRAM
DIRECT AMOUNT
FY 2026 ACTIVITY
CUMULATIVE
FY 2022 to 2026
Federal
$241.3 M
Not shown
$241.3 M
State
$3.9 B
$326 M
$1.9 B
Tribal
$144.7 M
$12.3 M
$93.2 M
IOGCC Funding
$1.93 M
Not shown
Not shown FY 2026 total awarded or transferred
$338.3 M Source dashes are not observed zeros. Awards and transfers are not expenditures or average plugging costs.
Additional phone figure text: Federal Program · Direct program amount · FY 2026 awards / transfers · Cumulative FY 2022 to 2026 · State Program · Tribal Program
Source and data: DOI, FY 2026 Table 1
Permanent link to this figure’s text and data · Sources and context
What is the difference between the original allocation and direct program funding?
The original allocation is the starting authority. Direct program amounts reflect the report's deductions. Neither is the same measure as actual expenditure by a recipient on a completed well.
DOI lists original amounts of $250 million for the Federal Program, $4.275 billion for the State Program and $150 million for the Tribal Program, alongside $2 million for IOGCC consultation and coordination. These components total $4.677 billion. The report separately describes a required $285 million transfer to the Wildland Fire Program, reducing that original total to $4.392 billion before considering the other administrative and oversight deductions shown in its funding table. (DOI, FY 2026 report, Nov 2026).
Table 1 groups administrative, Office of Inspector General and wildfire amounts in one deduction column. It prints a $449.1 million overall deduction and approximately $4.3 billion in total direct program amounts. The State Program row uses rounded billion figures. These are the report's displayed values, not exact inputs from which an undisclosed remaining balance can be reconstructed. (DOI, FY 2026 report, Nov 2026).
The complete transcription below retains the source's mixed million and billion precision. M means million U.S. dollars and B means billion U.S. dollars. Not shown preserves the original dash; it does not state that the program has never spent or received money. Each column follows Table 1's own accounting label and period. (DOI, FY 2026 report, Nov 2026).
| Program | OMB apportioned | Admin, OIG and wildfire | Direct program amount | FY 2026 awards or transfers | Cumulative FY 2022 through FY 2026 |
|---|---|---|---|---|---|
| Federal Program | $250 M | $8.7 M | $241.3 M | Not shown | $241.3 M |
| State Program | $4.3 B | $435 M | $3.9 B | $326 M | $1.9 B |
| Tribal Program | $150 M | $5.3 M | $144.7 M | $12.3 M | $93.2 M |
| IOGCC Funding | $2 M | $0.07 M | $1.93 M | Not shown | Not shown |
| Totals | $4.7 B | $449.1 M | $4.3 B | $338.3 M | $2.2 B |
How much was awarded or transferred during FY 2026?
Annual activity is the money assigned or moved in that fiscal year, while cumulative activity includes earlier fiscal years. The words awarded and transferred also identify different administrative mechanisms.
Table 1 reports $326 million for the State Program and $12.3 million for the Tribal Program during FY 2026, giving its printed annual total of $338.3 million. The Federal and IOGCC annual cells contain dashes. DOI explains separately that all Federal Program funds had already been transferred to federal entities by FY 2025. (DOI, FY 2026 report, Nov 2026).
For cumulative FY 2022 through FY 2026 distributions, Table 1 shows $241.3 million federal, approximately $1.9 billion state and $93.2 million Tribal, with a rounded overall $2.2 billion total. Adding those differently rounded program displays gives $2.2345 billion; that display calculation is not a more precise official total. The report's adjacent narrative uses approximately $2.21 billion. These presentations should remain attributed and approximate. (DOI, FY 2026 report, Nov 2026).
The exact state recipient table provides a more precise answer for state awards alone. It does not replace the federal or Tribal figures and does not establish an exact combined cash expenditure. For reporting about annual program activity, quote the $338.3 million annual measure with its fiscal period rather than borrowing a cumulative total from another column. (DOI, FY 2026 report, Nov 2026).
Can awarded funding be divided by plugged wells to estimate cleanup cost?
That division combines different accounting stages and dates. It would be a ratio of broad program authority or awards to reported output, rather than a verified mean of paid well plugging invoices.
Recipients may use funds to identify and characterize undocumented wells, plug wells, remediate sites and adjacent land, or remove associated pipelines and infrastructure. The funded work therefore extends beyond the physical plugging event counted in a completed well total. DOI's State Program award table ends September 30, 2026, while its national plugging callout ends June 30, 2026. (DOI, FY 2026 report, Nov 2026).
A meaningful cost comparison would need a defined project cohort, actual eligible expenditures, treatment of shared mobilization and administrative costs, and the work completed within the same window. Offshore work and land based work may involve different access and engineering requirements. None of those distinctions is solved by using a larger national denominator. The tables here support financial accountability questions without presenting an unsupported average cost.
Which states received orphan well grants, and in what form?
The complete state comparison is a cumulative award ledger for every recipient in DOI's table. It supports exact grant composition and funding concentration calculations. It does not rank states by cleanup effectiveness, environmental need or contractor efficiency.

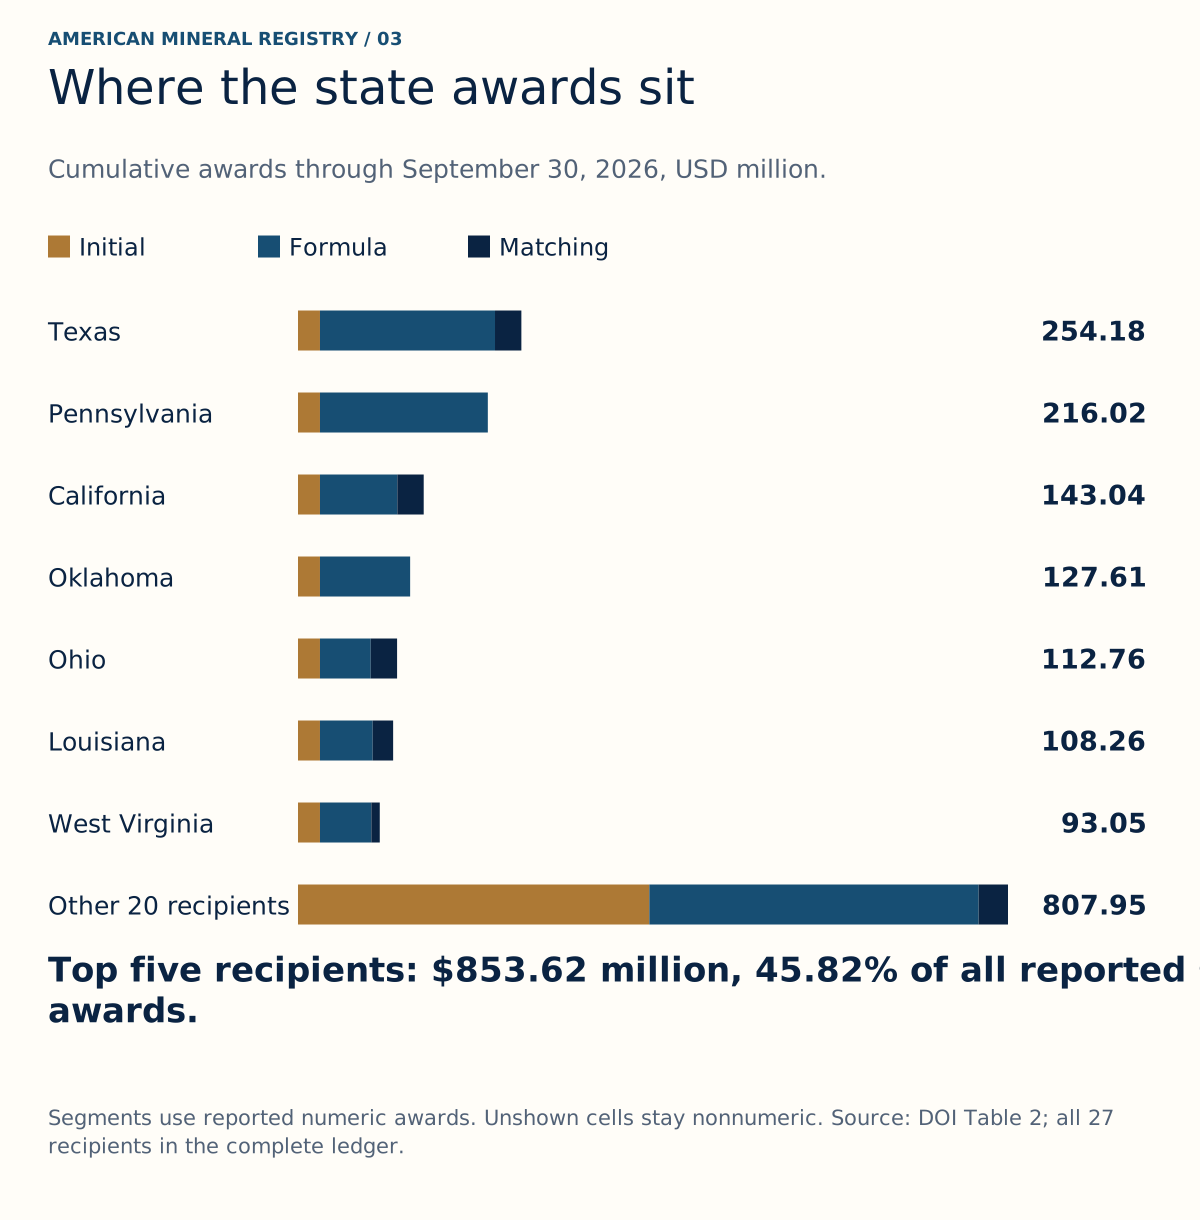
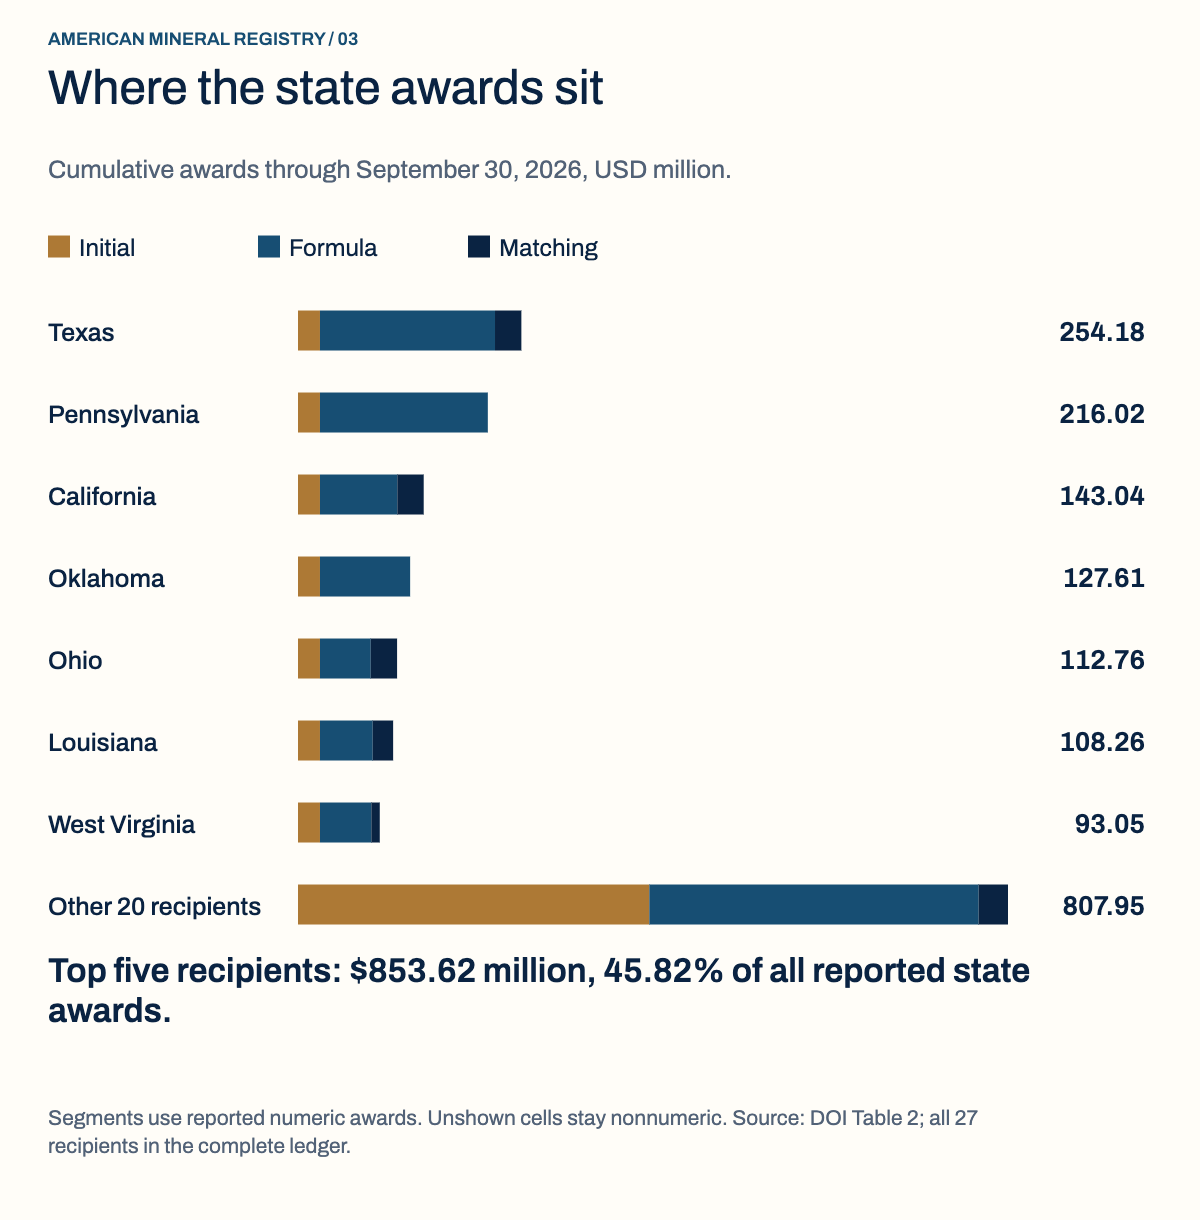
Figure 3 in text
State awards by grant type Complete funding represented by seven largest recipients and all other 20 combined; full27state table in HTML and CSV.
AMERICAN MINERAL REGISTRY / 03 Where the state awards sit Cumulative awards through September 30, 2026, USD million. Initial Formula Matching Texas
254.18 Pennsylvania
216.02 California
143.04 Oklahoma
127.61 Ohio
112.76 Louisiana
108.26 West Virginia
93.05 Other 20 recipients
807.95
Top five recipients: $853.62 million, 45.82% of all reported state
awards. Segments use reported numeric awards. Unshown cells stay nonnumeric. Source: DOI Table 2; all 27 recipients in the complete ledger.
Source and data: DOI, Table 2, pp13 and 14
Permanent link to this figure’s text and data · Sources and context
What do all 27 state recipient rows show?
They show how much DOI had awarded through each grant mechanism by the stated cutoff. Every total is reproduced in dollars so the national comparison can be checked without inferring precision from a rounded billion dollar headline.
Across all 27 listed recipients, cumulative State Program awards total $1,862,875,009 through September 30, 2026. The sum consists of $574,806,743 in Initial Grants, $1,131,801,208 in Formula Grants and $156,267,058 in Matching Grants. American Mineral Registry checked every row total and all column totals against DOI's published table. (DOI, FY 2026 report, Nov 2026).
The following table is the complete source supported recipient comparison, not a selection of large awards. Not shown preserves a printed dash. Utah's two empty cells remain identified as blank in source. Those markers are excluded from summing the reported amounts and never become invented observations about spending or grant eligibility. (DOI, FY 2026 report, Nov 2026).
| State recipient | Initial, USD | Formula, USD | Matching, USD | Total awarded, USD |
|---|---|---|---|---|
| Alabama | $5,000,000 | $1,681,430 | Not shown | $6,681,430 |
| Alaska | $25,000,000 | $28,336,497 | Not shown | $53,336,497 |
| Arizona | $25,000,000 | $4,871,791 | Not shown | $29,871,791 |
| Arkansas | $5,000,000 | $5,589,721 | Not shown | $10,589,721 |
| California | $25,000,000 | $88,044,069 | $30,000,000 | $143,044,069 |
| Colorado | $25,000,000 | $54,064,506 | $10,841,527 | $89,906,033 |
| Florida | $25,000,000 | Not shown | Not shown | $25,000,000 |
| Illinois | $25,000,000 | $25,000,000 | Not shown | $50,000,000 |
| Indiana | $25,000,000 | $14,076,668 | Not shown | $39,076,668 |
| Kansas | $25,000,000 | $33,600,000 | Not shown | $58,600,000 |
| Kentucky | $25,000,000 | $60,000,000 | Not shown | $85,000,000 |
| Louisiana | $25,000,000 | $60,000,000 | $23,263,107 | $108,263,107 |
| Michigan | $25,000,000 | $5,873,295 | $15,000,000 | $45,873,295 |
| Mississippi | $5,000,000 | $6,830,345 | $2,077,801 | $13,908,146 |
| Missouri | $4,806,743 | $5,123,494 | Not shown | $9,930,237 |
| Montana | $25,000,000 | Not shown | Not shown | $25,000,000 |
| Nebraska | $25,000,000 | Not shown | Not shown | $25,000,000 |
| New Mexico | $25,000,000 | $60,000,000 | $5,500,000 | $90,500,000 |
| New York | $25,000,000 | $44,672,162 | Not shown | $69,672,162 |
| North Dakota | $25,000,000 | $25,000,000 | Not shown | $50,000,000 |
| Ohio | $25,000,000 | $57,757,052 | $30,000,000 | $112,757,052 |
| Oklahoma | $25,000,000 | $102,613,486 | Not shown | $127,613,486 |
| Pennsylvania | $25,000,000 | $191,016,185 | Not shown | $216,016,185 |
| Texas | $25,000,000 | $199,184,393 | $30,000,000 | $254,184,393 |
| Utah | $5,000,000 | Blank in source | Blank in source | $5,000,000 |
| West Virginia | $25,000,000 | $58,466,114 | $9,584,623 | $93,050,737 |
| Wyoming | $25,000,000 | Not shown | Not shown | $25,000,000 |
| All 27 recipients | $574,806,743 | $1,131,801,208 | $156,267,058 | $1,862,875,009 |
Missouri's Initial Grant is printed as $4,806,743, not $5 million. Keeping that amount explains why the exact Initial Grant column totals $574,806,743 even though the report's narrative rounds initial support to $575 million. Rounding every recipient first would erase a real difference in the source table. (DOI, FY 2026 report, Nov 2026).
How do Initial, Formula and Matching Grants differ?
The mechanisms serve distinct program functions. Initial awards helped establish capacity, Formula awards scale support across eligible recipients, and Matching awards encourage additional state investment under the program's performance authority.
Using the exact reported dollar totals, Formula Grants represent 60.76% of cumulative state awards, Initial Grants 30.86% and Matching Grants 8.39%. The percentages are American Mineral Registry calculations using the same $1,862,875,009 denominator. Their displayed two decimal values sum to 100.01% because each is rounded independently. (DOI, FY 2026 report, Nov 2026).
DOI describes Initial Grants as support for staffing, mobilization and new plugging operations. Formula Grants use a statutory allocation mechanism and multiple phases. Matching eligibility relates to state investment above a historical annual funding baseline, subject to program limits. An award type therefore conveys something about the mechanism, not a uniform amount of work purchased. (DOI, FY 2026 report, Nov 2026).
The reported Formula total includes awards from more than one phase. Treating every Formula dollar as an FY 2026 award would confuse a cumulative grant category with the annual funding column in Table 1. The accompanying download keeps both the type and cutoff attached to each value.
Which recipients account for the largest share of awarded funds?
A funding concentration calculation is useful for understanding where the reported award authority sits. Its denominator is the complete award table, not a count of documented wells or a sample of completed projects.
Texas reports $254,184,393 in cumulative awards, followed by Pennsylvania at $216,016,185, California at $143,044,069, Oklahoma at $127,613,486 and Ohio at $112,757,052. Together those five recipients account for $853,615,185, or 45.82% of all reported State Program awards through September 30, 2026. (DOI, FY 2026 report, Nov 2026).
The displayed figure retains the seven largest individual recipients and combines all remaining recipients into an explicitly labeled group. The full table and CSV preserve every state row and component. A reader can reproduce the concentration calculation, choose another defined group, or examine grant composition without losing the smaller recipients.
Higher awards alone do not demonstrate slower cleanup, greater contamination, higher costs or preferential treatment. Such claims would need the allocation rules, project scope, actual expenditure and comparable results. The current contribution is an accounting comparison, not an independent performance score.
How many orphan wells have actually been plugged?
The national report provides a precise cumulative output through June 2026, while other records use different cutoffs or scopes. A later publication date does not automatically make an earlier underlying dataset a current count.

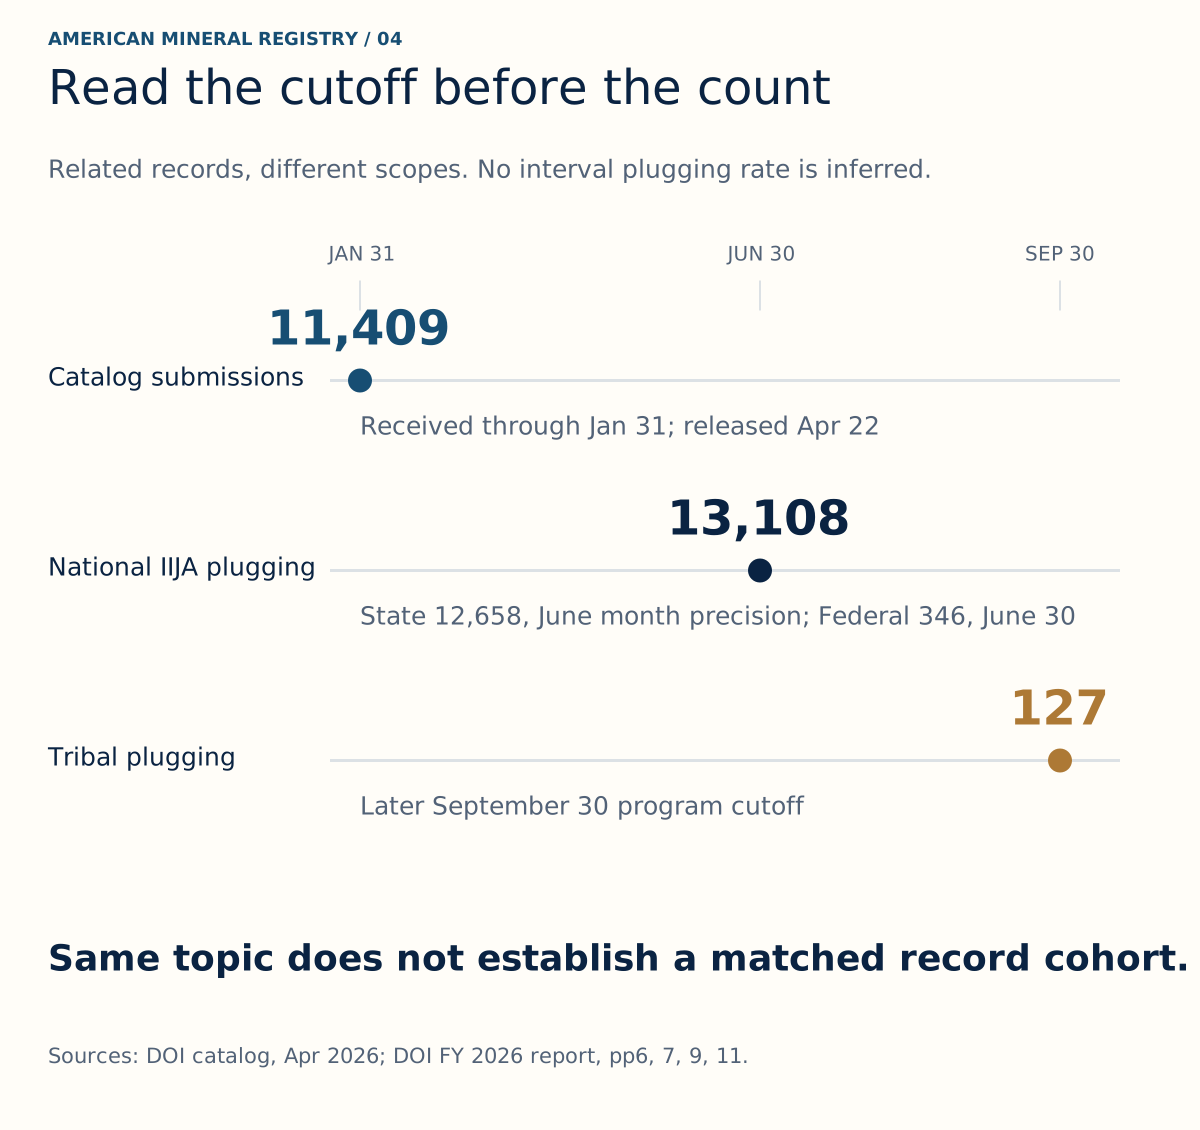
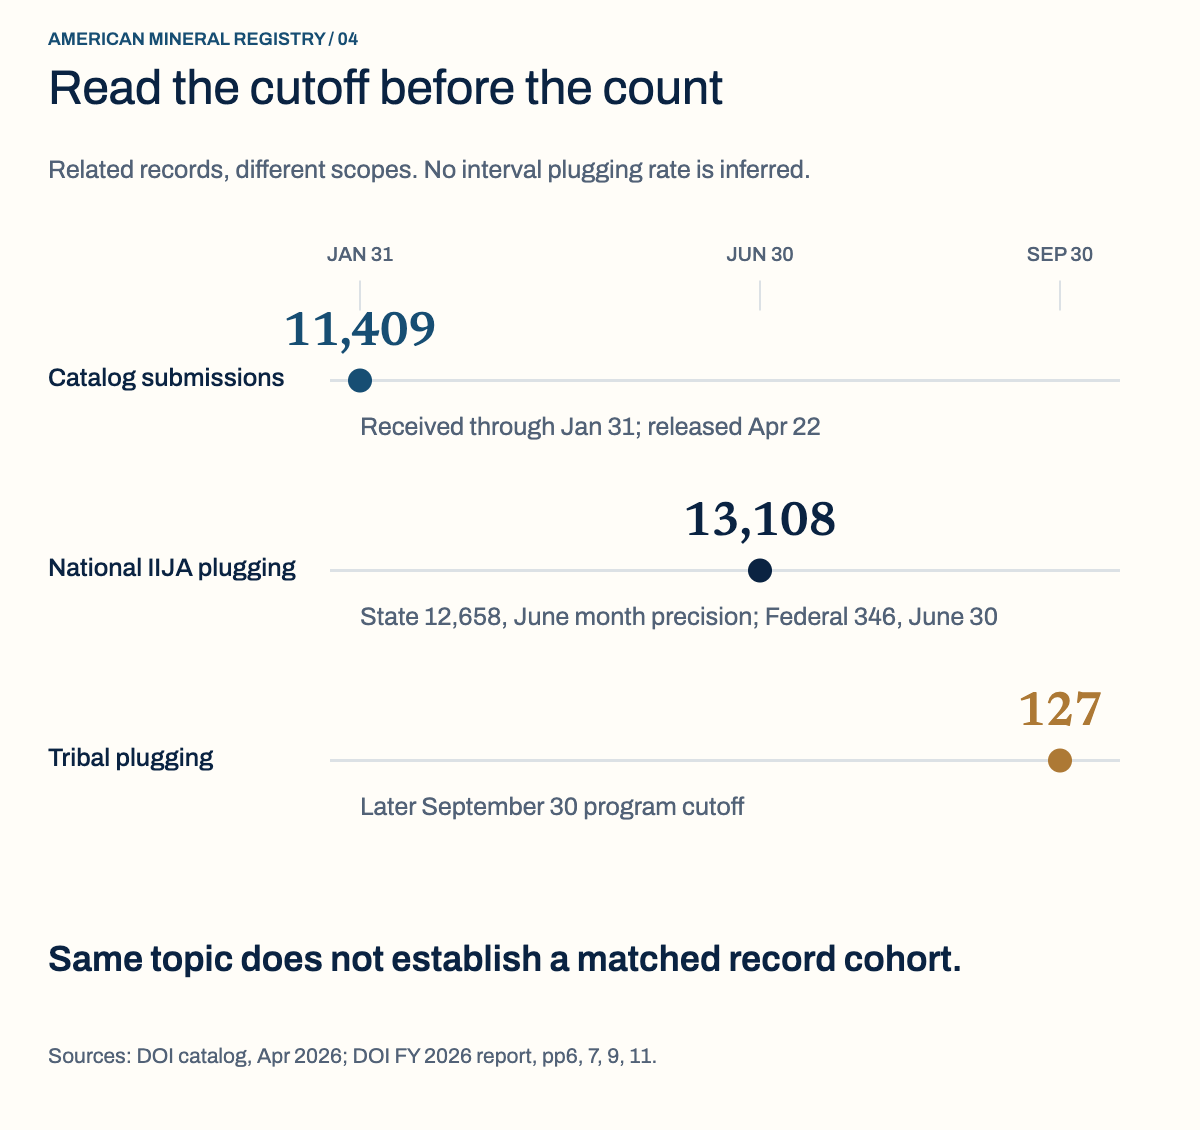
Figure 4 in text
Count the cutoff, not the upload date Three reporting windows distinguish January recipient submissions, June plugging totals and later September Tribal activity.
AMERICAN MINERAL REGISTRY / 04 Read the cutoff before the count Related records, different scopes. No interval plugging rate is inferred.
JAN 31
JUN 30
SEP 30 Catalog submissions
11,409 Received through Jan 31; released Apr 22 National IIJA plugging
13,108 State 12,658, June month precision; Federal 346, June 30 Tribal plugging
127 Later September 30 program cutoff
Same topic does not establish a matched record cohort. Sources: DOI catalog, Apr 2026; DOI FY 2026 report, pp6, 7, 9, 11.
Additional phone figure text: 31 JANUARY 2026 · Catalog records · Submissions received; released April 22, · 2026. Total record set not matched to · later report. · 30 JUNE 2026 · National IIJA wells plugged · State: 12,658 through June 2026, month · precision. Federal: 346 through June 30. · Report posted November 2026. · 30 SEPTEMBER 2026 · Tribal Program wells plugged · Later program cutoff. Do not add to · June counts.
Source and data: DOI, FY 2026 report, pp6, 7, 9, 11 · DOI catalog description
Permanent link to this figure’s text and data · Sources and context
What does the national 13,108 figure establish?
It establishes a reported infrastructure funded plugging output through the report's cutoff. It does not count every well plugged by every operator or state using any source of funds.
The report's page 6 callout states 13,108 orphaned wells plugged nationwide with IIJA funds through June 30, 2026. Page 16 describes the same broad progress as over 13,000 wells. These are different levels of presentation precision within the same annual report, rather than evidence of two separate national cohorts. (DOI, FY 2026 report, Nov 2026).
The State Program reports 12,658 wells plugged through June 2026, and the Federal Program reports 346 through June 30, 2026. The Tribal Program separately reports 127 through September 30, 2026. The later Tribal count must not be added to the June state and federal values and labeled a June national total. (DOI, FY 2026 report, Nov 2026).
Nor should a national inventory denominator be attached to those cumulative outputs to claim a completion percentage. The inventory is a changing stock of qualifying known unplugged records. Plugging is a flow across a funded program cohort. A proportion would need an identified common cohort and consistent start and end dates.
Why does the public plugged well dataset contain 11,409 records?
The catalog explicitly limits the dataset to submissions received by January 31, 2026. Its publication and modification labels do not extend that underlying reporting window into April or November.
DOI's catalog describes 11,409 plugged orphaned wells submitted by infrastructure funding recipients, including federal entities, states and federally recognized Tribes. The release date is April 22, 2026, but the description says the data reflect reporting submissions received through January 31, 2026. Records are as reported by the recipients. (DOI, plugged well dataset, Apr 2026).
Its fields include a well identifier, name, type, coordinates, funding recipient, funding type and plugging witness date. Those fields make the dataset useful for a defined record level investigation. They do not establish that every record was submitted immediately after work or that the dataset was later reconciled against each annual report count. (DOI, plugged well dataset, Apr 2026).
Subtracting the catalog count from the annual report figure would produce a numerical difference between publications. It would not, without matching records and reporting rules, establish the number of wells physically plugged during the interval. This reference therefore presents both snapshots with their dates and avoids an unsupported acceleration claim.
What can be compared over time without a matched cohort?
Source descriptions and their scope can be compared honestly. A national rate of new plugging, backlog reduction or program completion needs more detailed matching than these summary figures provide.
The report's inventory discussion also distinguishes documented wells from wells requiring further research or field verification. Funding can improve that documentation. Finding a previously unrecorded well can increase a list at the same time that plugging reduces the number of known unplugged wells. This is why a rising inventory and substantial plugging can coexist. (DOI, FY 2026 report, Nov 2026).
The current tables preserve count, program, reporting measure and cutoff together. That allows a writer to quote a specific observation or explain why two headlines differ. It does not manufacture a historical panel by treating publication years as interchangeable measurement years. Additional record matching could support a future study, but it is not presented as a completed result here.
How do the federal and Tribal programs operate differently?
The federal program distributes money to federal entities for projects on federal lands and waters. Tribal support includes development, implementation and an alternative in which Interior administers work. The distinction matters when comparing recipients, commitments, targets and completed outcomes.

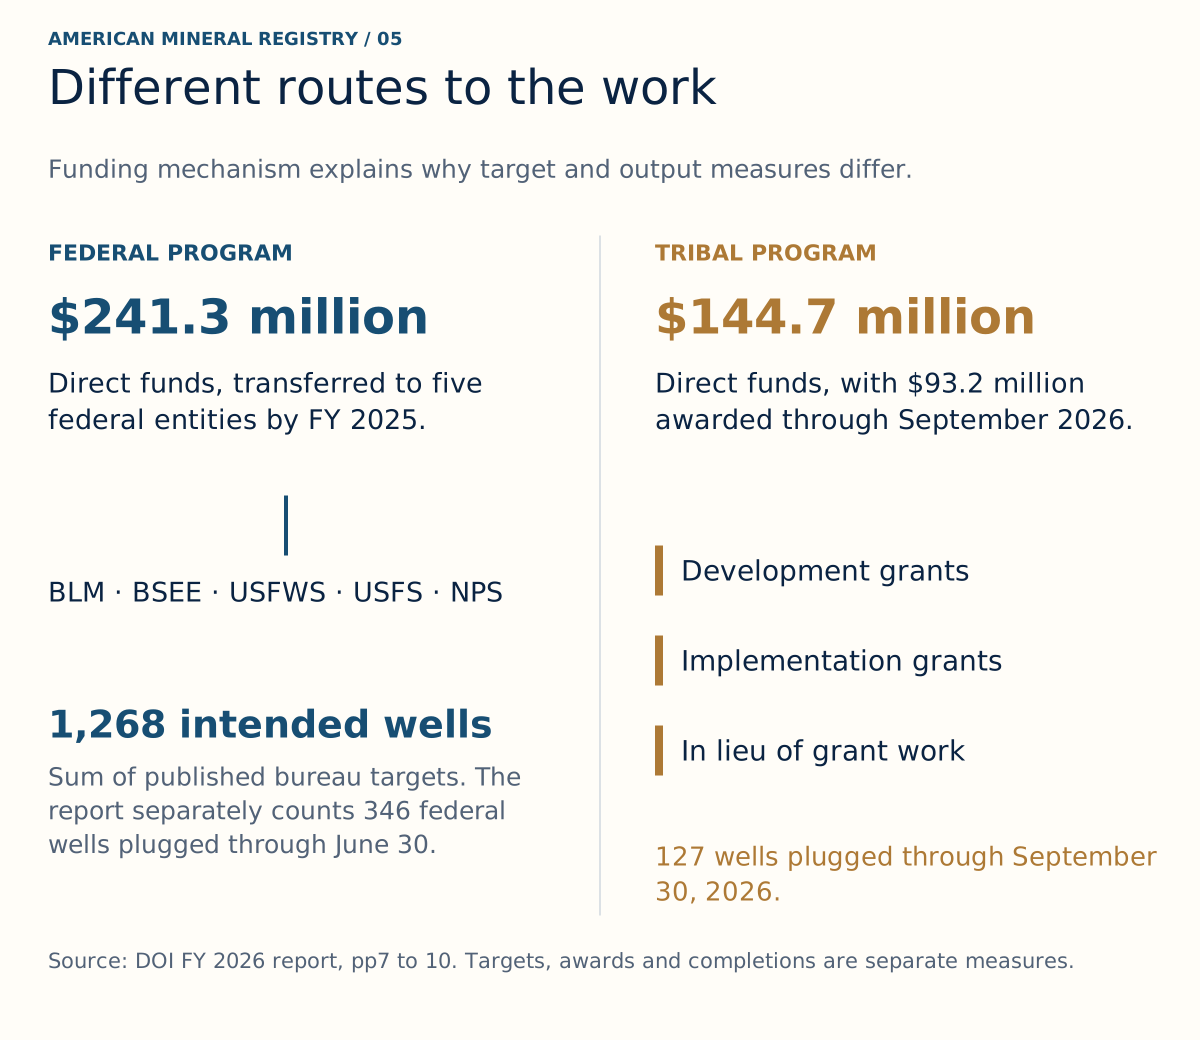
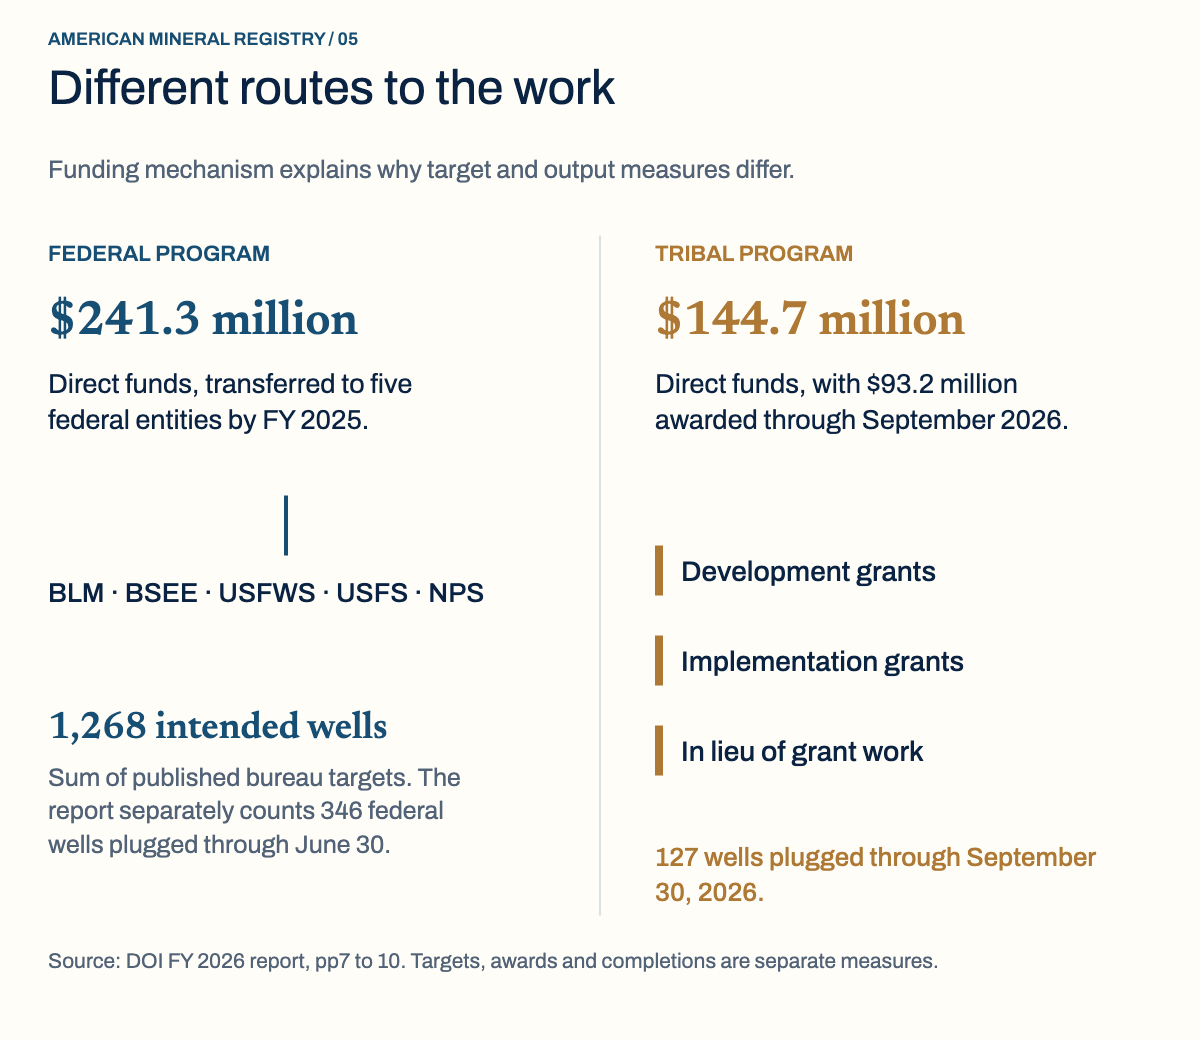
Figure 5 in text
Federal and Tribal implementation mechanisms Federal transfers to five entities contrast with Tribal development, implementation and in lieu of grant routes. Funding, targets and outcomes stay distinct.
Read the complete diagram text
AMERICAN MINERAL REGISTRY / 05 Different routes to the work Funding mechanism explains why target and output measures differ.
FEDERAL PROGRAM
$241.3 million
TRIBAL PROGRAM
$144.7 million Direct funds, transferred to five federal entities by FY 2025.
BLM · BSEE · USFWS · USFS · NPS
1,268 intended wells Sum of published bureau targets. The report separately counts 346 federal wells plugged through June 30. Direct funds, with $93.2 million awarded through September 2026. Development grants Implementation grants In lieu of grant work 127 wells plugged through September 30, 2026. Source: DOI FY 2026 report, pp7 to 10. Targets, awards and completions are separate measures.
Additional phone figure text: Direct funds, all transferred by FY · Five implementing entities · Sum of published targets, not completed · wells. · Direct funding; $93.2 million awarded · Development support · Interior administered work
Source and data: DOI, FY 2026 report, pp7 to 10
Permanent link to this figure’s text and data · Sources and context
What do the five federal recipient allocations describe?
They describe rounded funding assigned to federal entities and wells intended for plugging. They are useful project planning figures, but the associated target counts are not the federal completed output.
DOI reports $241.3 million in direct Federal Program funding after its deductions and says all federal funds had been transferred by FY 2025. It then lists five recipient amounts with intended well counts. Their intended counts sum to 1,268, a calculation from the published recipient descriptions rather than an observed plugging total. (DOI, FY 2026 report, Nov 2026).
| Federal recipient, source label | Funding, USD million | Intended wells |
|---|---|---|
| Bureau of Land Management | 35 | 123 |
| Bureau of Safety and Environmental Enforcement | 46 | 30 |
| U.S. Fish and Wildlife Service | 64 | 564 |
| U.S. Forest Service | 58 | 436 |
| National Park Service | 39 | 115 |
The five rounded recipient amounts add to $242 million, $0.7 million above the $241.3 million direct program amount. Each recipient amount is printed in whole millions. The comparison preserves those source displays and the precision limitation; it does not invent a sixth allocation or amend any recipient amount. (DOI, FY 2026 report, Nov 2026).
The report also discusses revised priorities and additional planned work. Plans can change through procurement, project design and savings. Comparing the original target sum directly with completed wells as a national completion rate would require checking the target cohort and revisions first.
What does the Tribal award map show?
It shows named award labels through September 2026 at rounded million dollar precision. Keeping those labels in a separate table avoids combining map estimates of award size with exact state dollar amounts as if they shared precision.
The Tribal Program had $150 million in original funding and $144.7 million in direct funding after the report's administrative and oversight deductions. DOI reports $93.2 million awarded through September 2026, supporting 18 Tribes and administered work arrangements. Development support, implementation support and in lieu of grant arrangements serve different operational needs. (DOI, FY 2026 report, Nov 2026).
The following reproduces every label on Figure 4. Names follow the source, including its Wind River project label. The table is an award transcription, not a list of legal entities researched independently and not evidence of money already spent. (DOI, FY 2026 report, Nov 2026).
| Published Tribal or project label | Award label, USD million |
|---|---|
| Chippewa Cree Tribe | 3.01 |
| Fort Peck Assiniboine and Sioux | 2.34 |
| Crow Nation | 1.76 |
| Fort Belknap Indian Community | 3.23 |
| Wind River | 1.73 |
| Ute Indian Tribe | 6.20 |
| Ponca Tribe | 3.32 |
| Otoe-Missouria Tribe | 4.64 |
| Seneca Nation of Indians | 2.50 |
| Southern Ute Indian Tribe | 0.50 |
| Jicarilla Apache Nation | 3.16 |
| Osage Nation | 30.16 |
| Muscogee Creek Nation | 3.62 |
| Navajo Nation | 9.95 |
| Caddo Tribe | 3.71 |
| Comanche Nation | 6.94 |
| Kiowa Tribe | 5.74 |
| Chickasaw Nation | 0.59 |
These map labels sum to $93.10 million, while the narrative and national program table report $93.2 million. The reason for that printed difference is unresolved in the reviewed source. American Mineral Registry preserves both and uses the explicitly attributed program total when describing overall reported awards. (DOI, FY 2026 report, Nov 2026).
How does administered Tribal work differ from a grant?
In lieu of grant arrangements allow a Tribe to ask Interior to administer eligible plugging, remediation and reclamation work. That mechanism differs from treating every program dollar as a grant deposited with a recipient.
DOI describes Development Grants for identification, eligibility work, assessment, training and capacity. Implementation Grants can also support plugging and remediation. The in lieu of grant route provides another way to conduct eligible work on a Tribe's behalf. Those uses explain why a grant count, an award amount and a plugged well count cannot be assumed to move together. (DOI, FY 2026 report, Nov 2026).
The report says Tribal recipients plugged 127 wells through September 30, 2026, while other wells were identified for future work or under eligibility assessment. Assessment and identification are program activities, but they do not establish completed plugging. A pipeline of potential work should therefore remain separate from reported output. (DOI, FY 2026 report, Nov 2026).
What does plugging demonstrate, and how should the figures be quoted?
Plugging, remediation and restored land measure different stages of cleanup. A reported plugged well is an important physical output, while broader environmental results and financial compliance need their own evidence. Accurate reuse keeps each quantity attached to its definition and cutoff.

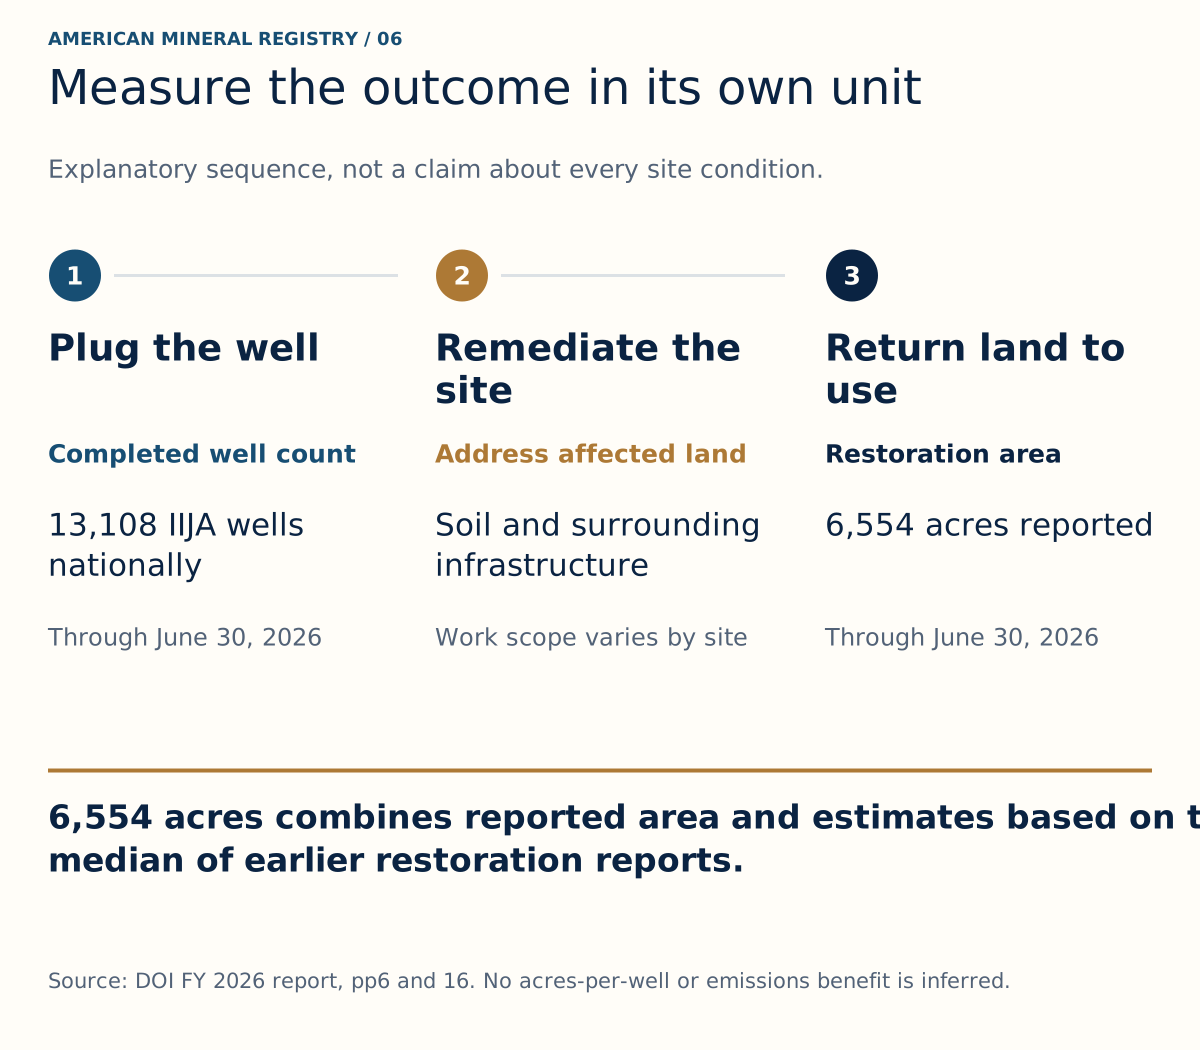
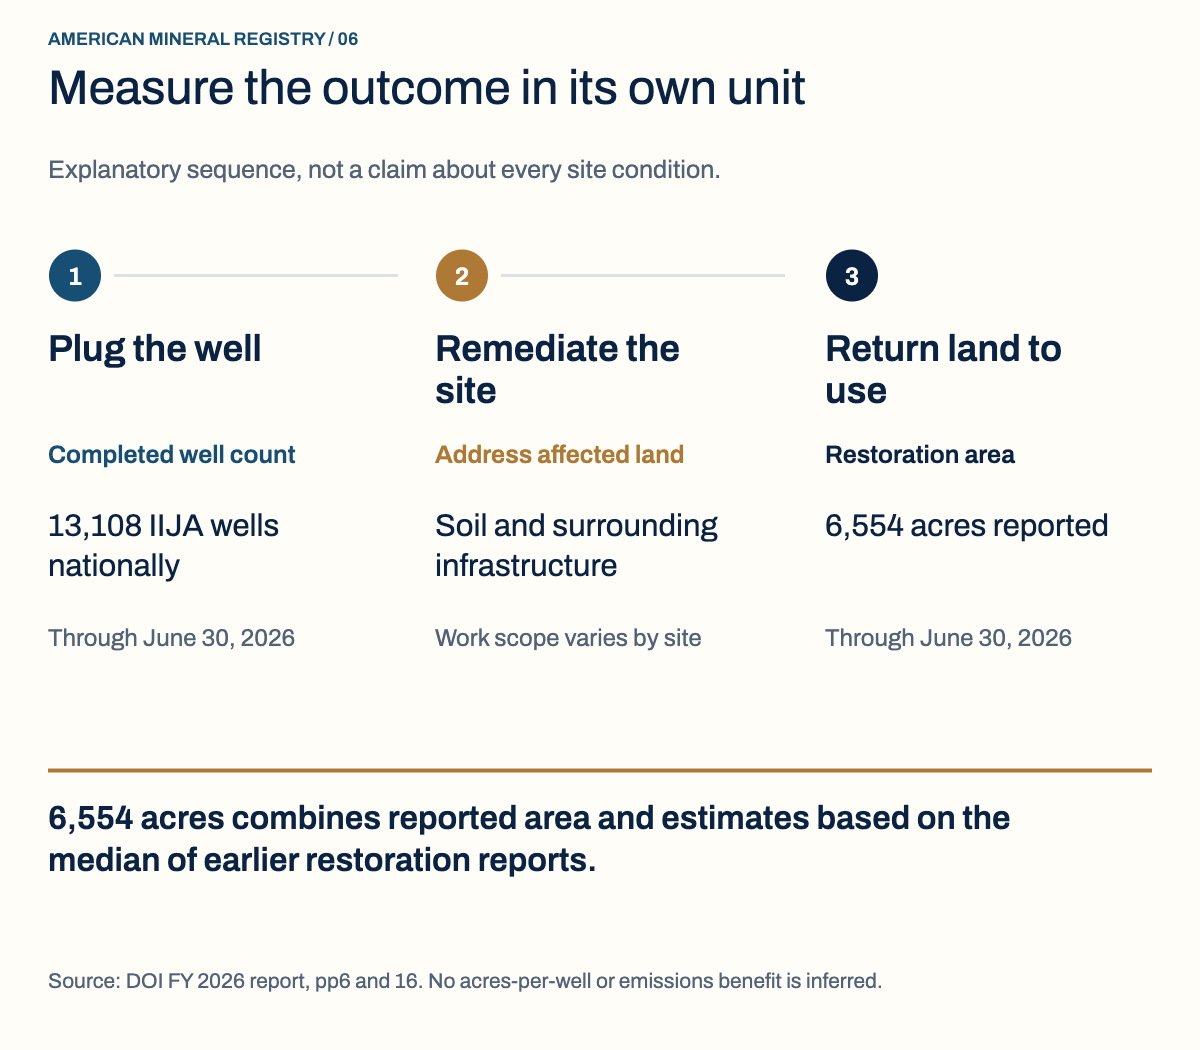
Figure 6 in text
A well count is different from restored acreage An explanatory cleanup sequence connects plugging, remediation and return to beneficial use.6,554 reported acres includes median based estimates where reports were absent.
Read the complete diagram text
AMERICAN MINERAL REGISTRY / 06 Measure the outcome in its own unit Explanatory sequence, not a claim about every site condition.
1
Plug the well
Completed well count 13,108 IIJA wells nationally Through June 30, 2026
2
Remediate the
site
Address affected land Soil and surrounding infrastructure Work scope varies by site
3
Return land to
use
Restoration area 6,554 acres reported Through June 30, 2026
6,554 acres combines reported area and estimates based on the
median of earlier restoration reports. Source: DOI FY 2026 report, pp6 and 16. No acres-per-well or emissions benefit is inferred.
Additional phone figure text: The acreage combines recipient · reporting with median based · estimates where area was missing.
Source and data: DOI, FY 2026 report, pp6 and 16
Permanent link to this figure’s text and data · Sources and context
Why is environmental context broader than a plugged well count?
Legacy wells can create subsurface pathways and site hazards, while surrounding land may need work after the well is sealed. The relevant environmental question depends on the pathway, condition and outcome being studied.
DOI describes risks including hydrocarbon or gas leakage, groundwater impacts, deteriorated infrastructure and interference with current or future land use. These are reasons for plugging and remediation programs, not proof that every documented well leaks or has contaminated drinking water. A national inventory cannot substitute for measurements at a particular property. (DOI, FY 2026 report, Nov 2026).
For habitat restoration, DOI reports 6,554 acres remediated and made available for beneficial use through June 30, 2026. It explains that recipients report restored area for most wells, and where that metric is absent OWPO estimates affected acreage using the median of previously reported restoration data. The reported area is therefore a combination of recipient observations and estimation. (DOI, FY 2026 report, Nov 2026).
Dividing the acres by a plugging total would mix site area and well outputs without showing which wells have complete restoration data or how shared sites are handled. The figure instead explains the different physical outcomes. This reference also excludes the annual report's unresolved methane and carbon equivalence figures; no emissions or passenger vehicle conversion is supplied.
Do award and output totals establish financial compliance?
They establish reported funding and activity, while compliance is a separate question involving eligibility, procurement, controls and the use of public money. High output alone cannot answer every audit question.
The DOI Inspector General's September 25, 2026 Oklahoma audit summary says the Oklahoma Corporation Commission did not fully comply with federal regulations and grant terms. That finding concerns the audit's own scope. It is not evidence that every state program failed, nor does a nationwide plugging count negate a specific compliance issue. (DOI Inspector General, Sep 2026).
For a defensible accountability story, distinguish an award from an obligation, actual expenditure and verified work. Attach the relevant audit or inspection evidence to any claim about compliance. This reference does not rate individual contractors, establish recoverable losses, or infer misuse from a rounded difference between summary tables.
The source reconciliation download records the report's mixed precision and known mismatches. An unresolved mismatch is a request for more evidence. It is not automatically an error in paid invoices or proof of additional cleanup capacity.
What wording preserves the meaning when these statistics are reused?
Name the program, financial or physical measure, unit and reporting cutoff in the sentence itself. Then link to the exact table or finding, so the qualification survives even if the surrounding article is shortened.
For plugging, a source supported sentence is: DOI reported 13,108 orphaned wells plugged with IIJA funds nationally through June 30, 2026. For state funding, the corresponding statement is: cumulative State Program awards to 27 listed recipients totaled $1,862,875,009 through September 30, 2026. These two sentences deliberately retain their different cutoffs and accounting measures. (DOI, FY 2026 report, Nov 2026).
For inventory, say the September 2026 USGS release description contains 130,121 documented unplugged wells in 28 states. For the plugged geodataset, say its 11,409 records reflect recipient submissions received through January 31, 2026, despite its April publication. Those descriptions identify the actual evidence window rather than the date a writer happened to open a page. (USGS, documented well database, Sep 2026) (DOI, plugged well dataset, Apr 2026).
American Mineral Registry's original contribution is the complete transcription, cross source accounting comparison and transparent calculations from those authorities. The specific finding links, CSV files and methodology allow outside writers to check and attribute that compilation while still crediting DOI and USGS for the underlying records. For further statistical definitions, see the mineral rights and royalty statistics reference.
Methodology and Sources
American Mineral Registry pinned DOI's FY 2026 annual report, reviewed its program and inventory sections, and visually checked the national funding table, complete state table and Tribal map. The current USGS description and DOI catalog were retrieved separately. The offline analysis checks each state's numeric cells against extracted PDF text, every row and column total, Decimal based shares, recipient coverage and source hashes. Source dashes and Utah's blanks remain nonnumeric. All analytical tables retain units, dates, definitions and locators. Original awards, observed or reported outputs, targets and AMR calculations remain distinct. No undocumented national total, cleanup completion rate, average plugging cost, inferred emissions benefit or unmatched historical performance series is calculated. Source discrepancies are preserved for reproduction rather than silently repaired.
Glossary
- Orphaned well: A well within the applicable program or state definition for which a responsible operator is absent or cannot perform required closure work.
- Documented inventory: Known qualifying well records compiled in an identified database edition.
- Unplugged well: A well that has not completed the plugging status required by the relevant record or program.
- IIJA: Infrastructure Investment and Jobs Act, the law supporting the federal orphaned wells funding described here.
- Apportioned amount: The funding authority displayed in DOI's OMB funding column, distinct from a recipient's actual expenditure.
- Award: Funding granted under a program mechanism, rather than evidence that all the money has been spent.
- Transfer: Funding moved to an implementing entity, as in the Federal Program's bureau allocations.
- In lieu of grant: An arrangement under which Interior administers eligible work on a Tribe's behalf.
- Remediation: Work addressing contamination or related site conditions, distinct from simply counting a plugged well.
- Reporting cutoff: The last date covered by the particular count, submission window or financial table.