Key takeaways
- Pecos County had 846 listed orphan wells in the Texas Railroad Commission’s October 2026 workbook. That was 6.8% of its 12,473 listed distinct API identifiers.
- The ten highest-count counties accounted for 34.3% of the October 2026 Texas list. Their 4,281 entries are measured against 12,473 statewide entries in the same workbook.
- 518 listed API records lacked at least one coordinate in the October 2026 Texas workbook. That is 4.2% of the listed API records. AMR used the workbook's county labels for aggregation, including those rows.

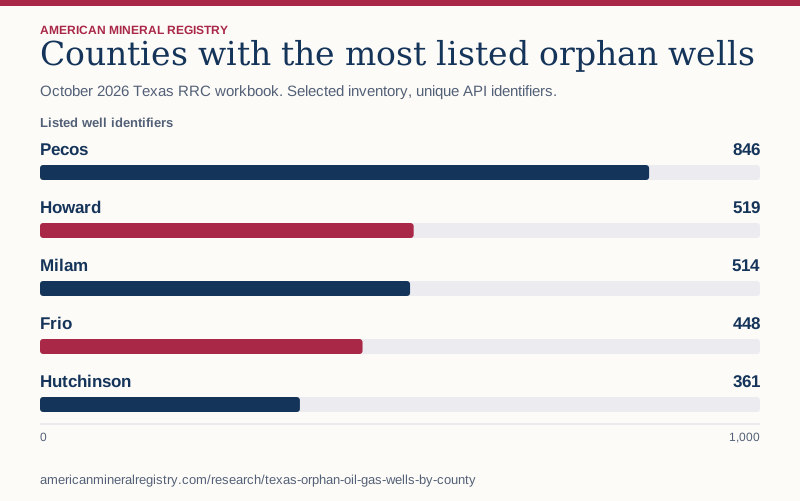
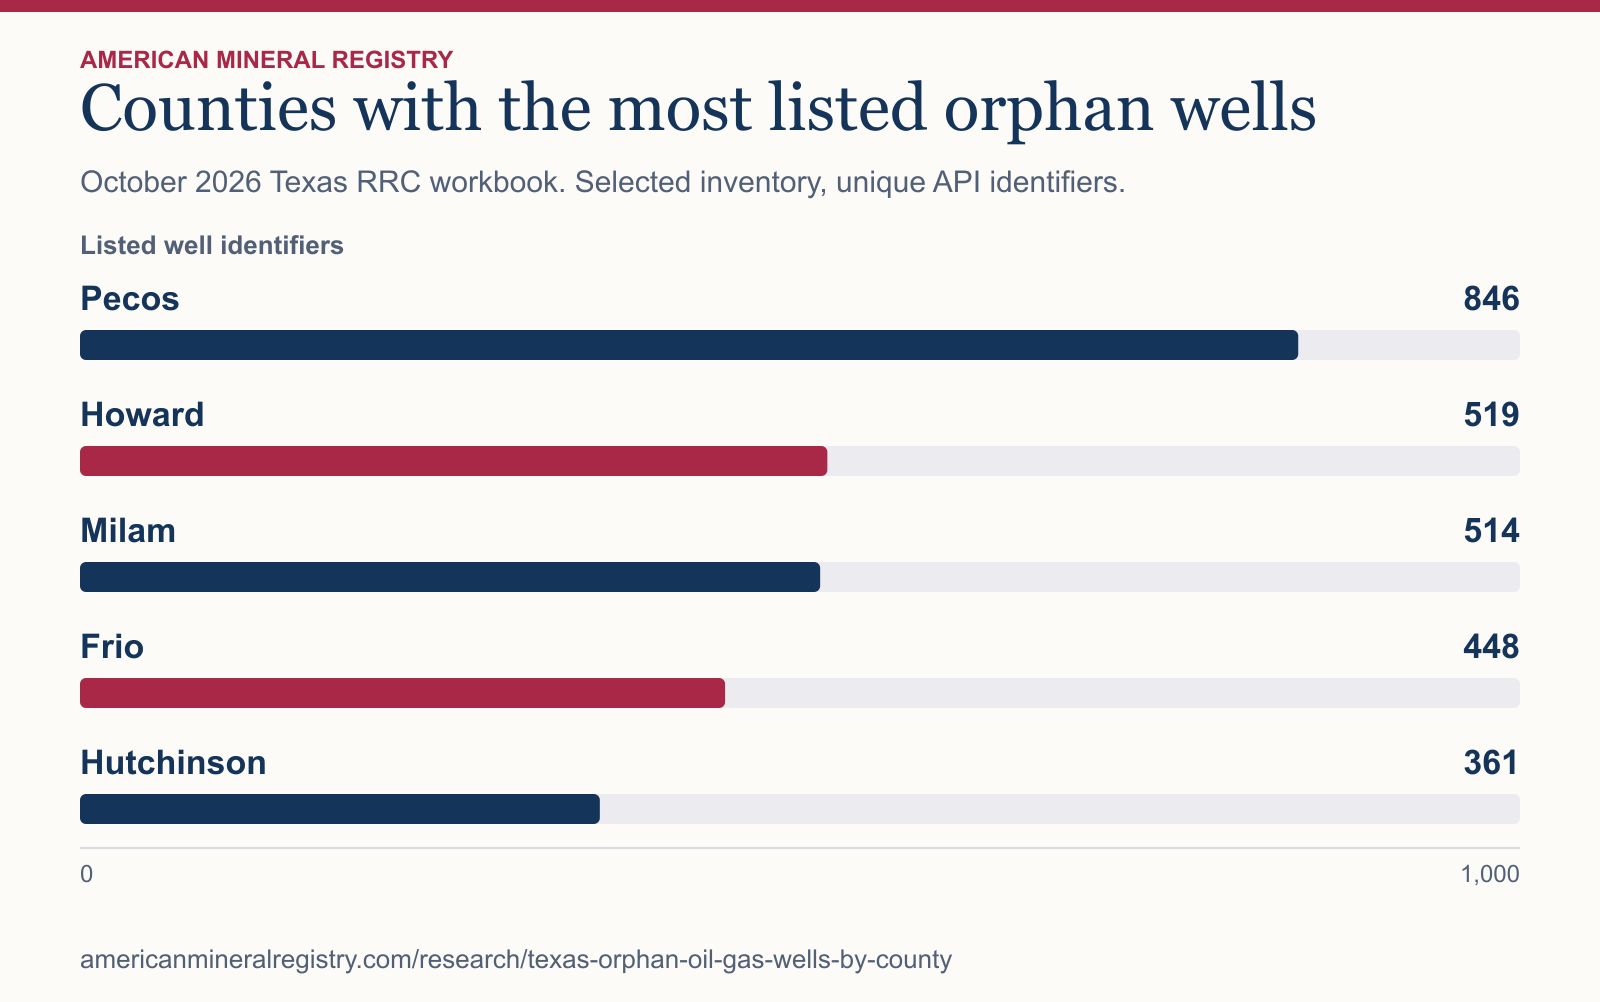
Figure 1 in text
October 2026 Texas RRC workbook. Selected inventory, unique API identifiers. Listed well identifiers.
| Category | Listed well identifiers |
|---|---|
| Pecos | 846 |
| Howard | 519 |
| Milam | 514 |
| Frio | 448 |
| Hutchinson | 361 |
Chart wording and scale
Counties with the most listed orphan wells October 2026 Texas RRC workbook. Selected inventory, unique API identifiers.
Listed well identifiers
Pecos
846
Howard
519
Milam
514
Frio
448
Hutchinson
361 0 1,000
Source and data: Download chart source data
Permanent link to this figure’s text and data · Sources and context
Which counties had the most entries?
The rank uses the number of API identifiers assigned to a county in the Commission’s workbook. See the download for all 210 county labels listed. It preserves the statewide denominator and rows missing coordinates for each county.
| County | Listed API records | Share of Texas list | Rows missing coordinates |
|---|---|---|---|
| Pecos | 846 | 6.8% | 17 |
| Howard | 519 | 4.2% | 3 |
| Milam | 514 | 4.1% | 45 |
| Frio | 448 | 3.6% | 9 |
| Hutchinson | 361 | 2.9% | 12 |
| Ward | 346 | 2.8% | 12 |
| Palo Pinto | 345 | 2.8% | 2 |
| Coleman | 301 | 2.4% | 42 |
| Shackelford | 301 | 2.4% | 10 |
| Crockett | 300 | 2.4% | 12 |
What does the Texas orphan-well list count?
The Commission describes this list as inactive, noncompliant wells that have been inactive at least 12 months and whose responsible operator’s Form P-5 has been delinquent for more than 12 months. Plugging status, responsibility, and dates can change between releases. Use the Commission’s well query for a specific site. For the separately defined national inventory, federal awards and reported plugging, use the orphan well inventory and funding comparison.
Does a larger county count mean a higher risk?
The table gives absolute counts, rather than rates among all wells in a county. It supplies no county denominator for well inventory or exposure. An unlisted county has no row in this download. Coordinate gaps also mean the workbook is unsuitable for placing every listed well on a map without further location verification. The USGS national inventory is a separate source with varying state definitions and location criteria, so its total is not the denominator for these percentages.
How did AMR reproduce the county numbers?
AMR counted the eight-digit API identifiers in the Public Orphan Well List worksheet, grouped by its county field, and checked all identifiers for duplicates. The downloaded worksheet had 12,473 distinct entries and 210 nonempty county labels. A row was flagged for a coordinate gap when latitude, longitude, or both were blank. For equal counts, the download displays counties alphabetically. The report month is tied to the Commission’s October workbook filename.
Sources and data
- Railroad Commission orphan-well criteria and query
- October 2026 Railroad Commission public orphan-well workbook ZIP
- USGS documented orphaned well database and national coverage definitions
Download the data (CSV) · Read the data dictionary. The AMR analysis and figures are licensed CC BY 4.0. Refer to the original issuers for their materials.