Key takeaways
- Ten counties supplied 69.4% of Texas crude oil in preliminary July 2026. They reported 84,280,198 barrels out of 121,422,846 statewide.
- Five counties supplied 50.3% of statewide crude in preliminary July 2026. The top five supplied 47.3% in preliminary July 2025. Four names appeared in both top-five groups.
- The same ten counties made both preliminary July top-ten lists. Martin, Midland, Upton, Loving, Reagan, Reeves, Andrews, Karnes, Glasscock and Howard appeared in the July 2025 and July 2026 lists. Their order changed.

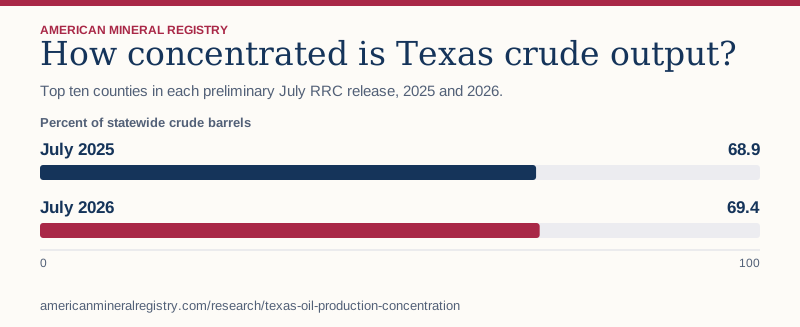
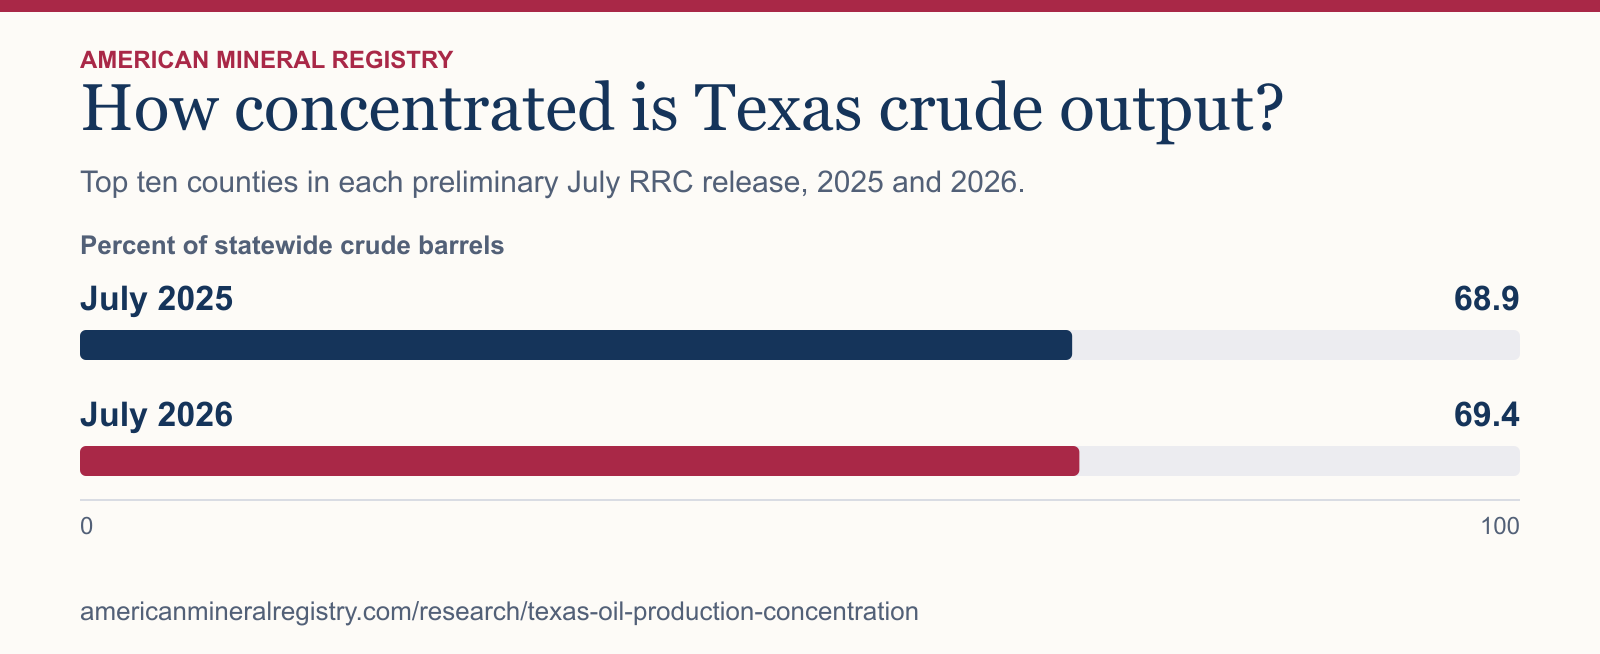
Figure 1 in text
Top ten counties in each preliminary July RRC release, 2025 and 2026. Percent of statewide crude barrels.
| Category | Percent of statewide crude barrels |
|---|---|
| July 2025 | 68.9 |
| July 2026 | 69.4 |
Chart wording and scale
How concentrated is Texas crude output? Top ten counties in each preliminary July RRC release, 2025 and 2026.
Percent of statewide crude barrels
July 2025
68.9
July 2026
69.4 0 100
Source and data: Download chart source data
Permanent link to this figure’s text and data · Sources and context
How much oil comes from the largest Texas counties?
Rank counties within the same statewide table, then divide the group's crude barrels by the sum across all 254 county rows. Each tier includes the previous tier.
| Number of counties | Preliminary July 2025 | Preliminary July 2026 |
|---|---|---|
| 1 | 15.1% | 16.3% |
| 3 | 36.0% | 38.3% |
| 5 | 47.3% | 50.3% |
| 10 | 68.9% | 69.4% |
| 20 | 85.4% | 86.2% |
| 50 | 97.3% | 97.4% |
Which counties lead the distribution?
Martin and Midland were the two largest crude oil counties in both preliminary snapshots. Their combined share was 31.5% in preliminary July 2026.
| Preliminary July 2026 county | Crude barrels | State share |
|---|---|---|
| Martin | 19,833,432 | 16.3% |
| Midland | 18,418,690 | 15.2% |
| Upton | 8,299,670 | 6.8% |
| Loving | 8,079,760 | 6.7% |
| Reagan | 6,468,955 | 5.3% |
| Reeves | 5,346,978 | 4.4% |
| Andrews | 5,109,194 | 4.2% |
| Karnes | 4,969,757 | 4.1% |
| Glasscock | 4,158,062 | 3.4% |
| Howard | 3,595,700 | 3.0% |
What can a county production share tell a mineral owner?
A county share measures where the reported crude oil came from. It is a useful starting point for comparing a county with the statewide market. A royalty owner's payment depends on the specific wells, ownership decimal, production period and payment terms. County volume has a different denominator.
How were the county totals checked?
AMR used the matched county rows in the Railroad Commission of Texas crude oil tables. The two original July releases each listed 254 counties. Every county was present in both snapshots. Ranks sort by crude barrels, with county name breaking ties in the download. Explicit zeros stay zero. The denominator excludes the separate gas and condensate columns. The two snapshots compare like calendar months at preliminary vintage and do not establish a long-term annual trend.
Sources and data
- Railroad Commission preliminary July 2025 crude oil county table
- Railroad Commission preliminary July 2026 crude oil county table
Download the data (CSV) · Read the data dictionary. The AMR analysis and figures are licensed CC BY 4.0. Refer to the original issuers for their materials.