Key takeaways
- Wells at or below 15 BOE per day made up 78.0% of EIA-covered wells in 2024. The EIA distribution tabulated 716,686 wells in that bracket out of 918,481 covered wells.
- The same bracket accounted for 5.6% of EIA-covered oil and 6.1% of natural gas output in 2024. AMR divides each bracket's oil or gas volume by the same commodity's total on the U.S. table. Gas volumes and oil volumes keep their own units.
- Wells above 100 BOE per day were 7.5% of EIA-covered wells in 2024. That group accounted for 79.0% of covered oil and 78.0% of covered natural gas output.

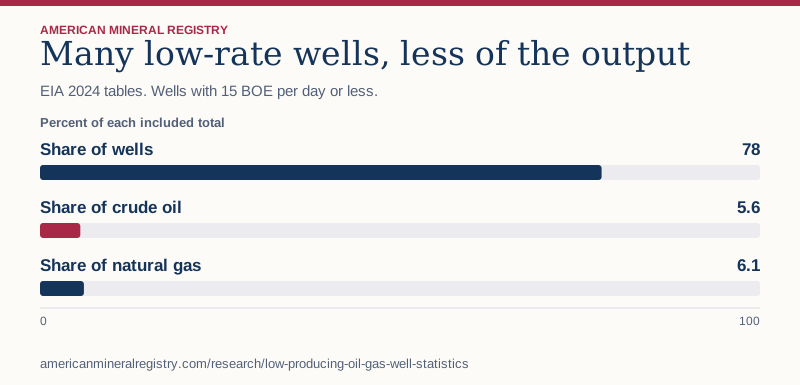
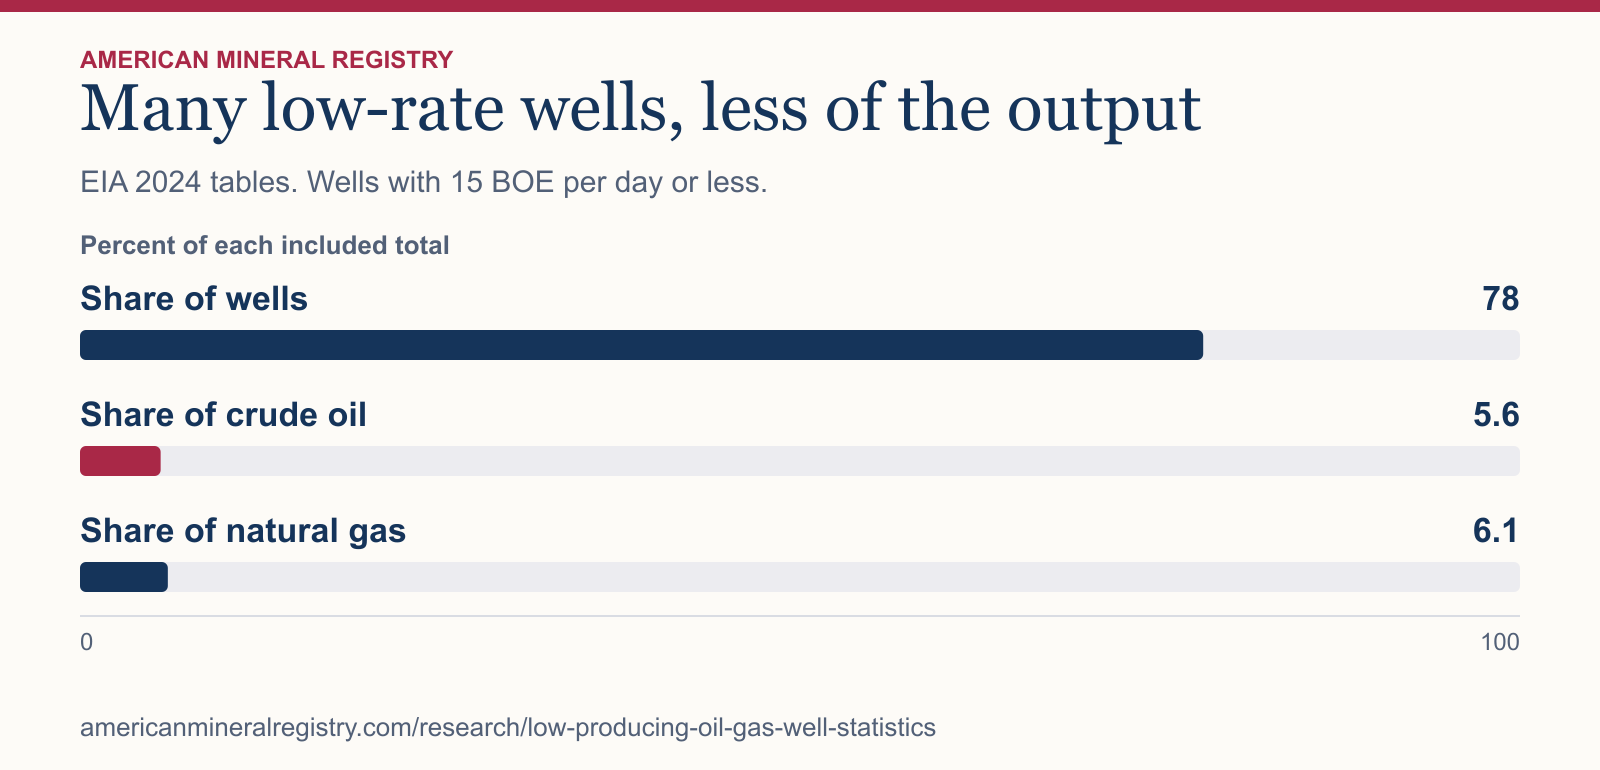
Figure 1 in text
EIA 2024 tables. Wells with 15 BOE per day or less. Percent of each included total.
| Category | Percent of each included total |
|---|---|
| Share of wells | 78 |
| Share of crude oil | 5.6 |
| Share of natural gas | 6.1 |
Chart wording and scale
Many low-rate wells, less of the output EIA 2024 tables. Wells with 15 BOE per day or less.
Percent of each included total
Share of wells
78
Share of crude oil
5.6
Share of natural gas
6.1 0 100
Source and data: Download chart source data
Permanent link to this figure’s text and data · Sources and context
How much production comes from the lowest-rate wells?
Well count weights each well equally. Output share weights each well by volume. The same rate bracket can account for most wells and a small share of the two commodities.
| 2024 EIA-covered bracket | Share of wells | Share of oil | Share of natural gas |
|---|---|---|---|
| 15 BOE per day or less | 78.0% | 5.6% | 6.1% |
| Over 100 BOE per day | 7.5% | 79.0% | 78.0% |
How has the balance changed over time?
The table uses the same published cutoff across selected years in the same workbook. The shares describe the EIA-covered entities for each year. Coverage and source vintages can vary by state.
| Year | Well share at 15 BOE/day or less | Oil share | Natural gas share |
|---|---|---|---|
| 2014 | 79.8% | 11.1% | 11.7% |
| 2019 | 79.4% | 6.9% | 7.8% |
| 2022 | 78.6% | 6.3% | 6.7% |
| 2023 | 78.5% | 5.9% | 6.3% |
| 2024 | 78.0% | 5.6% | 6.1% |
What does barrels of oil equivalent per day measure?
The EIA uses an energy-equivalent rate to group oil and natural gas wells. Its tables still report oil in millions of barrels and gas in billions of cubic feet. Use those separate denominators when citing shares. The 15 BOE per day cut here follows the source table. A statute or program may define eligibility differently.
Which data and limitations should a citation include?
AMR used the US_total worksheet in EIA Appendix B, drawing the rate-band subtotals and all-included totals from the same year and workbook. The workbook reflects data available in November 2025. EIA notes that some late-reporting states carry forward prior data and that Illinois and Indiana are missing. The series uses well-level producing entities available to EIA, including some completions, recompletions, sidetracks and leases. Its totals can differ from separate state-level EIA production series. EIA discontinued updates to this report effective October 15, 2026. The results here describe the published historical tables.
Sources and data
- U.S. Energy Information Administration distribution and methodology
- EIA Appendix B, US_total, Tables B15 through B25
Download the data (CSV) · Read the data dictionary. The AMR analysis and figures are licensed CC BY 4.0. Refer to the original issuers for their materials.