Key takeaways
- ONRR recorded $0.87 billion in oil and gas royalties attributed to its Native American land class in FY 2026. That was 5.3% of the combined Federal and Native American oil and gas royalty amounts in its file. The comparison excludes private and state lands outside ONRR’s dataset.
- The largest nominal Native American oil and gas royalty figure in ONRR’s FY 2004 through FY 2026 file was $1.56 billion in FY 2022. The ranking uses signed royalty amounts and excludes rents and bonuses.
- From FY 2021 to FY 2022, combined ONRR oil and gas royalty receipts rose by $7.57 billion, the largest annual increase across the two land classes in the FY 2004 to FY 2026 series. Federal receipts contributed $7.01 billion and the Native American land class contributed $562.10 million of the change.
- Federal and Native American land-class oil and gas royalty receipts moved in opposite directions in four of 22 adjacent fiscal-year comparisons from FY 2004 through FY 2026. The later years in those pairs were FY 2010, FY 2012, FY 2023 and FY 2026. The test uses the signs of the two nominal dollar changes.
- After FY 2008, ONRR’s Native American oil and gas royalty receipts first returned to their FY 2008 nominal level in FY 2012, while federal receipts first returned to their own FY 2008 nominal level in FY 2022. Each land class is compared with its own nationwide baseline in the signed fiscal-year receipt series.
- After FY 2014, ONRR’s Native American oil and gas royalty receipts took five fiscal years to reach their FY 2014 nominal level again. Federal receipts took eight years to reach their own FY 2014 level. The first fiscal years at or above those benchmarks were FY 2019 and FY 2022, respectively.

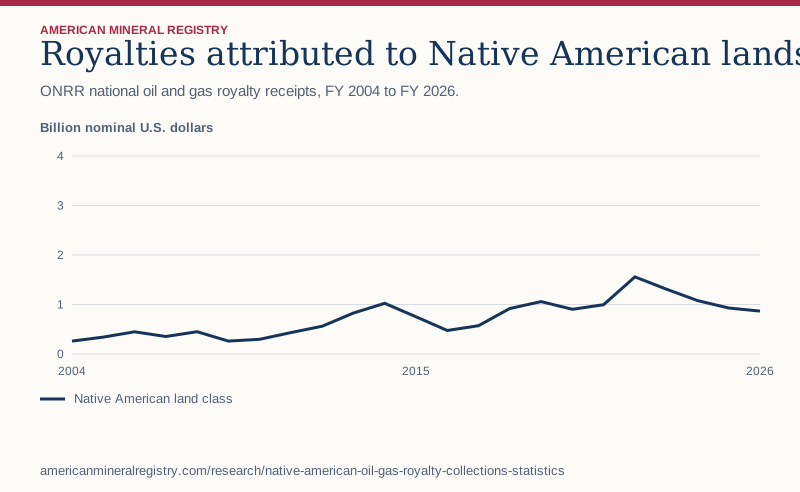
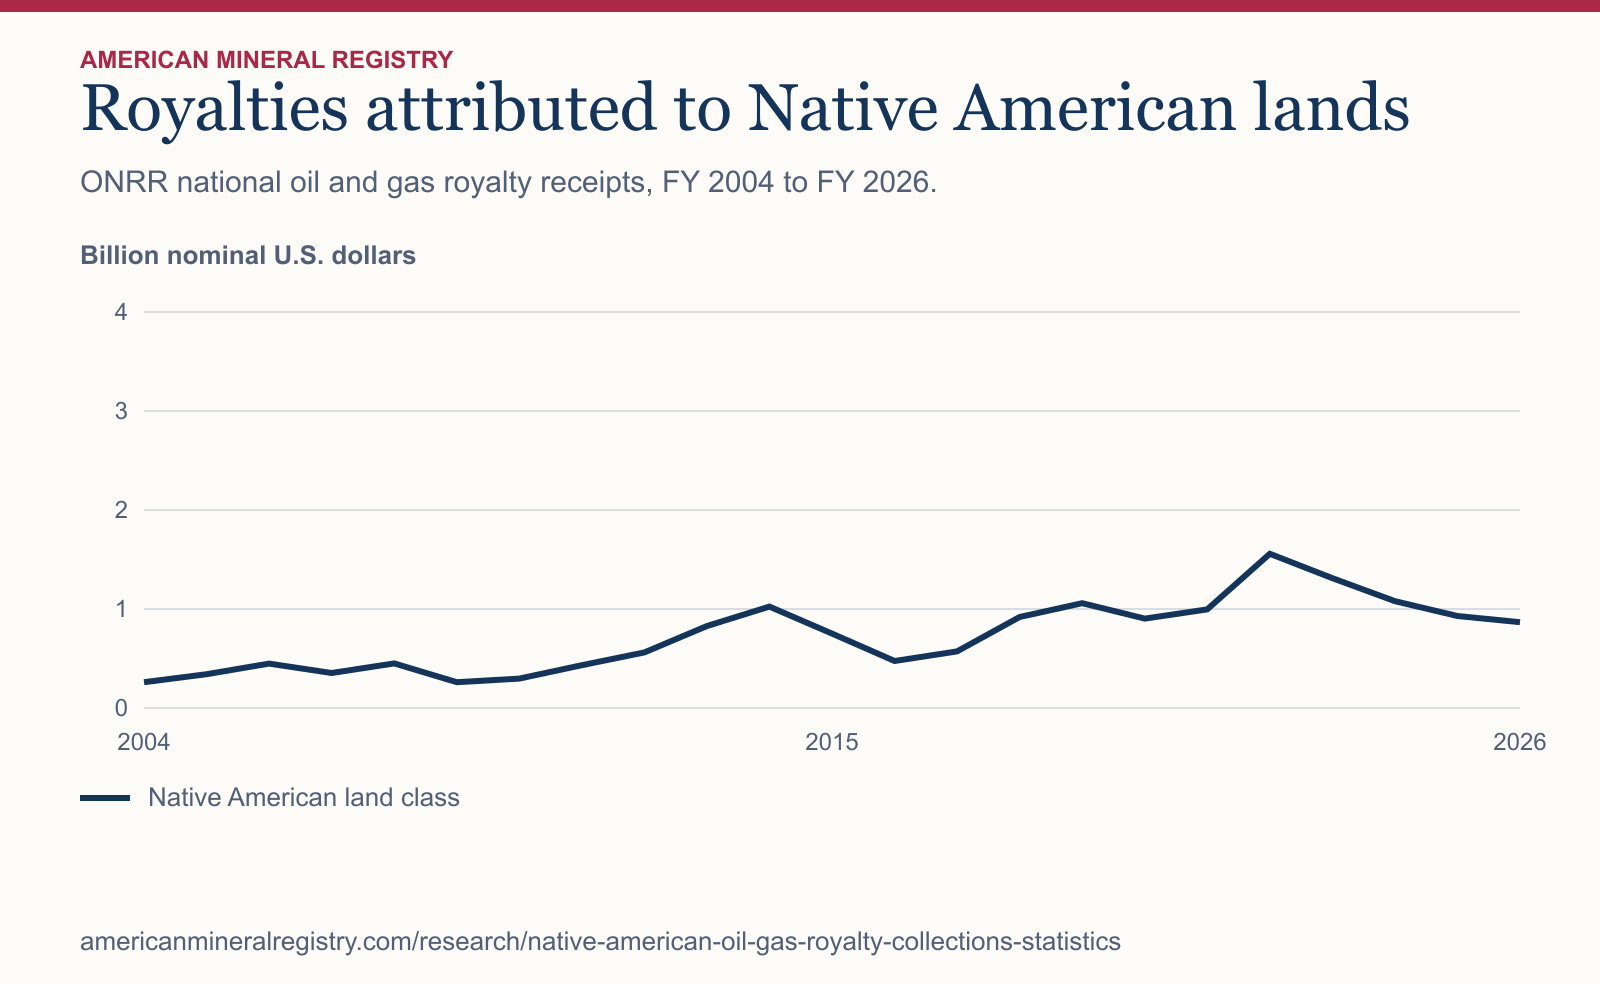
Figure 1 in text
ONRR national oil and gas royalty receipts, FY 2004 to FY 2026. Billion nominal U.S. dollars.
| Fiscal year | Native American land class |
|---|---|
| 2004 | 0.26 |
| 2005 | 0.34 |
| 2006 | 0.45 |
| 2007 | 0.35 |
| 2008 | 0.45 |
| 2009 | 0.26 |
| 2010 | 0.30 |
| 2011 | 0.43 |
| 2012 | 0.56 |
| 2013 | 0.83 |
| 2014 | 1.03 |
| 2015 | 0.75 |
| 2016 | 0.48 |
| 2017 | 0.57 |
| 2018 | 0.92 |
| 2019 | 1.06 |
| 2020 | 0.90 |
| 2021 | 1.00 |
| 2022 | 1.56 |
| 2023 | 1.31 |
| 2024 | 1.08 |
| 2025 | 0.93 |
| 2026 | 0.87 |
Chart wording and scale
Royalties attributed to Native American lands ONRR national oil and gas royalty receipts, FY 2004 to FY 2026.
Billion nominal U.S. dollars 0 1 2 3 4 2004 2015 2026 Native American land class
Source and data: Download chart source data
Permanent link to this figure’s text and data · Sources and context
Which record answers your question about Native American oil and gas royalties?
The answer depends on the accounting event. This page counts signed oil and gas royalty receipts in ONRR’s Native American land class. A disbursement publication reports money distributed to recipients under its own classification. An individual account statement records activity for that account. Start with the event named in the question, then choose the publication. See the ONRR revenue downloads and field definitions and ONRR disbursement downloads and field definitions.
For a national comparison of source land classes, put the Native American class beside the Federal class in the same receipt release. For a question about the amount disbursed to recipients, start with recipient categories in the disbursement release. If the question is about a particular owner, the public national series has no owner identifier. An authorized holder’s statement or payment record is the evidence for that question.
| Question | Evidence | Unit of observation |
|---|---|---|
| What did ONRR record from the Native American land class? | Fiscal-year revenue file, Mineral Lease Type = Oil & Gas and Revenue Type = Royalties | Signed dollar aggregate from classified source rows |
| What did Interior distribute to Native American recipients? | Fiscal-year disbursement file, recipient category and scope | Signed dollar amount distributed under that reporting scope |
| Was a particular owner paid? | Authorized individual account statement or applicable payment record | Account-level or payment-level record |
What can the Native American land classification identify?
The Land Class field identifies the source category ONRR used in its public revenue file. ONRR describes the Native American mineral revenue program separately from federal mineral revenue. Read that program description together with the public file’s geography fields. See the ONRR Native American revenue overview and ONRR revenue downloads and field definitions.
The DOI fiscal-year natural resource revenue catalog says Native American revenue data is available only at the national level to protect private and personally identifiable information. The total identifies no tribe, reservation, parcel, lease, beneficial owner or count of people paid. A row without geography stays in the applicable nationwide land-class total. Filling blank geography with the location of a nearby well, the address of a recipient or a state average creates information the receipt file does not supply. State and private mineral receipts also sit outside the two ONRR land classes analyzed here. A national figure from this table should keep the qualifier “ONRR-recorded.”
What does ONRR report for the two land classes?
ONRR reports these Native American natural resource revenues at the national level to protect private and personally identifiable information. Federal revenues are available with more geographic detail. The table keeps the two land classifications separate.
| Fiscal year | Native American royalty receipts | Federal royalty receipts | Native American share of both |
|---|---|---|---|
| 2004 | $0.26 billion | $6.30 billion | 4.0% |
| 2012 | $0.56 billion | $8.55 billion | 6.2% |
| 2020 | $0.90 billion | $5.71 billion | 13.6% |
| 2022 | $1.56 billion | $14.54 billion | 9.7% |
| 2026 | $0.87 billion | $15.42 billion | 5.3% |
Why can the highest dollar year differ from the highest share year?
The share has two moving parts. In FY 2022, the Native American land-class amount was $1.56 billion. Its share was 9.7% because Federal receipts also contributed to the denominator.
Calculate the share against each year’s own combined total. The greatest share was 13.6% in FY 2020.
Does this measure all royalties paid to Native American owners?
The figure is the ONRR national aggregate under its Native American land classification. It cannot identify the royalty income of a specific nation, individual owner, state, well or lease.
It also cannot establish the share of all U.S. private royalty payments. The source expressly excludes private and state-owned land.
Can these numbers be used as government disbursements?
Use them to describe royalty receipts by land class. The federal disbursements study uses a recipient-based file for a separate question.
The two-class comparison measures nominal receipts. It does not rank changes in purchasing power.
How much did each land class contribute to the largest annual increase?
The FY 2022 combined increase of $7.57 billion was the largest across the 22 adjacent-year changes. Federal receipts contributed 92.6% and Native American land-class receipts contributed 7.4%. Each share divides a class’s change by the change in the two-class total.
That calculation answers who contributed to a change in receipts. A share of the level of receipts uses a different numerator and denominator, both from the same fiscal year. A class’s share of the increase can therefore differ from its share of total receipts.
| ONRR land class | FY 2021 receipts | FY 2022 receipts | Increase | Share of two-class increase |
|---|---|---|---|---|
| Federal | $7.53 billion | $14.54 billion | $7.01 billion | 92.6% |
| Native American | $1.00 billion | $1.56 billion | $562.10 million | 7.4% |
| Combined | $8.53 billion | $16.10 billion | $7.57 billion | 100.0% |
When did one land class rise while the other fell?
The classes moved in opposite directions in four of 22 annual comparisons. In FY 2026, the Federal increase of $2.57 billion was partly offset by a Native American land-class decline of $60.92 million, leaving a combined increase of $2.50 billion.
Read each row as the named fiscal year less the preceding fiscal year. The combined series can move in the same direction as the class with the larger dollar change. The table does not identify why the classes moved differently or which payors or geographic areas contributed.
| Later fiscal year | Federal change | Native American change | Two-class change |
|---|---|---|---|
| 2010 | −$294.59 million | $35.98 million | −$258.62 million |
| 2012 | −$480.15 million | $127.55 million | −$352.60 million |
| 2023 | $337.83 million | −$246.01 million | $91.82 million |
| 2026 | $2,565.73 million | −$60.92 million | $2,504.81 million |
What share does the Native American land class account for across several years?
Across all 23 fiscal years, the pooled share is 7.4%. The arithmetic mean of the annual shares is 7.6%. Pooling gives a high-receipt year more weight, while the arithmetic mean gives each fiscal year one vote.
The blocks below cover every year once, using FY 2010 and FY 2020 as decade boundaries. Their durations differ, so compare shares rather than their raw dollar totals to describe the mix. The amounts are nominal sums and do not adjust the relative value of dollars received in different years.
| Fiscal-year window | Year count | Native American land class | Two-class denominator | Pooled share |
|---|---|---|---|---|
| FY 2004 to FY 2010 | 7 | $2.41 billion | $60.27 billion | 4.0% |
| FY 2011 to FY 2020 | 10 | $7.53 billion | $79.33 billion | 9.5% |
| FY 2021 to FY 2026 | 6 | $6.74 billion | $85.78 billion | 7.9% |
How did each class move from FY 2022 to FY 2026?
Between FY 2022 and FY 2026, Federal receipts rose by $884.81 million. The Native American land-class figure fell by $689.68 million. These changes leave a combined increase of $195.13 million.
FY 2022 is the high point for Native American land-class dollars in this file. This comparison uses the two endpoint amounts and says nothing about the direction of individual intervening years. It is possible for the combined amount to finish higher even as one constituent amount finishes lower.
How should a combined change be described in a citation?
Name the ONRR land classes and state whether the figure is a dollar change, a contribution to a change or a share of total receipts. A contribution can exceed 100% when the other class moves the opposite way. It is a signed accounting bridge.
The national Native American land-class figures do not break out a specific nation, mineral owner or lease. The two-class sum includes the Federal category in the same file. Neither the total nor the contribution table measures money distributed to state governments, tribes or private payees.
How do you verify the Native American share of the two land classes?
Use FY 2018 to test the denominator. First, read the Native American receipt amount of $919,770,841.36 and the federal receipt amount of $6,720,878,632.28. Second, add them to get the two-class total of $7,640,649,473.64. Third, divide the Native American amount by the two-class total. The result is 12.04% of the combined ONRR federal and Native American oil and gas royalty receipts for that fiscal year.
Dividing by the Federal class alone gives 13.69%. That second calculation expresses Native American receipts per dollar of federal receipts. Both calculations use the same numerator and answer different questions. The phrase “share of the combined total” requires a denominator containing both amounts. The phrase “share of all U.S. oil and gas royalties” would require national private and state receipt data as well.
How do you compare a receipt headline with Interior’s disbursement headline?
For FY 2026, this page reports $867,448,951.34 in oil and gas royalty receipts for the Native American land class. In the Interior’s October 28, 2026 fiscal-year disbursement release, Interior announced $918 million in disbursements to tribes and individual Indian mineral owners in a release covering energy and mineral revenues. Interior reported that those distributions reached 33 federally recognized tribes and approximately 31,000 individual Indian mineral owners. The $918 million pools both recipient groups. An individual average would require a separately reported individual-only amount for that same population.
First match the fiscal-year label. Then record the accounting event, source or recipient category, commodities, revenue types and release date. Keep the two figures separately labeled when their coverage differs. The difference between these totals cannot establish an amount unpaid to a tribe or individual. The DOI fiscal-year natural resource disbursements catalog describes the recipient dataset’s scope.
What can the national receipts say about an owner’s payment?
ONRR describes revenue for both tribes and individual mineral owners. A national land-class total cannot show the payment path, date or recipient behind any particular amount. The distinction matters when the question is whether a lease-related payment reached a specific person or tribe. See the ONRR Native American revenue overview.
Interior discusses Statements of Performance for Individual Indian Money accounts in Interior’s Individual Indian Money account FAQ. An owner-level check starts with the applicable statement or payment record available to an authorized account holder and the period shown on it. The amount, posting date and any reference supplied on that record belong to the account-level question. Dividing a nationwide receipt total by a population estimate or number of tribes does not produce an observed royalty payment, an average account balance or a measure of how often owners received money.
What should a reviewer confirm before publishing a Native American royalty statistic?
Write the sentence with its fiscal year, reporting agency, land class, lease type and revenue type. Confirm that the numerator uses Land Class = Native American, Mineral Lease Type = Oil & Gas and Revenue Type = Royalties. For a percentage, record the exact denominator and confirm the Federal class uses the same lease and revenue filters. Retain negative amounts when summing the receipts.
A reviewer should be able to reproduce both class totals from the frozen fiscal data and then recover the share from the exact amounts before rounding. If the headline refers to recipients or a particular owner, replace it with an ONRR land-class statement or bring the corresponding recipient or account evidence. A map has the same requirement. It can only show locations supplied by a suitable source for the claim.
How far did each land class fall after FY 2008 and FY 2014?
A comparison of each land class with its own history can answer a question that the share of combined receipts cannot. The test starts in FY 2008 and FY 2014, two years followed by lower receipts in both classes. For each baseline, take the smaller of the next two annual observations and compare that amount with the starting level for the same class. This is a descriptive comparison of selected historical episodes, with the same two-year search window for both classes.
The denominator for each percentage is the starting nominal amount for the class on that row. The two starting amounts are different, so a larger loss in dollars and a larger percentage loss need not identify the same class. The two-year lows also need not occur in the same year. In the FY 2008 comparison, the Native American series reaches its two-year low in FY 2009 and the federal series in FY 2010.
| Baseline | ONRR land class | Nominal baseline | Low in next two years | Nominal low | Decline from baseline |
|---|---|---|---|---|---|
| FY 2008 | Native American | $450,084,542.19 | FY 2009 | $260,962,397.16 | 42.02% |
| FY 2008 | Federal | $12,185,006,944.63 | FY 2010 | $6,341,602,705.76 | 47.96% |
| FY 2014 | Native American | $1,025,166,879.66 | FY 2016 | $475,675,751.77 | 53.60% |
| FY 2014 | Federal | $9,252,360,717.37 | FY 2016 | $3,966,922,847.72 | 57.13% |
When did receipts reach each class’s own baseline again?
Scan forward one fiscal year at a time and stop at the first nominal observation at least as large as the baseline. The elapsed years equal the later fiscal-year label minus the baseline label. An exact tie would qualify. A class that clears the baseline can fall below it later. For example, the Native American total exceeded its FY 2014 level in FY 2019, then fell below that benchmark in FY 2020.
These comparisons keep the starting class fixed. If the question concerns the share of combined federal and Native American receipts, build the two-class denominator separately. If the question concerns recovery in purchasing power, adjust all observations to a stated price level before comparing them. These tables use the reported nominal receipt values throughout.
A line chart can display both recoveries on one scale by setting each class’s baseline equal to 100. Divide subsequent receipts by the baseline for that class and multiply by 100. The first year whose index reaches 100 should match the second table. The resulting chart measures recovery relative to each baseline. The first table gives the receipt levels that the index removes.
| Baseline | ONRR land class | First fiscal year at or above baseline | Elapsed fiscal years | Nominal receipts in first qualifying year |
|---|---|---|---|---|
| FY 2008 | Native American | FY 2012 | 4 | $560,857,250.53 |
| FY 2008 | Federal | FY 2022 | 14 | $14,538,006,663.73 |
| FY 2014 | Native American | FY 2019 | 5 | $1,058,505,191.77 |
| FY 2014 | Federal | FY 2022 | 8 | $14,538,006,663.73 |
Which published figures can be compared with the land-class series?
The CRS report on federal onshore oil and gas revenues and disbursements uses an onshore federal scope and its figure notes exclude tribal-land revenues. The Interior departmental manual on ONRR responsibilities assigns ONRR both collection and disbursement responsibilities. That distinction matters because a return to a receipt benchmark establishes how the nationwide source totals compared over time. It establishes no date on which a recipient’s disbursements or an individual’s income returned to an earlier level.
The Interior FY 2026 disbursement release describes FY 2026 recipient disbursements under a broader energy and mineral scope. The DOI fiscal-year revenue catalog explains that the public Native American receipt data are nationwide for privacy. A local or owner-level recovery statistic would require comparable observations for that geography or account, with the same measure and time basis at both endpoints.
How does this compare with other published research?
These sources address related questions using different measures. The table shows how to use them alongside this study.
Publications reviewed for this comparison. ONRR / DOI. U.S. Department of the Interior. U.S. Department of the Interior. Congressional Research Service.
| Publisher | What the publication covers | How AMR extends the comparison |
|---|---|---|
| ONRR / DOI | The fiscal metadata explains nationwide disclosure for Native American revenue and the exclusion of private and state lands. | Compute recovery times only at the national land-class level. |
| U.S. Department of the Interior | Chapter 34 lists ONRR collection, accounting and disbursement functions for federal and Native American recipients. | Keep receipt and disbursement events distinct. |
| U.S. Department of the Interior | The FY 2026 release gives broader recipient disbursement totals for tribes and individual Indian mineral owners. | Use only as a cross-scope reference. |
| Congressional Research Service | The figure notes specify federal onshore oil and gas and exclude tribal lands. | Document the coverage boundary and retain the nationwide ONRR receipt series for calculations. |
How can a reader reproduce the total?
Use the ONRR fiscal-year CSV. Filter to Oil & Gas lease type and Royalties revenue type, then sum signed amounts separately for Federal and Native American land class. Use the same two classifications in every included year.
The downloadable table contains the exact annual amounts, the two-class denominator and the calculated percentage. All 23 fiscal years contain a value for each included land class.
Sources and data
- ONRR original fiscal-year natural resource revenue CSV
- Department of the Interior coverage and metadata
- ONRR revenue downloads and field definitions
- ONRR disbursement downloads and field definitions
- DOI fiscal-year natural resource disbursements catalog
- Interior’s October 28, 2026 fiscal-year disbursement release
- ONRR Native American revenue overview
- Interior’s Individual Indian Money account FAQ
- Interior departmental manual on ONRR responsibilities
- CRS report on federal onshore oil and gas revenues and disbursements
Download the data (CSV) · Read the data dictionary. The AMR analysis and figures are licensed CC BY 4.0. Refer to the original issuers for their materials. Read the calculation data guide.
Calculation data guide
The analysis download gives each calculated measure, evidence period, numeric value, unit, and formula. Follow its source data URL for the input rows and use the period and unit when quoting the result.