Key takeaways
- In FY 2004 through FY 2025, U.S. federal oil and gas royalties peaked in FY 2023 in nominal dollars, but in FY 2008 after adjusting for inflation. FY 2008 receipts were $18.18 billion in FY 2025 dollars. Both peak years are calculated over the same 22 fiscal years.
- FY 2025 federal oil and gas royalty receipts of $12.86 billion were 70.7% of the real FY 2008 peak. The nominal and adjusted values match in the base fiscal year.
- Federal oil and gas royalties were $15.75 billion in FY 2023 and $18.18 billion in FY 2008 when both are expressed in FY 2025 dollars. ONRR royalties cover federal onshore and offshore lease receipts. CPI-U measures consumer prices.
- Average federal oil and gas royalties were $12.72 billion in FY 2021 to FY 2025 versus $8.98 billion in FY 2004 to FY 2008 in nominal dollars. Adjusted to FY 2025 dollars, the earlier window led by $633.47 million a year. Each five-year window has one observation per federal fiscal year. The real average uses the CPI-adjusted amount for each year.
- From FY 2022 to FY 2023, federal oil and gas royalties rose by $337.83 million in nominal dollars and fell by $421.49 million in FY 2025 dollars. This was the only direction reversal across 21 adjacent year pairs in AMR’s FY 2004 to FY 2025 comparison.
- Federal oil and gas royalties would have needed to reach $17.17 billion in nominal FY 2023 dollars to match the purchasing power of the FY 2008 peak. AMR converted the FY 2008 real total back to FY 2023 dollars using the FY 2023 CPI average. The reported FY 2023 total was $14.88 billion.
- ONRR’s federal oil and gas royalties reached at least $10 billion in 14 of 22 fiscal years from FY 2004 through FY 2025 in FY 2025 dollars, versus 5 of 22 in nominal dollars. Each fiscal year counts once. The adjusted amounts use the 12-month fiscal CPI-U average.
- Federal oil and gas royalties met the $10 billion threshold in FY 2025 dollars for 5 consecutive years in FY 2004 through FY 2008, the longest run in AMR’s FY 2004 through FY 2025 series. The nominal series’ longest run was 4 years, from FY 2022 through FY 2025.

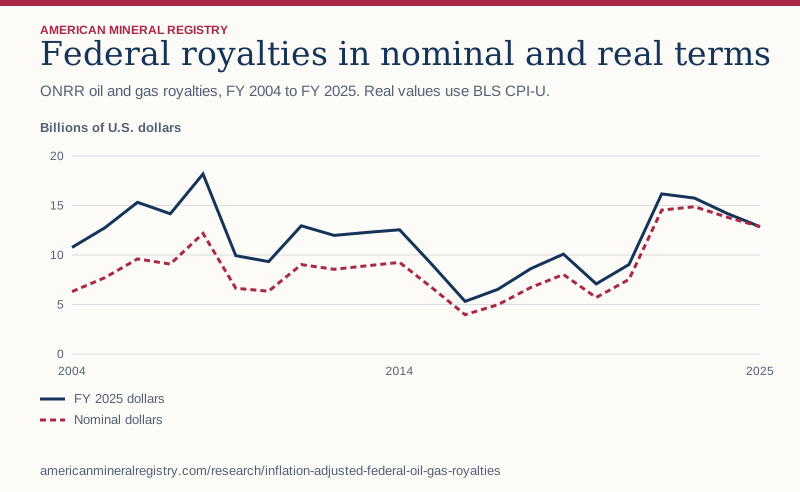
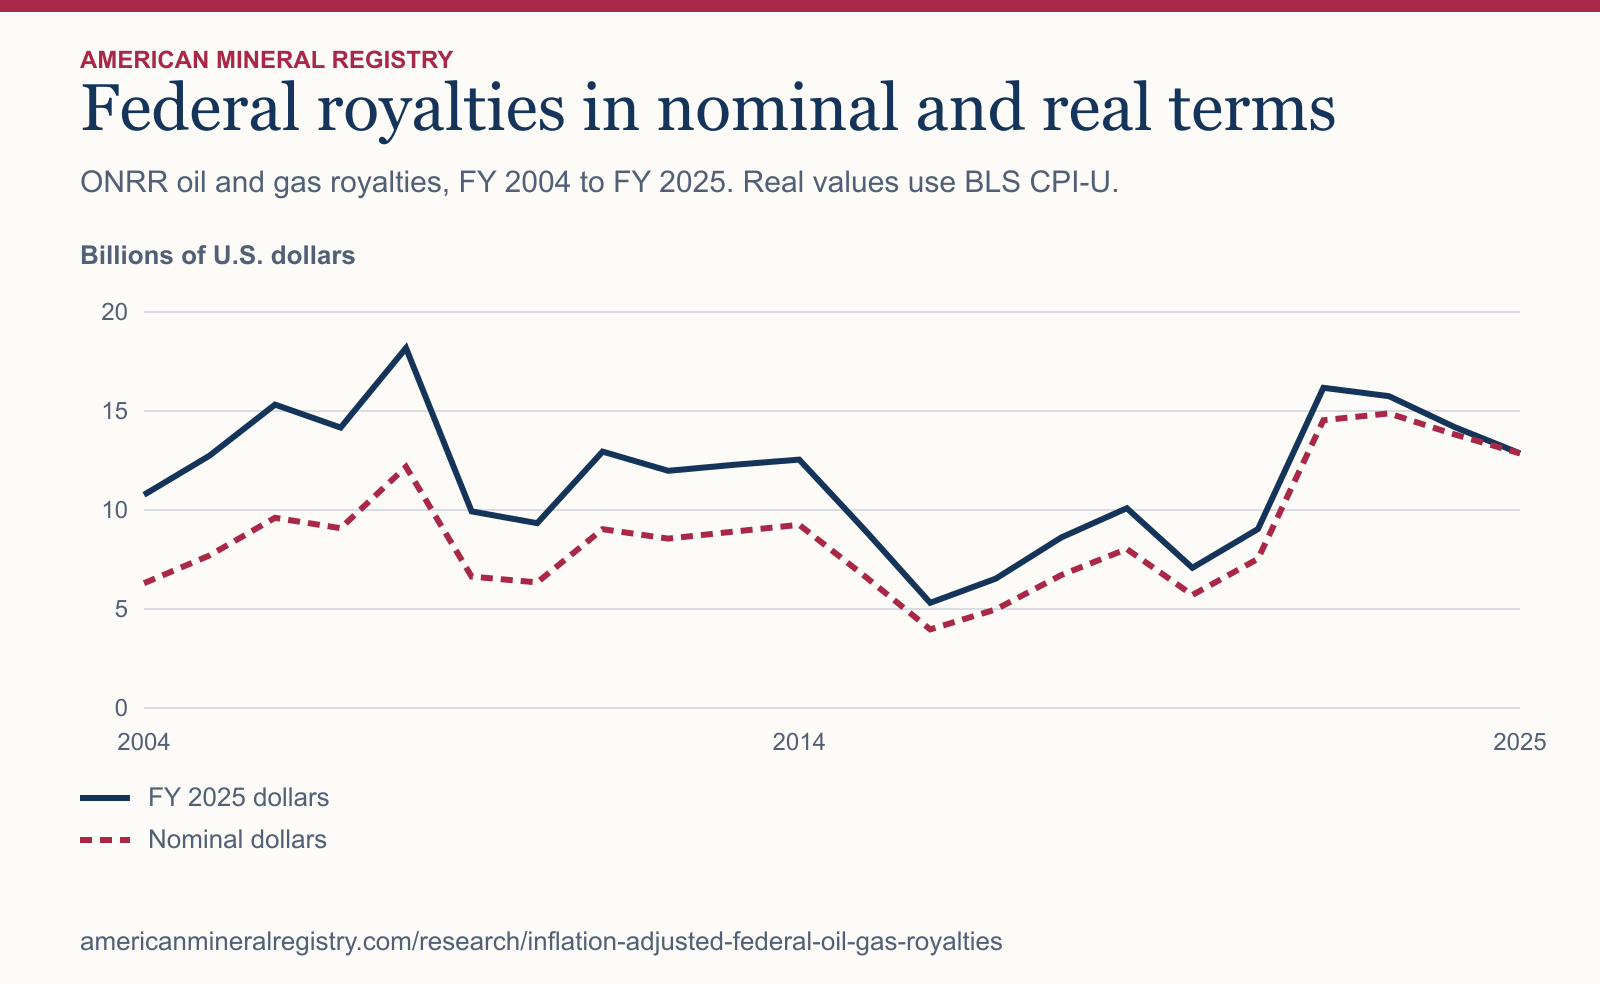
Figure 1 in text
ONRR oil and gas royalties, FY 2004 to FY 2025. Real values use BLS CPI-U. Billions of U.S. dollars.
| Fiscal year | FY 2025 dollars | Nominal dollars |
|---|---|---|
| 2004 | 10.76 | 6.30 |
| 2005 | 12.75 | 7.71 |
| 2006 | 15.32 | 9.61 |
| 2007 | 14.16 | 9.08 |
| 2008 | 18.18 | 12.19 |
| 2009 | 9.93 | 6.64 |
| 2010 | 9.34 | 6.34 |
| 2011 | 12.95 | 9.03 |
| 2012 | 11.98 | 8.55 |
| 2013 | 12.28 | 8.91 |
| 2014 | 12.54 | 9.25 |
| 2015 | 8.99 | 6.65 |
| 2016 | 5.31 | 3.97 |
| 2017 | 6.54 | 4.98 |
| 2018 | 8.61 | 6.72 |
| 2019 | 10.10 | 8.03 |
| 2020 | 7.08 | 5.71 |
| 2021 | 9.04 | 7.53 |
| 2022 | 16.17 | 14.54 |
| 2023 | 15.75 | 14.88 |
| 2024 | 14.19 | 13.82 |
| 2025 | 12.86 | 12.86 |
Chart wording and scale
Federal royalties in nominal and real terms ONRR oil and gas royalties, FY 2004 to FY 2025. Real values use BLS CPI-U.
Billions of U.S. dollars 0 5 10 15 20 2004 2014 2025 FY 2025 dollars Nominal dollars
Source and data: Download chart source data
Permanent link to this figure’s text and data · Sources and context
Which dollar figure should you use in a report on federal oil and gas royalties?
Use nominal dollars to say how many dollars ONRR recorded in a given federal fiscal year. Use constant FY 2025 dollars to compare how much purchasing power those receipts represented across years. A chart of inflation-adjusted royalty receipts should name the dollar base in its axis label and headline. In a budget reconciliation, use the amount as reported for that fiscal year and retain the source’s signs.
CPI-U measures price change for a broad basket purchased by urban consumers. It answers a general purchasing-power question. A question about crude oil prices, gas prices, drilling inputs or the cost of a particular public program calls for a measure of that item. A CPI-U adjustment by itself cannot separate the influences on how much royalty revenue ONRR recorded. See the BLS Consumer Price Index overview.
| Reader’s question | Figure to use | Label to keep |
|---|---|---|
| How many dollars did ONRR record? | Signed annual receipts as reported | Nominal dollars and fiscal year |
| How does the purchasing power compare across years? | The same receipts adjusted by fiscal-year CPI-U | Constant FY 2025 dollars |
| How did the price of oil or gas change? | A commodity-price series for the product and period | Product, market, unit and period |
Which months belong in a federal fiscal-year inflation adjustment?
For a fiscal year ending in September, take October through December of the preceding calendar year and January through September of the labeled year. FY 2016 therefore starts in October 2015, and FY 2025 starts in October 2024. Select the all-items, U.S. city average, nonseasonally adjusted CPI-U used in the study. The two date columns and the month count in the download make the annual revenue and CPI window auditable.
The fiscal-year average is the arithmetic mean of the 12 monthly index levels. A September-to-September inflation rate answers how prices changed between two observations. A January-to-December mean describes a different set of months. A calendar-year version of the study would need a calendar-year receipt series and a separately defined CPI window. DOI publishes separate DOI fiscal-year natural resource revenue catalog and DOI calendar-year natural resource revenue catalog datasets.
Which years look largest after inflation?
Comparing reported dollars with reported dollars answers a nominal receipt question. Comparing the same receipts at a common consumer price level answers a purchasing-power question. The two methods produce different peak years over the same evidence window.
| Fiscal year | Nominal receipts | Receipts in FY 2025 dollars | 12-month CPI-U average |
|---|---|---|---|
| 2004 | $6.30 billion | $10.76 billion | 187.350 |
| 2008 | $12.19 billion | $18.18 billion | 214.463 |
| 2016 | $3.97 billion | $5.31 billion | 238.939 |
| 2020 | $5.71 billion | $7.08 billion | 258.014 |
| 2023 | $14.88 billion | $15.75 billion | 302.289 |
| 2025 | $12.86 billion | $12.86 billion | 319.997 |
How are fiscal-year receipts adjusted for inflation?
For each federal fiscal year, AMR averages monthly, not seasonally adjusted, all-items CPI-U from October through September. Real receipts equal nominal receipts multiplied by the FY 2025 average CPI-U divided by that year’s average.
For FY 2008, the source amount was $12.19 billion. The fiscal CPI-U averages were 214.463 for FY 2008 and 319.997 for FY 2025. The result is $18.18 billion in FY 2025 dollars.
Why does the real series end at FY 2025?
October 2025 is empty in the CPI-U extract. That month belongs to FY 2026. AMR requires all 12 published CPI months for each fiscal average and leaves FY 2026 outside this adjusted series.
The nominal onshore and offshore royalty study has a different evidence window because it needs no inflation index.
What does this adjustment measure?
CPI-U places recorded dollars at a common U.S. urban consumer price level. It is a transparent comparison of purchasing power. It does not measure oil and gas operating costs or the purchasing patterns of a particular government.
The result uses one fiscal-year price average for the full annual total. It does not adjust each individual royalty payment by its payment month.
Does a five-year average change the ranking?
Using equal-length windows gives each comparison five annual observations, so the result does not depend on one peak year. These windows are the first and last five years in the complete adjusted series. They omit the intervening years and are a comparison of the endpoints, rather than an estimate of a long-term growth rate.
The later window leads by $3.75 billion in average nominal receipts. In common FY 2025 dollars, the earlier window leads by $633.47 million. Average the already adjusted annual receipts to reproduce the real column. Applying one average CPI multiplier to a five-year nominal average changes the weighting.
| Fiscal-year window | Years in denominator | Mean nominal annual royalties | Mean annual royalties in FY 2025 dollars |
|---|---|---|---|
| FY 2004 to FY 2008 | 5 | $8.98 billion | $14.23 billion |
| FY 2021 to FY 2025 | 5 | $12.72 billion | $13.60 billion |
Which years enter or leave the top five after adjustment?
FY 2006 replaces FY 2025 in the top five when all 22 years are ranked in common dollars. Four years appear in both rankings. FY 2008, FY 2022, FY 2023 and FY 2024 remain in the group, although their order changes. That is a different test from asking which single year ranks first.
The two columns rank the same set of observations and use the full-precision amounts before display rounding. A list of the largest years therefore needs a stated dollar basis even when most of the selected years overlap.
| Rank | Nominal fiscal year | Nominal royalties | Adjusted fiscal year | Royalties in FY 2025 dollars |
|---|---|---|---|---|
| 1 | 2023 | $14.88 billion | 2008 | $18.18 billion |
| 2 | 2022 | $14.54 billion | 2022 | $16.17 billion |
| 3 | 2024 | $13.82 billion | 2023 | $15.75 billion |
| 4 | 2025 | $12.86 billion | 2006 | $15.32 billion |
| 5 | 2008 | $12.19 billion | 2024 | $14.19 billion |
How often did the direction of annual change differ?
One of the 21 adjacent fiscal-year pairs changes direction when the values are adjusted. From FY 2022 to FY 2023, the nominal amount rose while the amount in FY 2025 dollars fell. The sign of a change answers whether the second amount is larger on the selected basis. It does not measure the size of the inflation adjustment.
The nominal growth calculation divides the dollar change by FY 2022 nominal receipts, giving 2.3%. Applying the same calculation to the adjusted amounts gives -2.6%. The two rates use different dollar bases for both numerator and denominator.
| Dollar basis | FY 2022 | FY 2023 | FY 2023 less FY 2022 |
|---|---|---|---|
| Reported nominal dollars | $14.54 billion | $14.88 billion | $337.83 million |
| FY 2025 dollars | $16.17 billion | $15.75 billion | −$421.49 million |
What nominal FY 2023 amount would have matched the FY 2008 peak?
The equivalent was $17.17 billion, about $2.30 billion above recorded nominal FY 2023 receipts. Take the real FY 2008 peak and multiply by the FY 2023 fiscal-year average CPI-U divided by the FY 2025 average CPI-U. This reverses the price-level adjustment for FY 2023.
This is a dollar equivalence. It holds the comparison price level fixed and leaves production, prices, royalty rates and lease terms outside the calculation. The converted figure is useful when someone wants to compare a historical purchasing-power benchmark with the nominal dollars reported for FY 2023.
Which version of the statistic should a reader quote?
Use the reported dollar series to describe the amounts in the federal revenue file. Use the adjusted series for comparisons of purchasing power across years, and name the FY 2025 base. An annual average should include its start year, end year and the number of years used.
The underlying fiscal-year file records federal oil and gas royalties on the same receipt scope in both columns. Changing the dollar basis does not add private or tribal royalties. October 2025 is missing from the CPI extract used here, so no FY 2026 value enters the real comparison, the rankings or the adjacent-year test.
How do you reproduce the FY 2016 result from the downloadable data?
First, select the FY 2016 row and read the signed nominal receipt total of $3,966,922,847.72. Second, confirm the row contains 12 CPI months and the index average of 238.939250. Third, divide the FY 2025 reference average of 319.996583 by the FY 2016 average, then multiply the nominal receipt total by that ratio. The published result is $5,312,654,817.56 in FY 2025 dollars.
Keep the full CPI precision in the calculation and round only the result shown to readers. If you rebuild the annual CPI averages from the monthly source, the published CPI levels are enough to recover the averages before display rounding. A useful independent test is to run the same formula on FY 2025. Its base and year averages are identical, so its real and nominal receipt amounts must match exactly.
How can a fiscal-year receipt total exist when an inflation-adjusted total is unavailable here?
ONRR’s FY 2026 receipt window begins in October 2025. BLS could not collect the October 2025 survey data during the funding lapse and did not publish the October level for the all-items series used here. That one missing month means the study’s rule requiring 12 published observations cannot produce a FY 2026 average. It leaves the independent nominal receipt observation intact.
BLS describes how it calculated certain published 2025 calendar-year averages using 11 observations and how it treated gaps for other products. Those methods have their own stated purposes. Substituting an 11-month fiscal average or estimating a missing index would change this study’s rule and would require an explicit method label. The full FY 2025 window closed in September 2025, before the missing month. See the BLS October 2025 CPI data collection and publication FAQ.
What changes if another report uses a different constant-dollar base?
Changing the base year multiplies every adjusted amount by the same factor when the report uses the same receipt inputs and CPI series. The absolute dollar labels change, while rankings and percentage changes between adjusted amounts stay the same. For a fair comparison with another report, record the CPI series, time windows, receipt filters and base before comparing a published dollar figure.
When two authors agree on the series but disagree on dollar amounts, check the base first. When their rankings differ, check the year boundaries, whether the source is receipts or recipient disbursements, the fiscal data vintage and the treatment of signed rows. BLS explains the choices involved in specifying a CPI series and reference period in its BLS guide to comparing dollar amounts with the CPI.
What information should accompany a chart or quote using the real series?
A stand-alone citation can read “ONRR recorded $3,966,922,847.72 in signed federal oil and gas royalty receipts in fiscal year 2016, equivalent to $5,312,654,817.56 in FY 2025 dollars using fiscal-year average CPI-U.” An abbreviated chart label can use “Federal oil and gas royalty receipts, billions of FY 2025 dollars” as long as the caption identifies ONRR fiscal data and BLS CPI-U.
If a chart includes a nominal series alongside the real one, label both lines and give readers the base-year check. For a partial or blank year, state whether the revenue input, CPI input or another required field is missing. Retain the CSV vintage in the notes so that a reader using a later agency release can separate revisions from formula differences.
How often did federal oil and gas royalties reach a fixed dollar amount?
A peak year can dominate a chart even when it says little about how regularly receipts reached a level. A threshold count answers that frequency question. The first table uses two round dollar amounts, $10 billion and $12 billion, to make the effect of changing the cutoff visible. The amounts are descriptive reference points rather than government targets or estimates of budget needs.
For each threshold, compare the same 22 fiscal years twice. The nominal count tests how many years met the dollar figure printed in the receipt file. The constant-dollar count first adjusts each year’s receipts to FY 2025 purchasing power. A fiscal year exactly equal to the threshold would qualify. Each year supplies one observation regardless of the amount by which it clears the threshold.
At the higher cutoff, 11 adjusted years qualify. The nominal count stays at 5 because the nominal series has no observation between the two cutoffs. A count that happens to be insensitive in one dollar basis can still be sensitive in another.
| Dollar basis | Annual threshold | Qualifying years | Years tested | Distinct qualifying runs | Longest run, years |
|---|---|---|---|---|---|
| Nominal dollars | $10.00B | 5 | 22 | 2 | 4 |
| Nominal dollars | $12.00B | 5 | 22 | 2 | 4 |
| FY 2025 dollars | $10.00B | 14 | 22 | 4 | 5 |
| FY 2025 dollars | $12.00B | 11 | 22 | 4 | 4 |
Were the years above $10 billion consecutive?
The next table lists every uninterrupted run at or above $10 billion. A run begins with a qualifying observation after a nonqualifying year or at the first year of the study. It ends before the next year below the cutoff or at the end of the available series. The run starting in FY 2004 may have started before the data shown. The run ending in FY 2025 stops where the comparable CPI record stops.
Compare the two tables when writing about persistence. Total years above the threshold answer frequency. The longest run answers duration. Several short episodes and one sustained stretch can add up to the same number of qualifying years while describing quite different histories.
An audit can reconstruct the first table directly from the second at the $10 billion cutoff. Add the run lengths within each dollar basis to get the qualifying-year count. Count the table rows within that basis to get the number of runs, and take the largest run length for the duration statistic. The run rows can also support annotations on a time series, with each shaded interval labeled in the same dollar basis.
| Dollar basis | Consecutive fiscal years at or above $10B | Years in run |
|---|---|---|
| Nominal dollars | FY 2008 | 1 |
| Nominal dollars | FY 2022 to 2025 | 4 |
| FY 2025 dollars | FY 2004 to 2008 | 5 |
| FY 2025 dollars | FY 2011 to 2014 | 4 |
| FY 2025 dollars | FY 2019 | 1 |
| FY 2025 dollars | FY 2022 to 2025 | 4 |
How should you read these figures alongside published federal revenue reports?
The CRS report on federal onshore oil and gas revenues and disbursements studies onshore federal activity and separates revenue categories. The AMR threshold series uses the ONRR federal oil and gas royalty scope, including offshore receipts. When a published figure disagrees, check the land and revenue filters before checking the price adjustment.
The BLS Consumer Price Index overview describes CPI as a tool for translating amounts to a common dollar basis. Its BLS October 2025 CPI publication FAQ explains the October 2025 publication gap. Applying the same 12-month rule leaves FY 2026 outside the comparable denominator. The last qualifying run therefore gives the length observed through FY 2025. It cannot establish whether the same real threshold was met in FY 2026.
How does this compare with other published research?
These sources address related questions using different measures. The table shows how to use them alongside this study.
Publications reviewed for this comparison. ONRR / DOI. Congressional Research Service. U.S. Bureau of Labor Statistics. U.S. Bureau of Labor Statistics.
| Publisher | What the publication covers | How AMR extends the comparison |
|---|---|---|
| ONRR / DOI | The metadata lists the federal onshore, federal offshore and Native American coverage and the source revenue categories. | Use as the receipt scope and CSV authority. |
| Congressional Research Service | The onshore report’s figure notes distinguish royalties, bonus bids, rents and other receipts and document the ONRR vintage. | Cite the geography and receipt-category contrast. |
| U.S. Bureau of Labor Statistics | The overview defines CPI-U and explains CPI’s use as a deflator. | Use as the price-basis authority. |
| U.S. Bureau of Labor Statistics | The FAQ explains the October 2025 publication gap and affected annual averages. | Retain FY 2025 as the comparable endpoint. |
What is included in the underlying royalty total?
AMR sums signed ONRR records classified Federal, Oil & Gas and Royalties, across onshore and offshore. Bonuses, rents and receipts on other land classes stay outside the comparison. The CSV preserves source dollars to the cent and fiscal CPI averages before presentation rounding.
Sources and data
- ONRR original fiscal-year natural resource revenue CSV
- Department of the Interior coverage and metadata
- BLS CPI-U series via the Federal Reserve Bank of St. Louis
- Monthly CPI-U observations
- BLS CPI technical note
- BLS Consumer Price Index overview
- BLS October 2025 CPI data collection and publication FAQ
- BLS guide to comparing dollar amounts with the CPI
- DOI calendar-year natural resource revenue catalog
- CRS report on federal onshore oil and gas revenues and disbursements
Download the data (CSV) · Read the data dictionary. The AMR analysis and figures are licensed CC BY 4.0. Refer to the original issuers for their materials. Read the calculation data guide.
Calculation data guide
The analysis download gives each calculated measure, evidence period, numeric value, unit, and formula. Follow its source data URL for the input rows and use the period and unit when quoting the result.