American Mineral RegistryResearch & data

U.S. Natural Gas Venting and Flaring Statistics: State Volumes and Rates

Updated

U.S. natural gas venting and flaring statistics show different leaders depending on the question. Among states with reported values, Texas recorded the largest combined volume in 2024, 163.512 billion cubic feet. Montana reported the highest share of matching gross withdrawals, 11.548%. The published U.S. total was 335.163 billion cubic feet, equivalent to 0.730716% of national gross withdrawals. These are combined venting and flaring quantities, rather than flaring alone. (American Mineral Registry calculations from EIA, Nov 2025).

On this page
  1. Key Takeaways
  2. How much gas was vented and flared in the United States?
  3. Which states reported the largest vented and flared volumes?
  4. Which reporting states had the highest shares of gross withdrawals?
  5. How did reported state volumes and rates change from 2020 to 2024?
  6. Why do EIA tables disagree about state coverage and zeros?
  7. What does the production accounting show, and how can these figures be cited?
  8. Methodology and Sources

This reference compares the completed 2020 through 2024 observations in one fixed EIA Natural Gas Annual edition. It provides separate volume and rate rankings, matched changes, national concentration, source availability and exact reusable data. A separate archive preserves earlier published snapshots without joining different vintages into a continuous trend. Missing source values remain missing, and a numeric ranking never implies that every state supplied a measured observation.

Key Takeaways

How much gas was vented and flared in the United States?

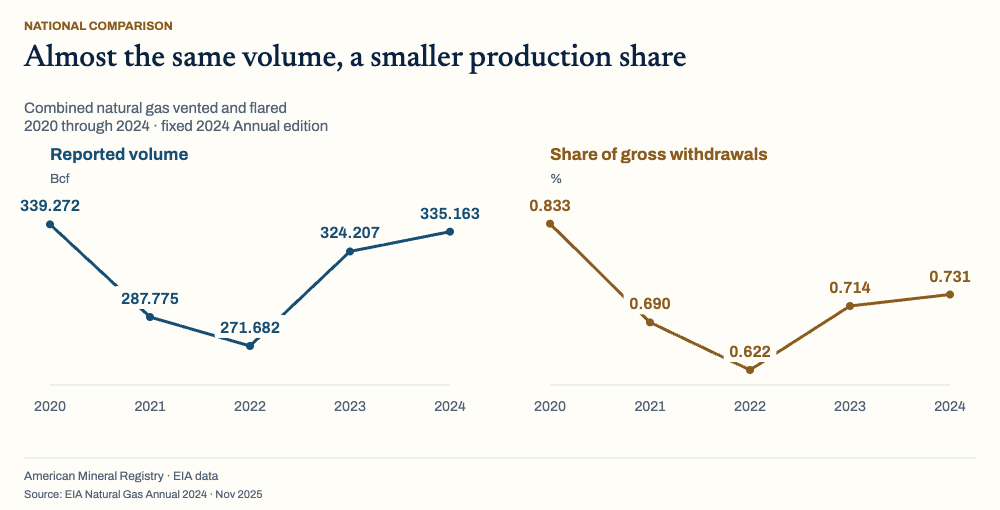
EIA reports a combined disposal volume that can be compared with matching gross withdrawals. The national volume returned near its starting level during this five year window, while the production share ended lower because gross withdrawals increased.

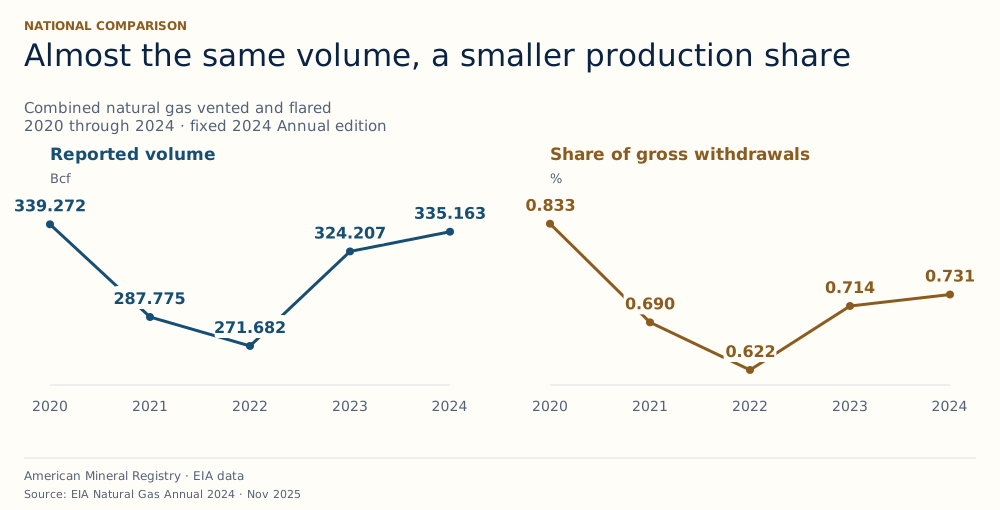
US natural gas venting and flaring statistics: U.S. natural gas venting and flaring statistics, reported volume and share of matched gross withdrawals from 2020 through 2024, with 2024 at 335.163 billion cubic feet and 0.730716 percent.
Figure 1: National volume was 1.21% lower in 2024 than in 2020, but its share of gross withdrawals was 12.28% lower on a relative basis. Source: EIA, Natural Gas Annual Table 3, Nov 2025. Chart drawn by American Mineral Registry from the source figures, checked 14 Nov 2026.

Download original chart (SVG) · Chart image (PNG)

Figure 1 in text

Volume and production share tell different stories U.S. natural gas venting and flaring statistics, reported volume and share of matched gross withdrawals from 2020 through 2024, with 2024 at 335.163 billion cubic feet and 0.730716 percent.

Read the complete diagram text

NATIONAL COMPARISON Almost the same volume, a smaller production share Combined natural gas vented and flared 2020 through 2024 · fixed 2024 Annual edition

Reported volume Bcf 2020 2021 2022 2023 2024

339.272

287.775

271.682

324.207

335.163

Share of gross withdrawals % 2020 2021 2022 2023 2024

0.833

0.690

0.622

0.714

0.731 American Mineral Registry · EIA data Source: EIA Natural Gas Annual 2024 · Nov 2025

Source and data: EIA, Natural Gas Annual Table 3

What does the national total include?

The total combines two disposal categories that should remain named when the statistic is quoted. Venting releases gas into the air, while flaring disposes of gas by burning it.

EIA's glossary places both activities at production sites or processing plants. The combined table does not identify the separate volume attributable to each activity. A sentence describing all 335.163 billion cubic feet as flared gas would therefore change the measured category. The source supports a combined venting and flaring statement. (EIA, Annual glossary and production table, Nov 2025).

The matching national denominator is 45,867.761 billion cubic feet of gross withdrawals in 2024. Dividing 335.163 by 45,867.761 and multiplying by 100 yields 0.730716% after rounding to six decimal places. The numerator and denominator share the same calendar year, geographic scope and volume unit. (American Mineral Registry calculations from EIA, Nov 2025).

Gross withdrawals describe the full gas stream rather than gas delivered to a household or a final consumer. The stream includes natural gas plant liquids and nonhydrocarbon gases, while excluding lease condensate. This makes the denominator useful for a production share, but the resulting percentage should be described in that precise way. (EIA, Annual glossary, Nov 2025).

Did the national volume rise or fall during the completed period?

Both answers can be correct when they refer to different endpoints. The published 2024 volume exceeds the preceding year but remains slightly below the 2020 starting point.

The national combined total was 339.272 billion cubic feet in 2020, 287.775 billion in 2021, 271.682 billion in 2022, 324.207 billion in 2023 and 335.163 billion in 2024. The minimum inside this explicitly bounded five observation panel is therefore 2022. This is not a claim about the minimum in all historical EIA records. (EIA, Annual Table 3, Nov 2025).

From 2023 to 2024, combined reported volume increased by 10.956 billion cubic feet, or 3.38%. From 2020 to 2024, it decreased by 4.109 billion cubic feet, or 1.21%. A statement that it simply increased or decreased should always carry its beginning and ending year. (American Mineral Registry calculations from EIA, Nov 2025).

These are calendar year totals. They are not daily averages, a seasonal comparison or observations from a single month. Dividing by days would answer another question and would need to account for the different lengths of the calendar years. The full annual quantities are retained throughout this comparison so no daily and annual measures are mixed.

Why did the share fall more than the volume?

The denominator grew while the disposal volume changed relatively little. A share is a relationship between two quantities, so its movement cannot be understood from the numerator alone.

National gross withdrawals rose from 40,729.927 billion cubic feet in 2020 to 45,867.761 billion in 2024, an increase of 12.61%. Over the same endpoints, the combined vented and flared share fell from 0.832980% to 0.730716% of gross withdrawals. (American Mineral Registry calculations from EIA, Nov 2025).

The share change is a decline of 0.102264 percentage points. Expressed relative to the starting share, it is a decline of 12.28%. Those expressions describe the same two shares using different arithmetic. A 12.28 percentage point decline would be incorrect because the entire starting share was less than one percentage point. (American Mineral Registry calculations from EIA, Nov 2025).

The intervening values matter too. The national share fell to 0.621685% in 2022 before increasing to 0.714118% in 2023 and 0.730716% in 2024. The endpoint improvement does not mean the measure declined every year. The gross, marketed and dry production reference explains the distinct production categories behind this denominator. (American Mineral Registry calculations from EIA, Nov 2025).

Which states reported the largest vented and flared volumes?

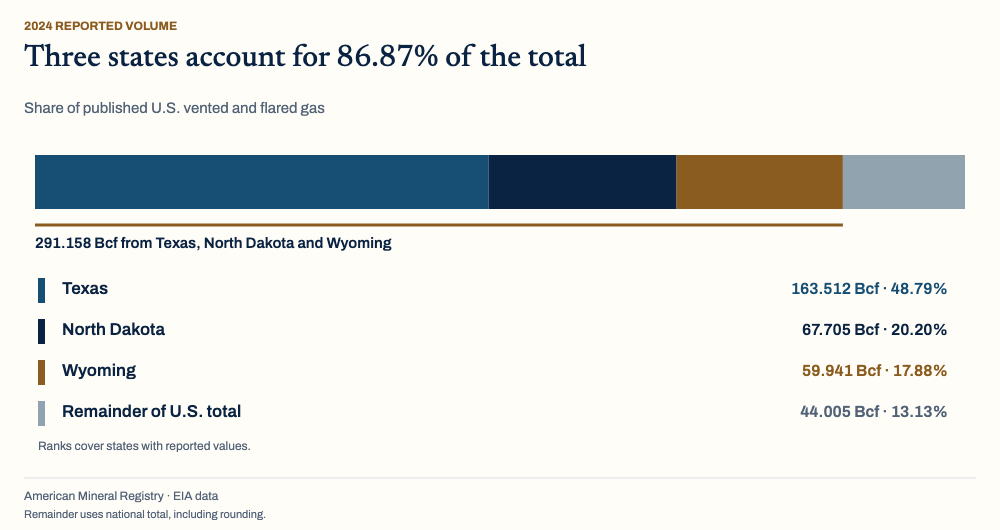
Texas, North Dakota and Wyoming account for most of the published national combined volume in 2024. These comparisons describe the numeric quantities that EIA reports, with unavailable state observations preserved separately rather than assigned artificial places in the ranking.

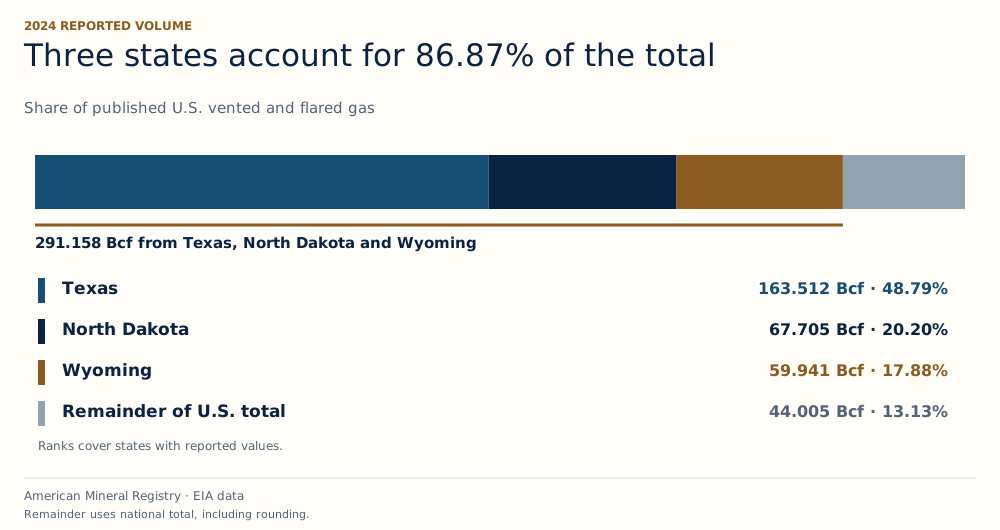
Texas, North Dakota and Wyoming reported 291.158 billion cubic feet of combined vented and flared natural gas in 2024, 86.870567 percent of the published U.S. total; remainder 44.005 billion cubic feet.
Figure 2: Texas, North Dakota and Wyoming contributed 291.158 billion cubic feet, or 86.87% of the published national combined total. Source: EIA, state production and disposal quantities, Nov 2025. Chart drawn by American Mineral Registry from the source figures, checked 14 Nov 2026.

Download original chart (SVG) · Chart image (PNG)

Figure 2 in text

Three reported states account for 86.87 percent Texas, North Dakota and Wyoming reported 291.158 billion cubic feet of combined vented and flared natural gas in 2024, 86.870567 percent of the published U.S. total; remainder 44.005 billion cubic feet.

Read the complete diagram text

2024 REPORTED VOLUME Three states account for 86.87% of the total Share of published U.S. vented and flared gas

291.158 Bcf from Texas, North Dakota and Wyoming

Texas

163.512 Bcf · 48.79%

North Dakota

67.705 Bcf · 20.20%

Wyoming

59.941 Bcf · 17.88%

Remainder of U.S. total

44.005 Bcf · 13.13% Ranks cover states with reported values. American Mineral Registry · EIA data Remainder uses national total, including rounding.

Source and data: EIA, state production and disposal quantities

How much did the reporting volume leaders contribute?

An absolute volume ranking identifies where the source places larger reported quantities. It does not rank legal compliance, equipment quality, emissions intensity or every producer's operating performance.

Texas reported 163.512 billion cubic feet in 2024, representing 48.79% of the published U.S. combined total. North Dakota reported 67.705 billion cubic feet, or 20.20%, and Wyoming reported 59.941 billion, or 17.88%. These are the first three places among states with numeric source quantities. (American Mineral Registry calculations from EIA, Nov 2025).

Their combined 291.158 billion cubic feet equals 86.87% of the national reported total. Adding New Mexico's 17.026 billion cubic feet brings the four state subtotal to 308.184 billion, equivalent to 91.95%. The denominator for each concentration statistic is EIA's reported national total of 335.163 billion cubic feet. (American Mineral Registry calculations from EIA, Nov 2025).

The distinction between a reported national total and complete measurement matters here. The concentration calculation does not fill unavailable state cells or estimate hidden volumes. It tells the reader how the published state quantities relate to the published national quantity. It should not be presented as a new comprehensive emissions inventory.

What do the complete numeric state observations show?

The table below includes every state with a numeric combined volume and a positive matching gross denominator in 2024. The complete geography panel separately retains the states without a defined ratio.

Reporting stateVented and flared, BcfGross withdrawals, BcfShare of grossVolume rankRate rank
Texas163.51212,918.9871.265672%14
North Dakota67.7051,253.3695.401841%22
Wyoming59.9411,343.2904.462253%33
New Mexico17.0263,616.8200.470745%47
Alaska6.3113,549.1650.177816%58
Montana5.49747.60211.547834%61
Utah1.932306.3200.630713%76
Louisiana1.8473,617.3210.051060%89
California1.360125.7511.081502%95
Colorado0.2191,846.8200.011858%1010
Idaho0.0001.1460.000000%1111
Kansas0.000125.9430.000000%1111
South Dakota0.0000.1350.000000%1111

Source quantities and American Mineral Registry calculations use EIA's 2024 Annual state observations. Ranks use the unrounded source quantities and exact fractions. The three source zeros share competition rank eleven. NA observations are excluded from numeric ranking rather than placed below the zeros. (American Mineral Registry compilation and calculations from EIA, Nov 2025).

Why is the federal offshore Gulf outside the state ranking?

The offshore region is part of the source's national geography but is not a state. Keeping it separate prevents double counting and preserves the distinction between a jurisdiction and a production region.

The federal offshore Gulf reported 9.814 billion cubic feet of combined vented and flared gas and 684.665 billion cubic feet of gross withdrawals in 2024. Its matched share is approximately 1.433402%. The region represents about 2.93% of the published national combined volume. It is included in national reconciliation, while remaining outside the state ranks. (American Mineral Registry calculations from EIA, Nov 2025).

State totals already include the onshore and relevant offshore components allocated to those states in the Annual. Adding the detailed subrows to the state total would count the same gas twice. California's detailed federal offshore row is also part of its published state total in this table and must not be added again as a separate geography in the national sum. (EIA, Annual Table 3, Nov 2025).

The same principle applies to basin and operator questions. This dataset has state and source region observations, without a basin allocation or company ownership field. It cannot be relabeled as a basin or operator ranking. Answering those questions requires matching observations at those actual geographic or organizational levels.

Which reporting states had the highest shares of gross withdrawals?

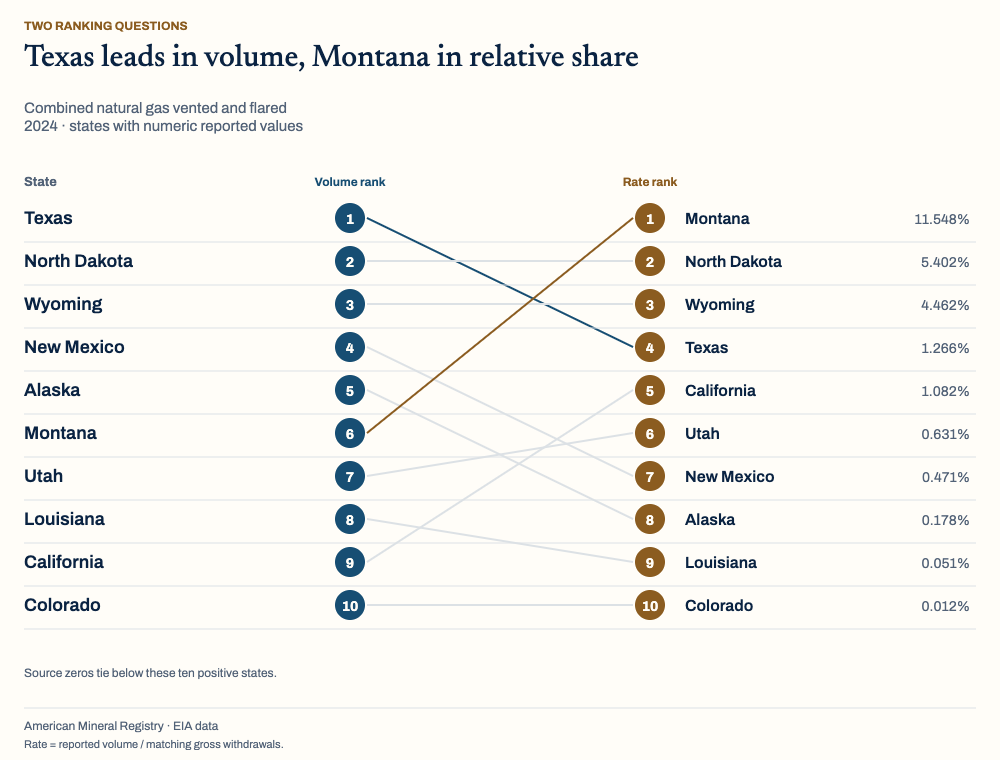
Montana's reported combined disposal quantity is modest beside Texas in absolute terms, but much larger relative to its own gross withdrawals. Separate rankings preserve that difference and prevent a large production base from being mistaken for a high relative disposal share.

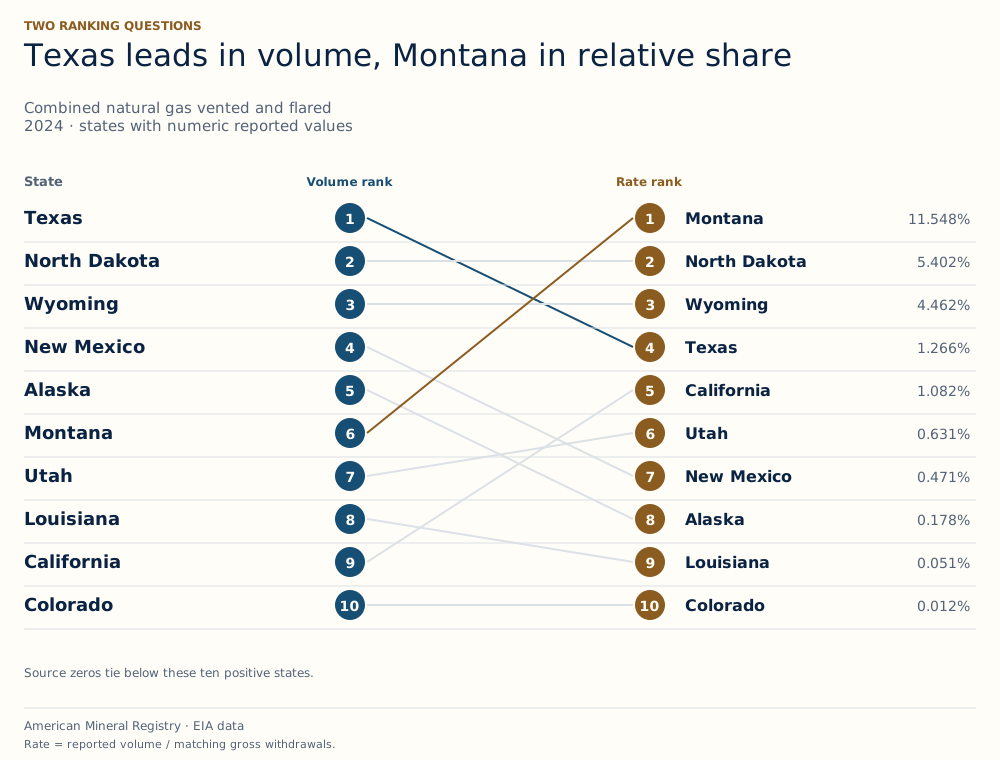
Combined natural gas vented and flared, two separate 2024 state rankings among numeric reported observations: Texas is first by volume and fourth by share of gross withdrawals; Montana is sixth by volume and first by share. Ten positive state observations are shown.
Figure 3: Texas leads the reported volume ranking, while Montana leads the reported share ranking. The denominator changes the question being answered. Source: EIA, matched state numerator and denominator quantities, Nov 2025. Chart drawn by American Mineral Registry from the source figures, checked 14 Nov 2026.

Download original chart (SVG) · Chart image (PNG)

Figure 3 in text

Volume leader and relative share leader differ Combined natural gas vented and flared, two separate 2024 state rankings among numeric reported observations: Texas is first by volume and fourth by share of gross withdrawals; Montana is sixth by volume and first by share. Ten positive state observations are shown.

Read the complete diagram text

TWO RANKING QUESTIONS Texas leads in volume, Montana in relative share Combined natural gas vented and flared 2024 · states with numeric reported values

State

Volume rank

Rate rank

Texas

1

4

Texas 1.266%

North Dakota

2

2

North Dakota 5.402%

Wyoming

3

3

Wyoming 4.462%

New Mexico

4

7

New Mexico 0.471%

Alaska

5

8

Alaska 0.178%

Montana

6

1

Montana 11.548%

Utah

7

6

Utah 0.631%

Louisiana

8

9

Louisiana 0.051%

California

9

5

California 1.082%

Colorado

10

10

Colorado 0.012% Source zeros tie below these ten positive states. American Mineral Registry · EIA data Rate = reported volume / matching gross withdrawals.

Additional phone figure text: 1.266% of gross · 5.402% of gross · 4.462% of gross · 0.471% of gross · 0.178% of gross · 11.548% of gross · 0.631% of gross · 0.051% of gross · 1.082% of gross · 0.012% of gross

Source and data: EIA, matched state numerator and denominator quantities

Why does Montana rank above Texas on the relative measure?

Montana combines a smaller reported volume with a substantially smaller gross production base. The share calculation keeps both quantities visible rather than treating rank as a single universal result.

Montana reported 5,497 million cubic feet of combined vented and flared gas and 47,602 million cubic feet of gross withdrawals in 2024. The ratio is 11.547834%. Texas reported 163,512 million cubic feet against 12,918,987 million cubic feet of gross withdrawals, a ratio of 1.265672%. (American Mineral Registry calculations from EIA, Nov 2025).

Texas therefore ranks first by reported volume but fourth by share among eligible state observations. Montana ranks sixth by reported volume but first by share. North Dakota and Wyoming rank second and third on both measures in this particular year. These are descriptive ranks within the reported sample, rather than evidence that unavailable states have lower shares. (American Mineral Registry calculations from EIA, Nov 2025).

The share measure is also sensitive to what gross withdrawals contain. A state with a large quantity of gas used for repressuring still has that gas in its gross denominator. The ratio remains mathematically consistent, but the operating mix can differ substantially across states. A normalized comparison reduces the effect of size without making every underlying operation identical.

Does a low share show that a state captures all the remaining gas?

No capture percentage is calculated here. A small combined disposal share does not identify every other disposition of gross gas or establish a regulatory compliance result.

Alaska illustrates the distinction. EIA reports 3,549.165 billion cubic feet of gross withdrawals, 3,170.978 billion cubic feet of repressuring and 6.311 billion cubic feet of combined venting and flaring in 2024. Its combined disposal share is 0.177816%, but most of the gross stream in this accounting is used for repressuring rather than simply marketed. (American Mineral Registry calculations from EIA, Nov 2025).

EIA defines repressuring as injecting gas into formations to enhance ultimate recovery. It is a separate production disposition with a different purpose from either venting or flaring. Subtracting the combined disposal share from 100% would include repressuring and other components in the remainder, so it cannot automatically be called a sales or capture percentage. (EIA, Annual glossary, Nov 2025).

These state ratios also do not apply a regulator's eligible production base, permitted exclusions or operator compliance calculation. A reader investigating a legal target should use that rule's own definitions and reporting records. The present share answers the narrower reproducible question of reported combined disposal divided by matching EIA gross withdrawals.

How are zero values and zero denominators treated?

A reported zero is retained as an actual published value. A missing value is retained as missing, and division by a zero production denominator is left undefined.

Idaho, Kansas and South Dakota each have source reported zero combined disposal and positive gross withdrawals in 2024. Their matching gross quantities are 1,146, 125,943 and 135 million cubic feet respectively, so each has a mathematically defined 0% share at the source's reporting precision. (EIA, Annual Table 3, Nov 2025).

Other state summaries describe no gross production and can also show a zero disposal entry. That does not produce a defined zero rate because zero divided by zero has no unique value. These rows remain in the full geography panel, while the ratio field is blank and the state is excluded from the rate ranking. The rule is identical in every year.

The source reports volumes in whole million cubic feet and includes special markers for smaller quantities, unavailable entries and withheld data. A published zero should therefore be described at the source's precision. It is not a measurement claim that no molecule was vented or flared anywhere in that state.

How did reported state volumes and rates change from 2020 to 2024?

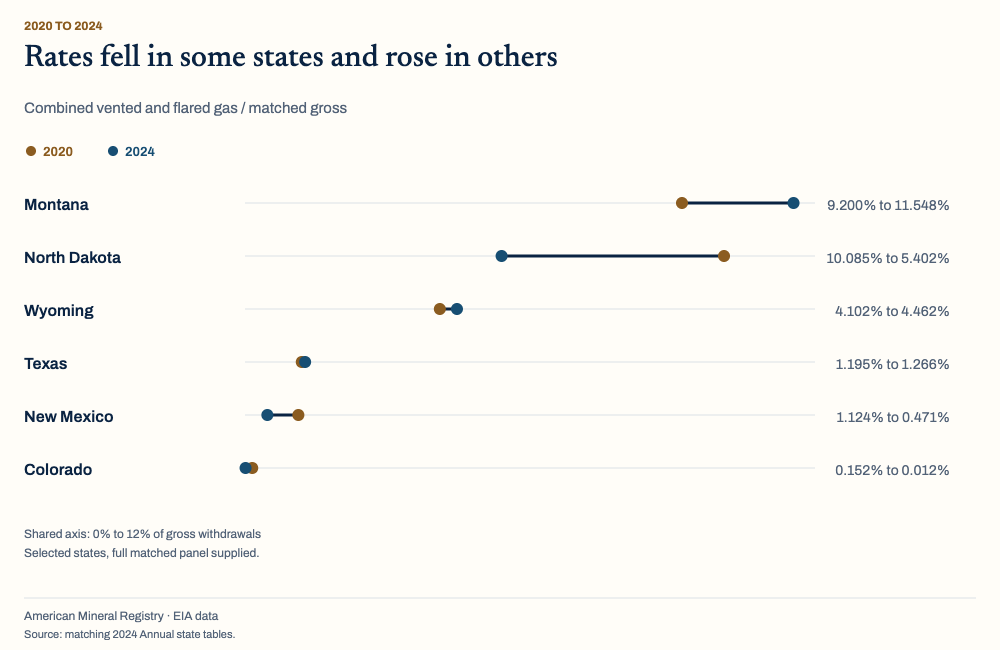
The matched source edition shows several distinct trajectories. Some states reduced the reported volume while gross withdrawals grew, others reduced production faster than disposal, and others increased both quantities. Volume changes and share changes therefore need separate interpretation.

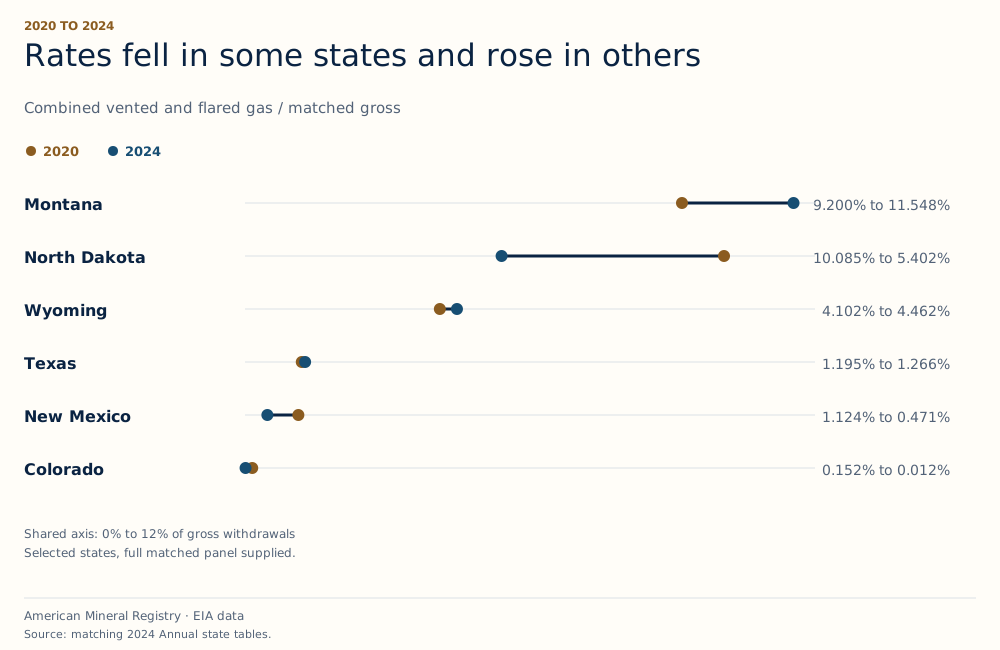
Selected state changes in combined vented and flared gas as a share of matching gross withdrawals, 2020 to 2024: Montana 9.200 to 11.548 percent, North Dakota 10.085 to 5.402, Wyoming 4.102 to 4.462, Texas 1.195 to 1.266, New Mexico 1.124 to 0.471, Colorado 0.152 to 0.012.
Figure 4: North Dakota's reported share fell as its gross withdrawals grew, while Wyoming's share increased even though its combined disposal volume fell slightly. Source: EIA, matching 2020 and 2024 state summaries, Nov 2025. Chart drawn by American Mineral Registry from the source figures, checked 14 Nov 2026.

Download original chart (SVG) · Chart image (PNG)

Figure 4 in text

Matched periods reveal different trajectories Selected state changes in combined vented and flared gas as a share of matching gross withdrawals, 2020 to 2024: Montana 9.200 to 11.548 percent, North Dakota 10.085 to 5.402, Wyoming 4.102 to 4.462, Texas 1.195 to 1.266, New Mexico 1.124 to 0.471, Colorado 0.152 to 0.012.

Read the complete diagram text

2020 TO 2024 Rates fell in some states and rose in others Combined vented and flared gas / matched gross

2020

2024

Montana 9.200% to 11.548%

North Dakota 10.085% to 5.402%

Wyoming 4.102% to 4.462%

Texas 1.195% to 1.266%

New Mexico 1.124% to 0.471%

Colorado 0.152% to 0.012% Shared axis: 0% to 12% of gross withdrawals Selected states, full matched panel supplied. American Mineral Registry · EIA data Source: matching 2024 Annual state tables.

Source and data: EIA, matching 2020 and 2024 state summaries

Which states illustrate falling volume alongside a growing denominator?

North Dakota and New Mexico both report lower combined disposal at the end of the window despite higher gross withdrawals. Their production share changes are therefore larger than their volume changes alone.

North Dakota's reported combined volume fell from 99.532 billion cubic feet in 2020 to 67.705 billion in 2024, a decline of 31.98%. Its gross withdrawals rose from 986.977 billion to 1,253.369 billion cubic feet, an increase of 26.99%. The resulting share fell from 10.084531% to 5.401841%, a decline of 4.682690 percentage points. (American Mineral Registry calculations from EIA, Nov 2025).

New Mexico's combined volume declined from 22.535 billion to 17.026 billion cubic feet, a reduction of 24.45%. Gross withdrawals rose 80.34%, from 2,005.518 billion to 3,616.820 billion cubic feet. The combined disposal share declined from 1.123650% to 0.470745%, or 58.11% relative to its starting share. (American Mineral Registry calculations from EIA, Nov 2025).

Those comparisons describe the reported quantities. They do not isolate the effects of a particular rule, pipeline, facility or company decision. Establishing why a state changed requires additional evidence about those possible mechanisms, reporting changes and the production mix. The panel itself supports the numerical change rather than a causal attribution.

Can the share rise when the absolute volume falls?

Yes. When the denominator contracts more quickly than the numerator, the remaining numerator accounts for a larger share of the total.

Wyoming's reported combined volume fell from 60.415 billion cubic feet in 2020 to 59.941 billion in 2024, a decline of 0.78%. Its gross withdrawals fell 8.80%, from 1,472.873 billion to 1,343.290 billion cubic feet. The share therefore increased from 4.101847% to 4.462253%, a rise of 0.360406 percentage points. (American Mineral Registry calculations from EIA, Nov 2025).

Texas shows a different pattern. Its combined volume increased 30.46%, from 125.336 billion to 163.512 billion cubic feet, while gross withdrawals increased 23.16%. Its share increased from 1.194845% to 1.265672%, a rise of 0.070827 percentage points. Both quantities grew, but the numerator grew faster. (American Mineral Registry calculations from EIA, Nov 2025).

Montana's volume increased 42.04% while gross withdrawals increased 13.16%, taking its share from 9.199610% to 11.547834%. Colorado's volume declined 92.81% while gross withdrawals declined 7.65%, taking its share from 0.152216% to 0.011858%. These contrasts explain why the full data preserves quantities, percentage changes and percentage point changes separately. (American Mineral Registry calculations from EIA, Nov 2025).

Why is the historical appendix separate from the five year comparison?

A long record is useful only when its reporting conventions and publication vintage are visible. The earlier records are retained as archived published snapshots, rather than used to manufacture an uninterrupted comparable trend.

EIA's notes explain that unavailable nonmarketed components could be estimated from historic ratios in 2011. From 2012 forward, such components were reported as NA when not available directly from states. The archive therefore begins at that documented reporting boundary and retains the original Annual Table 3 snapshots for 2012 through 2019. (EIA, notes accompanying the current production series, Oct 2026).

Each archive row identifies its own Annual edition. Subsequent revisions or availability changes can produce differences from the historical workbook retrieved in October 2026. The separate comparison download records numeric revisions and marker differences instead of treating them as changes in physical production. The main changes on this page use only the matching 2020 through 2024 observations published together in the 2024 edition.

The current interactive production interface also contains some 2025 production values while combined venting and flaring ends in 2024. Those unmatched later values are preserved in an exclusion audit and never enter a 2025 state rate or rank. A more recent denominator does not create a more recent matched observation. (EIA, production series, Oct 2026).

Why do EIA tables disagree about state coverage and zeros?

The original Annual PDFs and the changing historical spreadsheet interface can display different availability markers. A valid comparison preserves the publication it analyzes, records those differences and checks rounded totals, without converting unavailable state quantities into measured zeros.

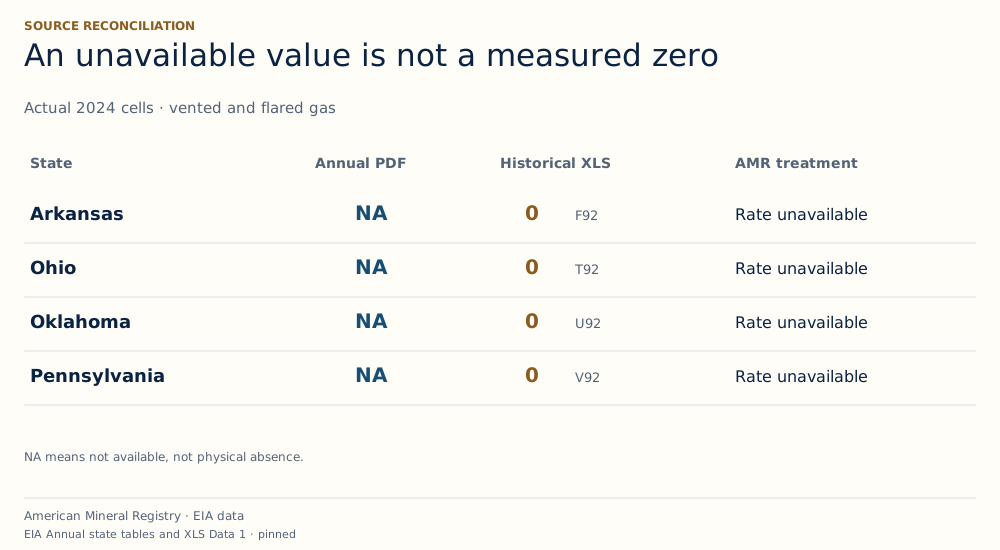
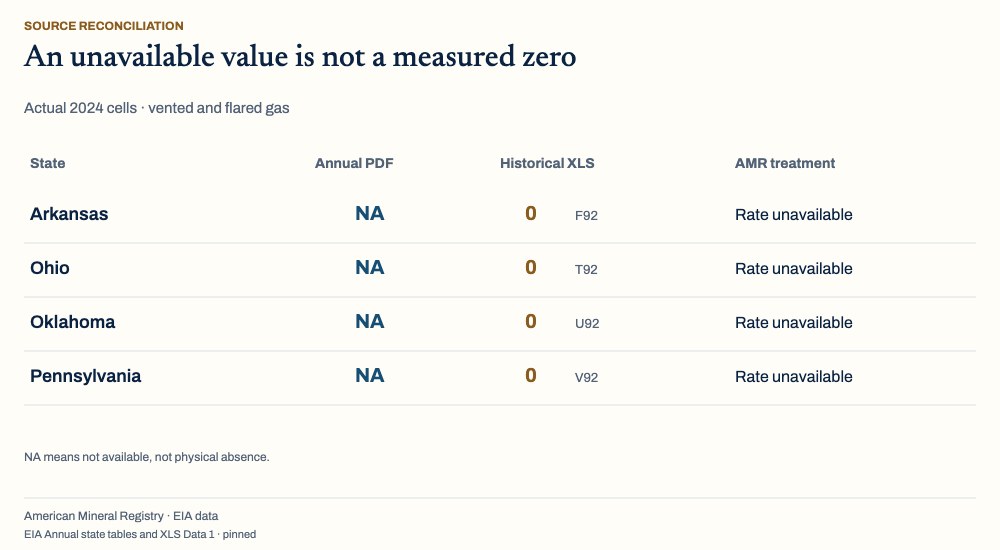
2024 Annual PDF labels vented and flared gas NA for Arkansas, Ohio, Oklahoma and Pennsylvania, while corresponding historical XLS cells show zero. These Annual NA cells have no calculated rate and are excluded from numeric state rankings.
Figure 5: The four displayed Annual NA observations are excluded from numeric rate comparisons, even though the historical XLS interface displays zero in the matching cells. Source: EIA, Annual Table 3, Nov 2025; EIA, historical disposal workbook, Oct 2026. Chart drawn by American Mineral Registry from the source figures, checked 14 Nov 2026.

Download original chart (SVG) · Chart image (PNG)

Figure 5 in text

An unavailable observation is not a measured zero 2024 Annual PDF labels vented and flared gas NA for Arkansas, Ohio, Oklahoma and Pennsylvania, while corresponding historical XLS cells show zero. These Annual NA cells have no calculated rate and are excluded from numeric state rankings.

Read the complete diagram text

SOURCE RECONCILIATION An unavailable value is not a measured zero Actual 2024 cells · vented and flared gas

State

Annual PDF

Historical XLS

AMR treatment

Arkansas

NA

0 F92 Rate unavailable

Ohio

NA

0 T92 Rate unavailable

Oklahoma

NA

0 U92 Rate unavailable

Pennsylvania

NA

0 V92 Rate unavailable NA means not available, not physical absence. American Mineral Registry · EIA data EIA Annual state tables and XLS Data 1 · pinned

Additional phone figure text: Annual state table: NA · Historical XLS F92: 0 · Rate unavailable, excluded from ranking · Historical XLS T92: 0 · Historical XLS U92: 0 · Historical XLS V92: 0

Source and data: EIA, Annual Table 3 · EIA, historical disposal workbook

What is the concrete NA versus zero discrepancy?

The discrepancy can be checked at exact source cells. It is a reason to inspect the original markers rather than assume every numeric spreadsheet cell represents a complete state observation.

In Annual Table 3, the 2024 combined vented and flared entries for Arkansas, Ohio, Oklahoma and Pennsylvania are each NA. In the downloaded historical workbook, Data 1 cells F92, T92, U92 and V92 respectively display numeric zero. This analysis preserves the Annual's NA treatment for those state observations. (EIA, Annual Table 3, Nov 2025; EIA, historical workbook, Oct 2026).

The difference affects major production quantities. Pennsylvania alone has 7,422.303 billion cubic feet of gross withdrawals in the 2024 Annual, while its combined disposal entry is unavailable. The missing numerator prevents a defined source based rate; the existence of a large denominator does not fill it. (EIA, Annual Table 3, Nov 2025).

The source note says some NA quantities are assumed negligible in the source's own treatment. It does not identify every NA state as a measured zero. The dataset therefore keeps each raw marker and leaves the relevant calculation unavailable. No negative finding about disposal in a missing state is inferred from that note. (EIA, Annual Table 3 notes, Nov 2025).

How complete is the state comparison?

The geography transcription is complete for the defined publication, while measurement availability varies. Those are different forms of completeness and should not be collapsed into one claim.

The main panel transcribes all fifty state summaries, the District of Columbia, the federal offshore Gulf and the national total for each year from 2020 through 2024. In 2024, 34 states have positive numeric gross withdrawals. Thirteen of those states have numeric combined disposal entries, while twenty one have unavailable entries. (American Mineral Registry compilation of EIA, Nov 2025).

The twenty one producing states with unavailable combined volume account for 16,430.428 billion cubic feet of gross withdrawals in the 2024 source panel. That is a quantity of production associated with missing disposal entries, not an estimate of gas vented or flared. It is provided to show the scale of the denominator excluded from a numeric state rate ranking. (American Mineral Registry calculations from EIA, Nov 2025).

The availability audit also preserves nonproducing state summaries, actual source zeros, other markers and the relevant year. A state can be present in the geographic universe while lacking a ratio. A published table with every state's name can therefore still be an incomplete measurement comparison if unavailable entries are silently represented as zero.

Do the state quantities reconcile with the national total?

They reconcile within the small differences expected from independently rounded published quantities. The check uses the correct geography level and never adds state totals to their own subcomponents.

For 2024, the sum of numeric state and Gulf combined volumes is 335,164 million cubic feet, compared with the published U.S. total of 335,163 million cubic feet. The national total less the geography sum is therefore negative one million cubic feet. That signed residual is retained in the national reconciliation download. (American Mineral Registry calculations from EIA, Nov 2025).

The same check yields residuals of negative one, zero, positive one, zero and negative one million cubic feet from 2020 through 2024 respectively. EIA notes that independently rounded or withheld components may not equal totals. These residuals do not justify inventing an extra state observation or altering a source number to force exact equality. (American Mineral Registry calculations from EIA, Nov 2025).

A close published sum is not proof that every underlying disposal activity has been measured. It establishes an accounting relationship among the reported cells. Availability, measurement method and rounding remain distinct issues, each documented in the data and source notes.

What does the production accounting show, and how can these figures be cited?

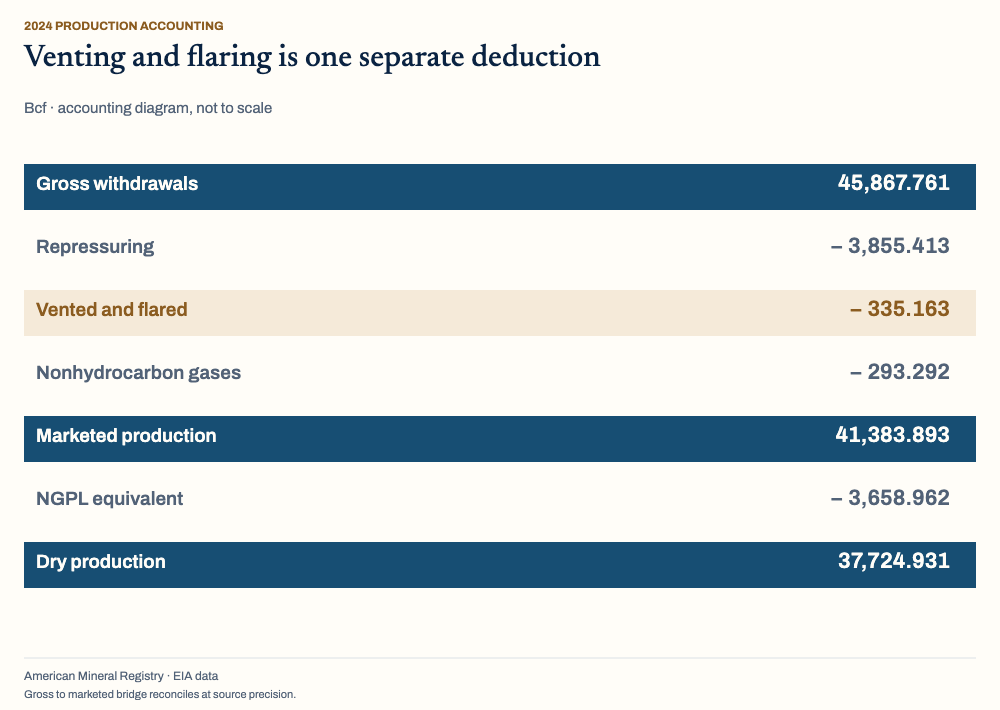
Combined venting and flaring is one deduction between gross withdrawals and marketed production. The accounting places the statistic in context, while the reusable tables and exact finding links let another writer quote the appropriate quantity with its scope and denominator intact.

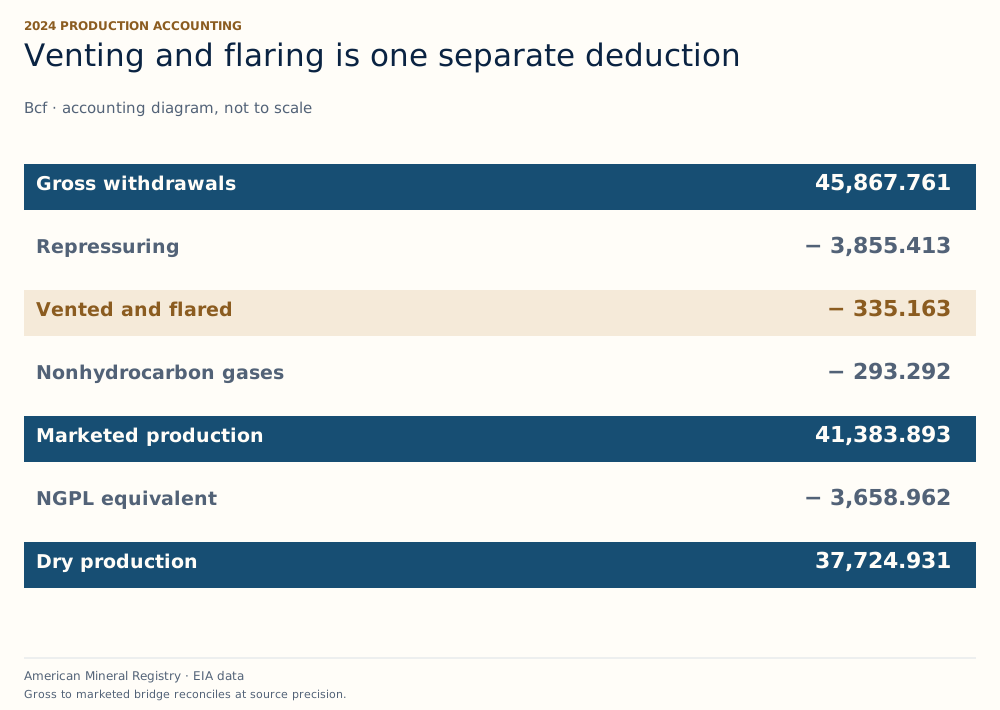
2024 national production accounting in billion cubic feet: gross withdrawals 45,867.761, less repressuring 3,855.413, vented and flared 335.163 and nonhydrocarbon gases 293.292, equals marketed production 41,383.893; less natural gas plant liquids equivalent 3,658.962 equals dry production 37,724.931.
Figure 6: The 2024 gross to marketed bridge contains separate repressuring, combined disposal and nonhydrocarbon deductions. Marketed to dry production then removes the plant liquids gaseous equivalent. Source: EIA, complete national production accounting, Nov 2025. Chart drawn by American Mineral Registry from the source figures, checked 14 Nov 2026.

Download original chart (SVG) · Chart image (PNG)

Figure 6 in text

Venting and flaring is one production deduction 2024 national production accounting in billion cubic feet: gross withdrawals 45,867.761, less repressuring 3,855.413, vented and flared 335.163 and nonhydrocarbon gases 293.292, equals marketed production 41,383.893; less natural gas plant liquids equivalent 3,658.962 equals dry production 37,724.931.

Read the complete diagram text

2024 PRODUCTION ACCOUNTING Venting and flaring is one separate deduction Bcf · accounting diagram, not to scale

Gross withdrawals

45,867.761

Repressuring

− 3,855.413

Vented and flared

− 335.163

Nonhydrocarbon gases

− 293.292

Marketed production

41,383.893

NGPL equivalent

− 3,658.962

Dry production

37,724.931 American Mineral Registry · EIA data Gross to marketed bridge reconciles at source precision.

Source and data: EIA, complete national production accounting

How do gross withdrawals become marketed and dry production?

The category bridge prevents the full difference between gross and dry gas from being mislabeled as vented or flared volume. Each deduction has a separate source definition.

In 2024, EIA reports 45,867.761 billion cubic feet gross withdrawals, 3,855.413 billion cubic feet repressuring, 335.163 billion cubic feet combined venting and flaring and 293.292 billion cubic feet nonhydrocarbon gases removed. Subtracting the three dispositions yields 41,383.893 billion cubic feet of marketed production at the table's published precision. (EIA, Annual Table 3, Nov 2025).

Subtracting the 3,658.962 billion cubic feet gaseous equivalent of natural gas plant liquids from marketed production yields 37,724.931 billion cubic feet of dry production. Plant liquids extraction is a different category from disposal and should retain its own label. (EIA, Annual Table 3, Nov 2025).

Using marketed or dry production as the denominator would answer a different share question. This page consistently uses gross withdrawals because the numerator is a disposition of that gross stream. The separate gross, marketed and dry production reference provides the broader category guide, while the proved oil reserves reference distinguishes annual flow quantities from recoverable reserve estimates.

Can physical volumes establish lost revenue, savings or emissions?

The supplied data does not establish any of those amounts. Converting a physical quantity into an economic or environmental outcome requires additional inputs that this panel does not provide.

The combined numerator does not separate venting from burning, identify gas composition, measure flare combustion efficiency or state how much gas could actually be recovered. It also does not identify gathering capacity, treatment needs, transportation costs, contractual ownership or an available transaction price. The source categories therefore support a physical disposal statistic, without supporting an actual lost profit or avoided emissions calculation. (EIA, Annual glossary, Nov 2025).

Multiplying combined cubic feet by a headline gas price would be an illustrative gross arithmetic exercise, not demonstrated recoverable revenue. Comparing the result with household bills would add another set of delivery, energy content and price assumptions. Neither calculation is part of the dataset or its citation findings.

A comparison with satellite observed global flaring would likewise need a distinct measurement crosswalk. A flaring only estimate, a combined disposal quantity and an emissions inventory do not become interchangeable because they all concern natural gas. This reference keeps its EIA combined category rather than importing an unmatched global percentage or financial equivalence.

What should a reusable citation preserve?

A useful citation identifies the actual observation and the exact derived contribution. It credits EIA for source quantities and American Mineral Registry for the compilation or calculation being reused.

For a state rate, retain the state, calendar year, combined venting and flaring category, gross withdrawal denominator and eligible reported state scope. For a concentration statistic, retain the named state group and the published national denominator. For a change, retain both endpoints and distinguish a relative percentage change from a percentage point change.

The individual findings below provide permanent links, matching downloads and plain or HTML attribution. The full data tables retain every analytical row, so a writer can inspect an observation without reading values from a graphic. The data dictionary explains units, source markers, definitions and exact calculation rules. Reproduction uses pinned local inputs and does not silently fetch a later release.

EIA's landing page identifies the completed 2024 edition, originally released November 28, 2025 and reissued February 6, 2026. It lists the next release as November 2026 without an exact day. The reissue notice concerns Louisiana pipeline and distribution use and related consumption statistics. This article does not imply that a November 2026 authoring date makes the observations 2026 production data. (EIA, Annual release information, Feb 2026; EIA, correction notice, Feb 2026).

Methodology and Sources

American Mineral Registry transcribed the pinned 2024 Annual national and state tables, retained source markers and matched calendar year, geography, category and units before calculating rates. Decimal arithmetic produces six decimal share outputs; exact integer cross multiplication determines rate ranks. All fifty state summaries, District of Columbia, offshore Gulf and national total remain in the core panel. Nonpositive or unavailable denominators produce no rate. Independent checks reconcile national components, geography sums, source cells, ranks and graphic inputs. Earlier Annual snapshots remain a separate vintage audit, and unmatched 2025 series values are excluded. Current historical workbooks are compared with the Annual without replacing its NA markers. Source URLs, hashes, publication editions, exact cell locators, complete CSVs, calculation programs and graphics are supplied for inspection and reproduction.

Glossary

  • Venting: Gas released into the air at a production site or processing plant, as defined by EIA.
  • Flaring: Disposal of gas by burning in a flare, as defined by EIA.
  • Combined vented and flared volume: The source category adding those two disposal activities without separating their individual quantities.
  • Gross withdrawals: The full well stream gas quantity, including plant liquids and nonhydrocarbon gases, excluding lease condensate.
  • Marketed production: Gross withdrawals after subtracting repressuring, combined venting and flaring and nonhydrocarbon gases removed.
  • Dry production: Marketed production after subtracting the gaseous equivalent associated with plant liquids extraction.
  • Repressuring: Gas injection into formations to enhance ultimate recovery, a disposition separate from disposal.
  • Bcf and MMcf: Billion and million cubic feet respectively. One Bcf equals one thousand MMcf.
  • Percentage point: The arithmetic difference between two percentages, distinct from their relative percent change.
  • Source vintage: The publication edition or release that supplies an observation, separate from the observation's calendar year.
  • NA: EIA's not available marker. It is retained as a missing observation rather than converted into a zero.

Sources

Cite a specific finding

Copy a finding with its exact period, denominator and primary source. The permanent link lands on the supporting evidence.

U.S. combined disposal and matching gross share

EIA reports 335.163 billion cubic feet of combined natural gas vented and flared in the United States in 2024. American Mineral Registry calculates this as 0.730716% of the matching 45,867.761 billion cubic feet of gross withdrawals.

American Mineral Registry. EIA reports 335.163 billion cubic feet of combined natural gas vented and flared in the United States in 2024. American Mineral Registry calculates this as 0.730716% of the matching 45,867.761 billion cubic feet of gross withdrawals. EIA reported combined venting AND flaring, not flaring only or emissions. Rates divide by the same state and year gross withdrawals. State ranks cover only numeric source observations with a positive gross denominator; unavailable states are excluded, not assigned zero. American Mineral Registry compilation and calculations from EIA. https://americanmineralregistry.com/research/us-natural-gas-venting-flaring-statistics#gas-us-2024-matched-share Primary sources: https://www.eia.gov/naturalgas/annual/pdf/table_003.pdf
Copy HTML attribution<a href="https://americanmineralregistry.com/research/us-natural-gas-venting-flaring-statistics#gas-us-2024-matched-share">American Mineral Registry</a>. EIA reports 335.163 billion cubic feet of combined natural gas vented and flared in the United States in 2024. American Mineral Registry calculates this as 0.730716% of the matching 45,867.761 billion cubic feet of gross withdrawals. EIA reported combined venting AND flaring, not flaring only or emissions. Rates divide by the same state and year gross withdrawals. State ranks cover only numeric source observations with a positive gross denominator; unavailable states are excluded, not assigned zero. American Mineral Registry compilation and calculations from EIA. Primary sources: <a href="https://www.eia.gov/naturalgas/annual/pdf/table_003.pdf">Original primary source</a>.

Permanent finding link · Matching data (CSV) · Original producer source

Texas reported volume and national share

Among states with numeric EIA observations, Texas reported the largest combined vented and flared natural gas volume in 2024, 163.512 billion cubic feet. American Mineral Registry calculates its share of the published U.S. combined total at 48.785815%, and its share of matching Texas gross withdrawals at 1.265672%.

American Mineral Registry. Among states with numeric EIA observations, Texas reported the largest combined vented and flared natural gas volume in 2024, 163.512 billion cubic feet. American Mineral Registry calculates its share of the published U.S. combined total at 48.785815%, and its share of matching Texas gross withdrawals at 1.265672%. EIA reported combined venting AND flaring, not flaring only or emissions. Rates divide by the same state and year gross withdrawals. State ranks cover only numeric source observations with a positive gross denominator; unavailable states are excluded, not assigned zero. American Mineral Registry compilation and calculations from EIA. https://americanmineralregistry.com/research/us-natural-gas-venting-flaring-statistics#gas-texas-2024-volume-leader Primary sources: https://www.eia.gov/naturalgas/annual/pdf/table_003.pdf
Copy HTML attribution<a href="https://americanmineralregistry.com/research/us-natural-gas-venting-flaring-statistics#gas-texas-2024-volume-leader">American Mineral Registry</a>. Among states with numeric EIA observations, Texas reported the largest combined vented and flared natural gas volume in 2024, 163.512 billion cubic feet. American Mineral Registry calculates its share of the published U.S. combined total at 48.785815%, and its share of matching Texas gross withdrawals at 1.265672%. EIA reported combined venting AND flaring, not flaring only or emissions. Rates divide by the same state and year gross withdrawals. State ranks cover only numeric source observations with a positive gross denominator; unavailable states are excluded, not assigned zero. American Mineral Registry compilation and calculations from EIA. Primary sources: <a href="https://www.eia.gov/naturalgas/annual/pdf/table_003.pdf">Original primary source</a>.

Permanent finding link · Matching data (CSV) · Original producer source

Montana reported share and separate volume rank

Among states with numeric EIA observations and positive gross withdrawals, Montana had the highest reported combined vented and flared share in 2024, 11.547834%. Its 5.497 billion cubic feet was sixth by volume; Texas was first by volume and fourth by share. American Mineral Registry calculations use matched source quantities.

American Mineral Registry. Among states with numeric EIA observations and positive gross withdrawals, Montana had the highest reported combined vented and flared share in 2024, 11.547834%. Its 5.497 billion cubic feet was sixth by volume; Texas was first by volume and fourth by share. American Mineral Registry calculations use matched source quantities. EIA reported combined venting AND flaring, not flaring only or emissions. Rates divide by the same state and year gross withdrawals. State ranks cover only numeric source observations with a positive gross denominator; unavailable states are excluded, not assigned zero. American Mineral Registry compilation and calculations from EIA. https://americanmineralregistry.com/research/us-natural-gas-venting-flaring-statistics#gas-montana-2024-production-share Primary sources: https://www.eia.gov/naturalgas/annual/pdf/table_003.pdf
Copy HTML attribution<a href="https://americanmineralregistry.com/research/us-natural-gas-venting-flaring-statistics#gas-montana-2024-production-share">American Mineral Registry</a>. Among states with numeric EIA observations and positive gross withdrawals, Montana had the highest reported combined vented and flared share in 2024, 11.547834%. Its 5.497 billion cubic feet was sixth by volume; Texas was first by volume and fourth by share. American Mineral Registry calculations use matched source quantities. EIA reported combined venting AND flaring, not flaring only or emissions. Rates divide by the same state and year gross withdrawals. State ranks cover only numeric source observations with a positive gross denominator; unavailable states are excluded, not assigned zero. American Mineral Registry compilation and calculations from EIA. Primary sources: <a href="https://www.eia.gov/naturalgas/annual/pdf/table_003.pdf">Original primary source</a>.

Permanent finding link · Matching data (CSV) · Original producer source

Three state concentration in reported U.S. total

Texas, North Dakota and Wyoming reported 291.158 billion cubic feet of combined vented and flared natural gas in 2024. American Mineral Registry calculates this as 86.870567% of EIA's published U.S. combined total of 335.163 billion cubic feet. The calculation does not estimate unavailable state quantities.

American Mineral Registry. Texas, North Dakota and Wyoming reported 291.158 billion cubic feet of combined vented and flared natural gas in 2024. American Mineral Registry calculates this as 86.870567% of EIA's published U.S. combined total of 335.163 billion cubic feet. The calculation does not estimate unavailable state quantities. EIA reported combined venting AND flaring, not flaring only or emissions. Rates divide by the same state and year gross withdrawals. State ranks cover only numeric source observations with a positive gross denominator; unavailable states are excluded, not assigned zero. American Mineral Registry compilation and calculations from EIA. https://americanmineralregistry.com/research/us-natural-gas-venting-flaring-statistics#gas-three-state-2024-concentration Primary sources: https://www.eia.gov/naturalgas/annual/pdf/table_003.pdf
Copy HTML attribution<a href="https://americanmineralregistry.com/research/us-natural-gas-venting-flaring-statistics#gas-three-state-2024-concentration">American Mineral Registry</a>. Texas, North Dakota and Wyoming reported 291.158 billion cubic feet of combined vented and flared natural gas in 2024. American Mineral Registry calculates this as 86.870567% of EIA&#x27;s published U.S. combined total of 335.163 billion cubic feet. The calculation does not estimate unavailable state quantities. EIA reported combined venting AND flaring, not flaring only or emissions. Rates divide by the same state and year gross withdrawals. State ranks cover only numeric source observations with a positive gross denominator; unavailable states are excluded, not assigned zero. American Mineral Registry compilation and calculations from EIA. Primary sources: <a href="https://www.eia.gov/naturalgas/annual/pdf/table_003.pdf">Original primary source</a>.

Permanent finding link · Matching data (CSV) · Original producer source

National volume and share moved by different amounts

From 2020 to 2024 in the fixed 2024 EIA Annual edition, reported U.S. combined vented and flared natural gas volume fell 1.211123%, while gross withdrawals rose 12.614395%. American Mineral Registry calculates that the combined disposal share fell from 0.832980% to 0.730716%, a relative decline of 12.276866% or 0.102264 percentage points.

American Mineral Registry. From 2020 to 2024 in the fixed 2024 EIA Annual edition, reported U.S. combined vented and flared natural gas volume fell 1.211123%, while gross withdrawals rose 12.614395%. American Mineral Registry calculates that the combined disposal share fell from 0.832980% to 0.730716%, a relative decline of 12.276866% or 0.102264 percentage points. EIA reported combined venting AND flaring, not flaring only or emissions. Rates divide by the same state and year gross withdrawals. State ranks cover only numeric source observations with a positive gross denominator; unavailable states are excluded, not assigned zero. American Mineral Registry compilation and calculations from EIA. https://americanmineralregistry.com/research/us-natural-gas-venting-flaring-statistics#gas-us-2020-2024-volume-share-change Primary sources: https://www.eia.gov/naturalgas/annual/pdf/table_003.pdf
Copy HTML attribution<a href="https://americanmineralregistry.com/research/us-natural-gas-venting-flaring-statistics#gas-us-2020-2024-volume-share-change">American Mineral Registry</a>. From 2020 to 2024 in the fixed 2024 EIA Annual edition, reported U.S. combined vented and flared natural gas volume fell 1.211123%, while gross withdrawals rose 12.614395%. American Mineral Registry calculates that the combined disposal share fell from 0.832980% to 0.730716%, a relative decline of 12.276866% or 0.102264 percentage points. EIA reported combined venting AND flaring, not flaring only or emissions. Rates divide by the same state and year gross withdrawals. State ranks cover only numeric source observations with a positive gross denominator; unavailable states are excluded, not assigned zero. American Mineral Registry compilation and calculations from EIA. Primary sources: <a href="https://www.eia.gov/naturalgas/annual/pdf/table_003.pdf">Original primary source</a>.

Permanent finding link · Matching data (CSV) · Original producer source

North Dakota matched volume and production share change

From 2020 to 2024 in the fixed EIA Annual edition, North Dakota's reported combined vented and flared volume fell 31.976651%, from 99.532 to 67.705 billion cubic feet, while gross withdrawals rose 26.990700%. American Mineral Registry calculates the share of matching gross withdrawals fell from 10.084531% to 5.401841%.

American Mineral Registry. From 2020 to 2024 in the fixed EIA Annual edition, North Dakota's reported combined vented and flared volume fell 31.976651%, from 99.532 to 67.705 billion cubic feet, while gross withdrawals rose 26.990700%. American Mineral Registry calculates the share of matching gross withdrawals fell from 10.084531% to 5.401841%. EIA reported combined venting AND flaring, not flaring only or emissions. Rates divide by the same state and year gross withdrawals. State ranks cover only numeric source observations with a positive gross denominator; unavailable states are excluded, not assigned zero. American Mineral Registry compilation and calculations from EIA. https://americanmineralregistry.com/research/us-natural-gas-venting-flaring-statistics#gas-north-dakota-2020-2024-change Primary sources: https://www.eia.gov/naturalgas/annual/pdf/table_003.pdf; https://www.eia.gov/naturalgas/annual/pdf/nga24.pdf
Copy HTML attribution<a href="https://americanmineralregistry.com/research/us-natural-gas-venting-flaring-statistics#gas-north-dakota-2020-2024-change">American Mineral Registry</a>. From 2020 to 2024 in the fixed EIA Annual edition, North Dakota&#x27;s reported combined vented and flared volume fell 31.976651%, from 99.532 to 67.705 billion cubic feet, while gross withdrawals rose 26.990700%. American Mineral Registry calculates the share of matching gross withdrawals fell from 10.084531% to 5.401841%. EIA reported combined venting AND flaring, not flaring only or emissions. Rates divide by the same state and year gross withdrawals. State ranks cover only numeric source observations with a positive gross denominator; unavailable states are excluded, not assigned zero. American Mineral Registry compilation and calculations from EIA. Primary sources: <a href="https://www.eia.gov/naturalgas/annual/pdf/table_003.pdf">Original primary source</a>; <a href="https://www.eia.gov/naturalgas/annual/pdf/nga24.pdf">EIA complete state summaries</a>.

Permanent finding link · Matching data (CSV) · Original producer source

EIA complete state summaries

New Mexico numerator and denominator divergence

From 2020 to 2024 in the fixed EIA Annual edition, New Mexico's reported combined vented and flared volume fell 24.446417%, while matching gross withdrawals rose 80.343432%. American Mineral Registry calculates the combined disposal share declined from 1.123650% to 0.470745%, a relative share decline of 58.105720%.

American Mineral Registry. From 2020 to 2024 in the fixed EIA Annual edition, New Mexico's reported combined vented and flared volume fell 24.446417%, while matching gross withdrawals rose 80.343432%. American Mineral Registry calculates the combined disposal share declined from 1.123650% to 0.470745%, a relative share decline of 58.105720%. EIA reported combined venting AND flaring, not flaring only or emissions. Rates divide by the same state and year gross withdrawals. State ranks cover only numeric source observations with a positive gross denominator; unavailable states are excluded, not assigned zero. American Mineral Registry compilation and calculations from EIA. https://americanmineralregistry.com/research/us-natural-gas-venting-flaring-statistics#gas-new-mexico-2020-2024-change Primary sources: https://www.eia.gov/naturalgas/annual/pdf/table_003.pdf; https://www.eia.gov/naturalgas/annual/pdf/nga24.pdf
Copy HTML attribution<a href="https://americanmineralregistry.com/research/us-natural-gas-venting-flaring-statistics#gas-new-mexico-2020-2024-change">American Mineral Registry</a>. From 2020 to 2024 in the fixed EIA Annual edition, New Mexico&#x27;s reported combined vented and flared volume fell 24.446417%, while matching gross withdrawals rose 80.343432%. American Mineral Registry calculates the combined disposal share declined from 1.123650% to 0.470745%, a relative share decline of 58.105720%. EIA reported combined venting AND flaring, not flaring only or emissions. Rates divide by the same state and year gross withdrawals. State ranks cover only numeric source observations with a positive gross denominator; unavailable states are excluded, not assigned zero. American Mineral Registry compilation and calculations from EIA. Primary sources: <a href="https://www.eia.gov/naturalgas/annual/pdf/table_003.pdf">Original primary source</a>; <a href="https://www.eia.gov/naturalgas/annual/pdf/nga24.pdf">EIA complete state summaries</a>.

Permanent finding link · Matching data (CSV) · Original producer source

EIA complete state summaries

Wyoming share rose despite a smaller disposal volume

From 2020 to 2024 in the fixed EIA Annual edition, Wyoming's reported combined vented and flared gas volume fell 0.784573%, but matching gross withdrawals fell 8.797975%. American Mineral Registry calculates that the combined disposal share rose from 4.101847% to 4.462253%, an increase of 0.360406 percentage points.

American Mineral Registry. From 2020 to 2024 in the fixed EIA Annual edition, Wyoming's reported combined vented and flared gas volume fell 0.784573%, but matching gross withdrawals fell 8.797975%. American Mineral Registry calculates that the combined disposal share rose from 4.101847% to 4.462253%, an increase of 0.360406 percentage points. EIA reported combined venting AND flaring, not flaring only or emissions. Rates divide by the same state and year gross withdrawals. State ranks cover only numeric source observations with a positive gross denominator; unavailable states are excluded, not assigned zero. American Mineral Registry compilation and calculations from EIA. https://americanmineralregistry.com/research/us-natural-gas-venting-flaring-statistics#gas-wyoming-2020-2024-denominator Primary sources: https://www.eia.gov/naturalgas/annual/pdf/table_003.pdf; https://www.eia.gov/naturalgas/annual/pdf/nga24.pdf
Copy HTML attribution<a href="https://americanmineralregistry.com/research/us-natural-gas-venting-flaring-statistics#gas-wyoming-2020-2024-denominator">American Mineral Registry</a>. From 2020 to 2024 in the fixed EIA Annual edition, Wyoming&#x27;s reported combined vented and flared gas volume fell 0.784573%, but matching gross withdrawals fell 8.797975%. American Mineral Registry calculates that the combined disposal share rose from 4.101847% to 4.462253%, an increase of 0.360406 percentage points. EIA reported combined venting AND flaring, not flaring only or emissions. Rates divide by the same state and year gross withdrawals. State ranks cover only numeric source observations with a positive gross denominator; unavailable states are excluded, not assigned zero. American Mineral Registry compilation and calculations from EIA. Primary sources: <a href="https://www.eia.gov/naturalgas/annual/pdf/table_003.pdf">Original primary source</a>; <a href="https://www.eia.gov/naturalgas/annual/pdf/nga24.pdf">EIA complete state summaries</a>.

Permanent finding link · Matching data (CSV) · Original producer source

EIA complete state summaries

Colorado reported decline with matched denominator

From 2020 to 2024 in the fixed EIA Annual edition, Colorado's reported combined vented and flared gas volume declined 92.805519%, from 3.044 to 0.219 billion cubic feet. American Mineral Registry calculates its share of matching gross withdrawals fell from 0.152216% to 0.011858%. This is a source based numerical comparison, not a causal policy estimate.

American Mineral Registry. From 2020 to 2024 in the fixed EIA Annual edition, Colorado's reported combined vented and flared gas volume declined 92.805519%, from 3.044 to 0.219 billion cubic feet. American Mineral Registry calculates its share of matching gross withdrawals fell from 0.152216% to 0.011858%. This is a source based numerical comparison, not a causal policy estimate. EIA reported combined venting AND flaring, not flaring only or emissions. Rates divide by the same state and year gross withdrawals. State ranks cover only numeric source observations with a positive gross denominator; unavailable states are excluded, not assigned zero. American Mineral Registry compilation and calculations from EIA. https://americanmineralregistry.com/research/us-natural-gas-venting-flaring-statistics#gas-colorado-2020-2024-change Primary sources: https://www.eia.gov/naturalgas/annual/pdf/table_003.pdf; https://www.eia.gov/naturalgas/annual/pdf/nga24.pdf
Copy HTML attribution<a href="https://americanmineralregistry.com/research/us-natural-gas-venting-flaring-statistics#gas-colorado-2020-2024-change">American Mineral Registry</a>. From 2020 to 2024 in the fixed EIA Annual edition, Colorado&#x27;s reported combined vented and flared gas volume declined 92.805519%, from 3.044 to 0.219 billion cubic feet. American Mineral Registry calculates its share of matching gross withdrawals fell from 0.152216% to 0.011858%. This is a source based numerical comparison, not a causal policy estimate. EIA reported combined venting AND flaring, not flaring only or emissions. Rates divide by the same state and year gross withdrawals. State ranks cover only numeric source observations with a positive gross denominator; unavailable states are excluded, not assigned zero. American Mineral Registry compilation and calculations from EIA. Primary sources: <a href="https://www.eia.gov/naturalgas/annual/pdf/table_003.pdf">Original primary source</a>; <a href="https://www.eia.gov/naturalgas/annual/pdf/nga24.pdf">EIA complete state summaries</a>.

Permanent finding link · Matching data (CSV) · Original producer source

EIA complete state summaries

Four exact Annual NA versus workbook zero examples

EIA's 2024 Annual Table 3 marks combined vented and flared gas NA for Arkansas, Ohio, Oklahoma and Pennsylvania, while the October 2026 historical workbook displays 0 in Data 1 cells F92, T92, U92 and V92 respectively. American Mineral Registry preserves the Annual NA markers and leaves those state rates unavailable.

American Mineral Registry. EIA's 2024 Annual Table 3 marks combined vented and flared gas NA for Arkansas, Ohio, Oklahoma and Pennsylvania, while the October 2026 historical workbook displays 0 in Data 1 cells F92, T92, U92 and V92 respectively. American Mineral Registry preserves the Annual NA markers and leaves those state rates unavailable. EIA reported combined venting AND flaring, not flaring only or emissions. Rates divide by the same state and year gross withdrawals. State ranks cover only numeric source observations with a positive gross denominator; unavailable states are excluded, not assigned zero. American Mineral Registry compilation and calculations from EIA. https://americanmineralregistry.com/research/us-natural-gas-venting-flaring-statistics#gas-2024-na-zero-reconciliation Primary sources: https://www.eia.gov/naturalgas/annual/pdf/table_003.pdf; https://www.eia.gov/dnav/ng/xls/NG_PROD_SUM_A_EPG0_VGV_MMCF_A.xls
Copy HTML attribution<a href="https://americanmineralregistry.com/research/us-natural-gas-venting-flaring-statistics#gas-2024-na-zero-reconciliation">American Mineral Registry</a>. EIA&#x27;s 2024 Annual Table 3 marks combined vented and flared gas NA for Arkansas, Ohio, Oklahoma and Pennsylvania, while the October 2026 historical workbook displays 0 in Data 1 cells F92, T92, U92 and V92 respectively. American Mineral Registry preserves the Annual NA markers and leaves those state rates unavailable. EIA reported combined venting AND flaring, not flaring only or emissions. Rates divide by the same state and year gross withdrawals. State ranks cover only numeric source observations with a positive gross denominator; unavailable states are excluded, not assigned zero. American Mineral Registry compilation and calculations from EIA. Primary sources: <a href="https://www.eia.gov/naturalgas/annual/pdf/table_003.pdf">Original primary source</a>; <a href="https://www.eia.gov/dnav/ng/xls/NG_PROD_SUM_A_EPG0_VGV_MMCF_A.xls">EIA historical venting and flaring workbook</a>.

Permanent finding link · Matching data (CSV) · Original producer source

EIA historical venting and flaring workbook

Complete working tables

Open a working table to inspect every row or download its matching CSV. Each table states its period, units, scope and original sources. Display values follow the stated dataset precision, with long fractions shown to four decimal places. The dictionary explains every field, denominator and rounding rule. No account is required.

All eligible 2024 state observations, all 13 rows

Thirteen eligible producing states, ten positive combined disposal observations and three actual source zeros. NA states excluded, never interpreted as lower ranked.

Period: 2024. Units: Million cubic feet (MMcf) unless explicitly percentage, percentage points, rank or row count. Bcf conversions in article and graphics divide MMcf by 1,000..

Original sources: EIA Natural Gas Annual 2024, source edition November 2025, reissued February 2026

All eligible 2024 state observations; 2024; Million cubic feet (MMcf) unless explicitly percentage, percentage points, rank or row count. Bcf conversions in article and graphics divide MMcf by 1,000.
yearareageography typegross withdrawals mmcfvented flared mmcfvented flared statusvented flared source markervented flared pct grossgross source markersource filesource tablevintagevolume rankrate rankshare of reported us vented flared pct
2024Texasstate12,918,987163,512reported_positive163,5121.265712,918,987nga24.pdfS452024 Annual, released November 2025, reissued February 20261448.7858
2024North Dakotastate1,253,36967,705reported_positive67,7055.40181,253,369nga24.pdfS362024 Annual, released November 2025, reissued February 20262220.2006
2024Wyomingstate1,343,29059,941reported_positive59,9414.46231,343,290nga24.pdfS522024 Annual, released November 2025, reissued February 20263317.8841
2024New Mexicostate3,616,82017,026reported_positive17,0260.47073,616,820nga24.pdfS332024 Annual, released November 2025, reissued February 2026475.0799
2024Alaskastate3,549,1656,311reported_positive6,3110.17783,549,165nga24.pdfS22024 Annual, released November 2025, reissued February 2026581.8830
2024Montanastate47,6025,497reported_positive5,49711.547847,602nga24.pdfS282024 Annual, released November 2025, reissued February 2026611.6401
2024Utahstate306,3201,932reported_positive1,9320.6307306,320nga24.pdfS462024 Annual, released November 2025, reissued February 2026760.5764
2024Louisianastate3,617,3211,847reported_positive1,8470.05113,617,321nga24.pdfS202024 Annual, released November 2025, reissued February 2026890.5511
2024Californiastate125,7511,360reported_positive1,3601.0815125,751nga24.pdfS52024 Annual, released November 2025, reissued February 2026950.4058
2024Coloradostate1,846,820219reported_positive2190.01191,846,820nga24.pdfS62024 Annual, released November 2025, reissued February 202610100.0653
2024Idahostate1,1460reported_zero001,146nga24.pdfS142024 Annual, released November 2025, reissued February 202611110
2024Kansasstate125,9430reported_zero00125,943nga24.pdfS182024 Annual, released November 2025, reissued February 202611110
2024South Dakotastate1350reported_zero00135nga24.pdfS432024 Annual, released November 2025, reissued February 202611110

Download the same complete table (CSV)

Annual source availability and ranking eligibility, all 5 rows

Distinguish source geography transcription, positive gross production, numeric combined disposal and eligibility for a defined rate. Gross production associated with missing disposal entries is not an estimate of missing disposal volume.

Period: 2020 through 2024, fixed 2024 Annual edition. Units: Million cubic feet (MMcf) unless explicitly percentage, percentage points, rank or row count. Bcf conversions in article and graphics divide MMcf by 1,000..

Original sources: EIA Natural Gas Annual 2024, source edition November 2025, reissued February 2026

Annual source availability and ranking eligibility; 2020 through 2024, fixed 2024 Annual edition; Million cubic feet (MMcf) unless explicitly percentage, percentage points, rank or row count. Bcf conversions in article and graphics divide MMcf by 1,000.
yearstate rowsdistrict rowsoffshore region rowsstates positive grossstates numeric vented flaredstates positive vented flaredstates reported zero vented flaredstates NA vented flaredrate eligible statesproduction state gross with missing vented flared mmcf
2020501134301020201415,884,287
2021501133291019211316,166,259
2022501134291019211316,353,166
2023501134281018221216,566,753
2024501134291019211316,430,428

Download the same complete table (CSV)

National volumes, shares and accounting checks, all 5 rows

Published totals, exact arithmetic and signed independent rounding residuals. Numeric geography sums do not establish complete physical measurement.

Period: 2020 through 2024, fixed 2024 Annual edition. Units: Million cubic feet (MMcf) unless explicitly percentage, percentage points, rank or row count. Bcf conversions in article and graphics divide MMcf by 1,000..

Original sources: EIA Natural Gas Annual 2024, source edition November 2025, reissued February 2026

National volumes, shares and accounting checks; 2020 through 2024, fixed 2024 Annual edition; Million cubic feet (MMcf) unless explicitly percentage, percentage points, rank or row count. Bcf conversions in article and graphics divide MMcf by 1,000.
yeargross withdrawals mmcfrepressuring mmcfvented flared mmcfnonhydrocarbon removed mmcfmarketed production mmcfngpl equivalent mmcfdry production mmcfvented flared pct grosssum numeric state and gulf vented flared mmcfus minus reported geographies vented flared mmcfsum state district gulf gross mmcfus minus geographies gross mmcfmarketed accounting rounding residual mmcfdry accounting rounding residual mmcf
202040,729,9273,580,429339,272289,39936,520,8262,709,69733,811,1290.8330339,273-140,729,926110
202141,676,7433,721,344287,775329,76437,337,8602,808,58434,529,2760.6905287,775041,676,743000
202243,700,9283,778,592271,682321,19639,329,4573,074,51536,254,9420.6217271,681143,700,931-310
202345,399,6703,752,497324,207285,23141,037,7353,385,29737,652,4380.7141324,207045,399,673-300
202445,867,7613,855,413335,163293,29241,383,8933,658,96237,724,9310.7307335,164-145,867,762-100

Download the same complete table (CSV)

Reported state volume and share ranks by year, all 65 rows

Numeric combined disposal and positive matching gross denominator only. Exact fractional rate ranks, competition ties, offshore Gulf excluded.

Period: 2020 through 2024, fixed 2024 Annual edition. Units: Million cubic feet (MMcf) unless explicitly percentage, percentage points, rank or row count. Bcf conversions in article and graphics divide MMcf by 1,000..

Original sources: EIA Natural Gas Annual 2024, source edition November 2025, reissued February 2026

Reported state volume and share ranks by year; 2020 through 2024, fixed 2024 Annual edition; Million cubic feet (MMcf) unless explicitly percentage, percentage points, rank or row count. Bcf conversions in article and graphics divide MMcf by 1,000.
yearareageography typegross withdrawals mmcfvented flared mmcfvented flared statusvented flared source markervented flared pct grossgross source markersource filesource tablevintagevolume rankrate rankshare of reported us vented flared pct
2020Texasstate10,489,727125,336reported_positive125,3361.194810,489,727nga24.pdfS452024 Annual, released November 2025, reissued February 20261436.9426
2020North Dakotastate986,97799,532reported_positive99,53210.0845986,977nga24.pdfS362024 Annual, released November 2025, reissued February 20262129.3369
2020Wyomingstate1,472,87360,415reported_positive60,4154.10181,472,873nga24.pdfS522024 Annual, released November 2025, reissued February 20263317.8072
2020New Mexicostate2,005,51822,535reported_positive22,5351.12362,005,518nga24.pdfS332024 Annual, released November 2025, reissued February 2026456.6422
2020Alaskastate3,430,3225,707reported_positive5,7070.16643,430,322nga24.pdfS22024 Annual, released November 2025, reissued February 2026581.6821
2020Louisianastate3,211,4914,491reported_positive4,4910.13983,211,491nga24.pdfS202024 Annual, released November 2025, reissued February 20266101.3237
2020Montanastate42,0673,870reported_positive3,8709.199642,067nga24.pdfS282024 Annual, released November 2025, reissued February 2026721.1407
2020Coloradostate1,999,7843,044reported_positive3,0440.15221,999,784nga24.pdfS62024 Annual, released November 2025, reissued February 2026890.8972
2020Californiastate157,5341,555reported_positive1,5550.9871157,534nga24.pdfS52024 Annual, released November 2025, reissued February 2026960.4583
2020Utahstate242,560595reported_positive5950.2453242,560nga24.pdfS462024 Annual, released November 2025, reissued February 20261070.1754
2020Idahostate1080reported_zero00108nga24.pdfS142024 Annual, released November 2025, reissued February 202611110
2020Marylandstate100reported_zero0010nga24.pdfS222024 Annual, released November 2025, reissued February 202611110
2020Nevadastate120reported_zero0012nga24.pdfS302024 Annual, released November 2025, reissued February 202611110
2020Oregonstate3200reported_zero00320nga24.pdfS392024 Annual, released November 2025, reissued February 202611110
2021Texasstate10,743,106102,267reported_positive102,2670.951910,743,106nga24.pdfS452024 Annual, released November 2025, reissued February 20261535.5371
2021North Dakotastate1,075,55376,459reported_positive76,4597.10881,075,553nga24.pdfS362024 Annual, released November 2025, reissued February 20262226.5690
2021Wyomingstate1,375,45465,742reported_positive65,7424.77971,375,454nga24.pdfS522024 Annual, released November 2025, reissued February 20263322.8449
2021New Mexicostate2,277,03517,277reported_positive17,2770.75882,277,035nga24.pdfS332024 Annual, released November 2025, reissued February 2026466.0036
2021Alaskastate3,486,0565,969reported_positive5,9690.17123,486,056nga24.pdfS22024 Annual, released November 2025, reissued February 2026582.0742
2021Louisianastate3,448,5423,499reported_positive3,4990.10153,448,542nga24.pdfS202024 Annual, released November 2025, reissued February 2026691.2159
2021Montanastate41,8493,126reported_positive3,1267.469741,849nga24.pdfS282024 Annual, released November 2025, reissued February 2026711.0863
2021Coloradostate1,891,9131,653reported_positive1,6530.08741,891,913nga24.pdfS62024 Annual, released November 2025, reissued February 20268100.5744
2021Californiastate137,5401,506reported_positive1,5061.0950137,540nga24.pdfS52024 Annual, released November 2025, reissued February 2026940.5233
2021Utahstate239,951529reported_positive5290.2205239,951nga24.pdfS462024 Annual, released November 2025, reissued February 20261070.1838
2021Idahostate1,3740reported_zero001,374nga24.pdfS142024 Annual, released November 2025, reissued February 202611110
2021Marylandstate50reported_zero005nga24.pdfS222024 Annual, released November 2025, reissued February 202611110
2021Nevadastate40reported_zero004nga24.pdfS302024 Annual, released November 2025, reissued February 202611110
2022Texasstate11,438,59499,698reported_positive99,6980.871611,438,594nga24.pdfS452024 Annual, released November 2025, reissued February 20261536.6966
2022North Dakotastate1,072,18963,998reported_positive63,9985.96891,072,189nga24.pdfS362024 Annual, released November 2025, reissued February 20262223.5562
2022Wyomingstate1,298,56658,675reported_positive58,6754.51841,298,566nga24.pdfS522024 Annual, released November 2025, reissued February 20263321.5969
2022New Mexicostate2,763,66320,873reported_positive20,8730.75532,763,663nga24.pdfS332024 Annual, released November 2025, reissued February 2026467.6829
2022Alaskastate3,586,8867,113reported_positive7,1130.19833,586,886nga24.pdfS22024 Annual, released November 2025, reissued February 2026582.6181
2022Louisianastate4,127,7373,816reported_positive3,8160.09244,127,737nga24.pdfS202024 Annual, released November 2025, reissued February 2026691.4046
2022Montanastate42,9023,005reported_positive3,0057.004342,902nga24.pdfS282024 Annual, released November 2025, reissued February 2026711.1061
2022Californiastate135,9841,534reported_positive1,5341.1281135,984nga24.pdfS52024 Annual, released November 2025, reissued February 2026840.5646
2022Utahstate260,5531,037reported_positive1,0370.3980260,553nga24.pdfS462024 Annual, released November 2025, reissued February 2026970.3817
2022Coloradostate1,833,421566reported_positive5660.03091,833,421nga24.pdfS62024 Annual, released November 2025, reissued February 202610100.2083
2022Idahostate2,5800reported_zero002,580nga24.pdfS142024 Annual, released November 2025, reissued February 202611110
2022Marylandstate50reported_zero005nga24.pdfS222024 Annual, released November 2025, reissued February 202611110
2022Nevadastate40reported_zero004nga24.pdfS302024 Annual, released November 2025, reissued February 202611110
2023Texasstate12,232,997156,021reported_positive156,0211.275412,232,997nga24.pdfS452024 Annual, released November 2025, reissued February 20261448.1239
2023North Dakotastate1,187,90062,176reported_positive62,1765.23411,187,900nga24.pdfS362024 Annual, released November 2025, reissued February 20262219.1779
2023Wyomingstate1,310,06055,961reported_positive55,9614.27161,310,060nga24.pdfS522024 Annual, released November 2025, reissued February 20263317.2609
2023New Mexicostate3,194,36424,864reported_positive24,8640.77843,194,364nga24.pdfS332024 Annual, released November 2025, reissued February 2026467.6692
2023Alaskastate3,503,9957,034reported_positive7,0340.20073,503,995nga24.pdfS22024 Annual, released November 2025, reissued February 2026582.1696
2023Montanastate45,5122,837reported_positive2,8376.233545,512nga24.pdfS282024 Annual, released November 2025, reissued February 2026610.8751
2023Louisianastate4,355,8791,990reported_positive1,9900.04574,355,879nga24.pdfS202024 Annual, released November 2025, reissued February 2026790.6138
2023Utahstate289,8261,867reported_positive1,8670.6442289,826nga24.pdfS462024 Annual, released November 2025, reissued February 2026870.5759
2023Californiastate133,1811,334reported_positive1,3341.0016133,181nga24.pdfS52024 Annual, released November 2025, reissued February 2026950.4115
2023Coloradostate1,826,767632reported_positive6320.03461,826,767nga24.pdfS62024 Annual, released November 2025, reissued February 202610100.1949
2023Idahostate2,4090reported_zero002,409nga24.pdfS142024 Annual, released November 2025, reissued February 202611110
2023Nevadastate40reported_zero004nga24.pdfS302024 Annual, released November 2025, reissued February 202611110
2024Texasstate12,918,987163,512reported_positive163,5121.265712,918,987nga24.pdfS452024 Annual, released November 2025, reissued February 20261448.7858
2024North Dakotastate1,253,36967,705reported_positive67,7055.40181,253,369nga24.pdfS362024 Annual, released November 2025, reissued February 20262220.2006
2024Wyomingstate1,343,29059,941reported_positive59,9414.46231,343,290nga24.pdfS522024 Annual, released November 2025, reissued February 20263317.8841
2024New Mexicostate3,616,82017,026reported_positive17,0260.47073,616,820nga24.pdfS332024 Annual, released November 2025, reissued February 2026475.0799
2024Alaskastate3,549,1656,311reported_positive6,3110.17783,549,165nga24.pdfS22024 Annual, released November 2025, reissued February 2026581.8830
2024Montanastate47,6025,497reported_positive5,49711.547847,602nga24.pdfS282024 Annual, released November 2025, reissued February 2026611.6401
2024Utahstate306,3201,932reported_positive1,9320.6307306,320nga24.pdfS462024 Annual, released November 2025, reissued February 2026760.5764
2024Louisianastate3,617,3211,847reported_positive1,8470.05113,617,321nga24.pdfS202024 Annual, released November 2025, reissued February 2026890.5511
2024Californiastate125,7511,360reported_positive1,3601.0815125,751nga24.pdfS52024 Annual, released November 2025, reissued February 2026950.4058
2024Coloradostate1,846,820219reported_positive2190.01191,846,820nga24.pdfS62024 Annual, released November 2025, reissued February 202610100.0653
2024Idahostate1,1460reported_zero001,146nga24.pdfS142024 Annual, released November 2025, reissued February 202611110
2024Kansasstate125,9430reported_zero00125,943nga24.pdfS182024 Annual, released November 2025, reissued February 202611110
2024South Dakotastate1350reported_zero00135nga24.pdfS432024 Annual, released November 2025, reissued February 202611110

Download the same complete table (CSV)

Annual and current historical workbook reconciliation, all 1094 rows

Exact source markers, numeric revisions and workbook cell locators. Annual NA remains unavailable even if the historical workbook displays zero.

Period: 2012 through 2024 Annual snapshots versus October 2026 current series. Units: Million cubic feet (MMcf) unless explicitly percentage, percentage points, rank or row count. Bcf conversions in article and graphics divide MMcf by 1,000..

Original sources: EIA Natural Gas Annual 2024, source edition November 2025, reissued February 2026 · EIA historical disposal workbook, October 2026 · EIA historical gross workbook, October 2026

Annual and current historical workbook reconciliation; 2012 through 2024 Annual snapshots versus October 2026 current series; Million cubic feet (MMcf) unless explicitly percentage, percentage points, rank or row count. Bcf conversions in article and graphics divide MMcf by 1,000.
yearareavariableannual rawcurrent series rawcomparisonnumeric differenceannual fileseries fileseries sheetseries cell
2020Alabamagross_withdrawals117,030117,030same_numeric0nga24.pdfstates-gross.xlsData 2C57
2020Alabamavented_flaredNA0annual_NA_series_zeronga24.pdfstates-vented-flared.xlsData 2C57
2021Alabamagross_withdrawals107,233107,233same_numeric0nga24.pdfstates-gross.xlsData 2C58
2021Alabamavented_flaredNA0annual_NA_series_zeronga24.pdfstates-vented-flared.xlsData 2C58
2022Alabamagross_withdrawals95,79595,795same_numeric0nga24.pdfstates-gross.xlsData 2C59
2022Alabamavented_flaredNA0annual_NA_series_zeronga24.pdfstates-vented-flared.xlsData 2C59
2023Alabamagross_withdrawals87,39187,391same_numeric0nga24.pdfstates-gross.xlsData 2C60
2023Alabamavented_flaredNA0annual_NA_series_zeronga24.pdfstates-vented-flared.xlsData 2C60
2024Alabamagross_withdrawals75,80075,800same_numeric0nga24.pdfstates-gross.xlsData 2C61
2024Alabamavented_flaredNA0annual_NA_series_zeronga24.pdfstates-vented-flared.xlsData 2C61
2020Alaskagross_withdrawals3,430,3223,430,322same_numeric0nga24.pdfstates-gross.xlsData 1F88
2020Alaskavented_flared5,7075,707same_numeric0nga24.pdfstates-vented-flared.xlsData 1C88
2021Alaskagross_withdrawals3,486,0563,486,056same_numeric0nga24.pdfstates-gross.xlsData 1F89
2021Alaskavented_flared5,9695,969same_numeric0nga24.pdfstates-vented-flared.xlsData 1C89
2022Alaskagross_withdrawals3,586,8863,586,886same_numeric0nga24.pdfstates-gross.xlsData 1F90
2022Alaskavented_flared7,1137,113same_numeric0nga24.pdfstates-vented-flared.xlsData 1C90
2023Alaskagross_withdrawals3,503,9953,503,995same_numeric0nga24.pdfstates-gross.xlsData 1F91
2023Alaskavented_flared7,0347,034same_numeric0nga24.pdfstates-vented-flared.xlsData 1C91
2024Alaskagross_withdrawals3,549,1653,549,165same_numeric0nga24.pdfstates-gross.xlsData 1F92
2024Alaskavented_flared6,3116,311same_numeric0nga24.pdfstates-vented-flared.xlsData 1C92
2020Arizonagross_withdrawals8787same_numeric0nga24.pdfstates-gross.xlsData 2G57
2020Arizonavented_flaredNA0annual_NA_series_zeronga24.pdfstates-vented-flared.xlsData 2F57
2021Arizonagross_withdrawals229229same_numeric0nga24.pdfstates-gross.xlsData 2G58
2021Arizonavented_flaredNA0annual_NA_series_zeronga24.pdfstates-vented-flared.xlsData 2F58
2022Arizonagross_withdrawals183183same_numeric0nga24.pdfstates-gross.xlsData 2G59
2022Arizonavented_flaredNA0annual_NA_series_zeronga24.pdfstates-vented-flared.xlsData 2F59
2023Arizonagross_withdrawals172172same_numeric0nga24.pdfstates-gross.xlsData 2G60
2023Arizonavented_flaredNA0annual_NA_series_zeronga24.pdfstates-vented-flared.xlsData 2F60
2024Arizonagross_withdrawals139139same_numeric0nga24.pdfstates-gross.xlsData 2G61
2024Arizonavented_flaredNA0annual_NA_series_zeronga24.pdfstates-vented-flared.xlsData 2F61
2020Arkansasgross_withdrawals481,205481,205same_numeric0nga24.pdfstates-gross.xlsData 1J88
2020Arkansasvented_flaredNA0annual_NA_series_zeronga24.pdfstates-vented-flared.xlsData 1F88
2021Arkansasgross_withdrawals448,283448,283same_numeric0nga24.pdfstates-gross.xlsData 1J89
2021Arkansasvented_flaredNA0annual_NA_series_zeronga24.pdfstates-vented-flared.xlsData 1F89
2022Arkansasgross_withdrawals416,225416,225same_numeric0nga24.pdfstates-gross.xlsData 1J90
2022Arkansasvented_flaredNA0annual_NA_series_zeronga24.pdfstates-vented-flared.xlsData 1F90
2023Arkansasgross_withdrawals389,529389,529same_numeric0nga24.pdfstates-gross.xlsData 1J91
2023Arkansasvented_flaredNA0annual_NA_series_zeronga24.pdfstates-vented-flared.xlsData 1F91
2024Arkansasgross_withdrawals355,308355,308same_numeric0nga24.pdfstates-gross.xlsData 1J92
2024Arkansasvented_flaredNA0annual_NA_series_zeronga24.pdfstates-vented-flared.xlsData 1F92
2020Californiagross_withdrawals157,534157,534same_numeric0nga24.pdfstates-gross.xlsData 1K88
2020Californiavented_flared1,5551,555same_numeric0nga24.pdfstates-vented-flared.xlsData 1G88
2021Californiagross_withdrawals137,540137,540same_numeric0nga24.pdfstates-gross.xlsData 1K89
2021Californiavented_flared1,5061,506same_numeric0nga24.pdfstates-vented-flared.xlsData 1G89
2022Californiagross_withdrawals135,984135,984same_numeric0nga24.pdfstates-gross.xlsData 1K90
2022Californiavented_flared1,5341,534same_numeric0nga24.pdfstates-vented-flared.xlsData 1G90
2023Californiagross_withdrawals133,181133,181same_numeric0nga24.pdfstates-gross.xlsData 1K91
2023Californiavented_flared1,3341,334same_numeric0nga24.pdfstates-vented-flared.xlsData 1G91
2024Californiagross_withdrawals125,751125,751same_numeric0nga24.pdfstates-gross.xlsData 1K92
2024Californiavented_flared1,3601,360same_numeric0nga24.pdfstates-vented-flared.xlsData 1G92
2020Coloradogross_withdrawals1,999,7841,999,784same_numeric0nga24.pdfstates-gross.xlsData 1P88
2020Coloradovented_flared3,0443,044same_numeric0nga24.pdfstates-vented-flared.xlsData 1K88
2021Coloradogross_withdrawals1,891,9131,891,913same_numeric0nga24.pdfstates-gross.xlsData 1P89
2021Coloradovented_flared1,6531,653same_numeric0nga24.pdfstates-vented-flared.xlsData 1K89
2022Coloradogross_withdrawals1,833,4211,833,421same_numeric0nga24.pdfstates-gross.xlsData 1P90
2022Coloradovented_flared566566same_numeric0nga24.pdfstates-vented-flared.xlsData 1K90
2023Coloradogross_withdrawals1,826,7671,826,767same_numeric0nga24.pdfstates-gross.xlsData 1P91
2023Coloradovented_flared632632same_numeric0nga24.pdfstates-vented-flared.xlsData 1K91
2024Coloradogross_withdrawals1,846,8201,846,820same_numeric0nga24.pdfstates-gross.xlsData 1P92
2024Coloradovented_flared219219same_numeric0nga24.pdfstates-vented-flared.xlsData 1K92
2020Connecticutgross_withdrawals0no_series_cellnga24.pdf
2020Connecticutvented_flared0no_series_cellnga24.pdf
2021Connecticutgross_withdrawals0no_series_cellnga24.pdf
2021Connecticutvented_flared0no_series_cellnga24.pdf
2022Connecticutgross_withdrawals0no_series_cellnga24.pdf
2022Connecticutvented_flared0no_series_cellnga24.pdf
2023Connecticutgross_withdrawals0no_series_cellnga24.pdf
2023Connecticutvented_flared0no_series_cellnga24.pdf
2024Connecticutgross_withdrawals0no_series_cellnga24.pdf
2024Connecticutvented_flared0no_series_cellnga24.pdf
2020Delawaregross_withdrawals0no_series_cellnga24.pdf
2020Delawarevented_flared0no_series_cellnga24.pdf
2021Delawaregross_withdrawals0no_series_cellnga24.pdf
2021Delawarevented_flared0no_series_cellnga24.pdf
2022Delawaregross_withdrawals0no_series_cellnga24.pdf
2022Delawarevented_flared0no_series_cellnga24.pdf
2023Delawaregross_withdrawals0no_series_cellnga24.pdf
2023Delawarevented_flared0no_series_cellnga24.pdf
2024Delawaregross_withdrawals0no_series_cellnga24.pdf
2024Delawarevented_flared0no_series_cellnga24.pdf
2020District of Columbiagross_withdrawals0no_series_cellnga24.pdf
2020District of Columbiavented_flared0no_series_cellnga24.pdf
2021District of Columbiagross_withdrawals0no_series_cellnga24.pdf
2021District of Columbiavented_flared0no_series_cellnga24.pdf
2022District of Columbiagross_withdrawals0no_series_cellnga24.pdf
2022District of Columbiavented_flared0no_series_cellnga24.pdf
2023District of Columbiagross_withdrawals0no_series_cellnga24.pdf
2023District of Columbiavented_flared0no_series_cellnga24.pdf
2024District of Columbiagross_withdrawals0no_series_cellnga24.pdf
2024District of Columbiavented_flared0no_series_cellnga24.pdf
2020Floridagross_withdrawals6,0256,025same_numeric0nga24.pdfstates-gross.xlsData 2H57
2020Floridavented_flaredNA0annual_NA_series_zeronga24.pdfstates-vented-flared.xlsData 2G57
2021Floridagross_withdrawals8,9948,994same_numeric0nga24.pdfstates-gross.xlsData 2H58
2021Floridavented_flaredNA0annual_NA_series_zeronga24.pdfstates-vented-flared.xlsData 2G58
2022Floridagross_withdrawals5,1755,175same_numeric0nga24.pdfstates-gross.xlsData 2H59
2022Floridavented_flaredNA0annual_NA_series_zeronga24.pdfstates-vented-flared.xlsData 2G59
2023Floridagross_withdrawals3,5343,534same_numeric0nga24.pdfstates-gross.xlsData 2H60
2023Floridavented_flaredNA0annual_NA_series_zeronga24.pdfstates-vented-flared.xlsData 2G60
2024Floridagross_withdrawals4,4544,454same_numeric0nga24.pdfstates-gross.xlsData 2H61
2024Floridavented_flaredNA0annual_NA_series_zeronga24.pdfstates-vented-flared.xlsData 2G61
2020Georgiagross_withdrawals0no_series_cellnga24.pdf
2020Georgiavented_flared0no_series_cellnga24.pdf
2021Georgiagross_withdrawals0no_series_cellnga24.pdf
2021Georgiavented_flared0no_series_cellnga24.pdf
2022Georgiagross_withdrawals0no_series_cellnga24.pdf
2022Georgiavented_flared0no_series_cellnga24.pdf
2023Georgiagross_withdrawals0no_series_cellnga24.pdf
2023Georgiavented_flared0no_series_cellnga24.pdf
2024Georgiagross_withdrawals0no_series_cellnga24.pdf
2024Georgiavented_flared0no_series_cellnga24.pdf
2020Federal offshore Gulfgross_withdrawals806,336806,336same_numeric0nga24.pdfstates-gross.xlsData 1Q88
2020Federal offshore Gulfvented_flared12,19312,193same_numeric0nga24.pdfstates-vented-flared.xlsData 1L88
2021Federal offshore Gulfgross_withdrawals792,102792,102same_numeric0nga24.pdfstates-gross.xlsData 1Q89
2021Federal offshore Gulfvented_flared9,7489,748same_numeric0nga24.pdfstates-vented-flared.xlsData 1L89
2022Federal offshore Gulfgross_withdrawals784,681784,681same_numeric0nga24.pdfstates-gross.xlsData 1Q90
2022Federal offshore Gulfvented_flared11,36611,366same_numeric0nga24.pdfstates-vented-flared.xlsData 1L90
2023Federal offshore Gulfgross_withdrawals750,026750,026same_numeric0nga24.pdfstates-gross.xlsData 1Q91
2023Federal offshore Gulfvented_flared9,4919,491same_numeric0nga24.pdfstates-vented-flared.xlsData 1L91
2024Federal offshore Gulfgross_withdrawals684,665684,665same_numeric0nga24.pdfstates-gross.xlsData 1Q92
2024Federal offshore Gulfvented_flared9,8149,814same_numeric0nga24.pdfstates-vented-flared.xlsData 1L92
2020Hawaiigross_withdrawals0no_series_cellnga24.pdf
2020Hawaiivented_flared0no_series_cellnga24.pdf
2021Hawaiigross_withdrawals0no_series_cellnga24.pdf
2021Hawaiivented_flared0no_series_cellnga24.pdf
2022Hawaiigross_withdrawals0no_series_cellnga24.pdf
2022Hawaiivented_flared0no_series_cellnga24.pdf
2023Hawaiigross_withdrawals0no_series_cellnga24.pdf
2023Hawaiivented_flared0no_series_cellnga24.pdf
2024Hawaiigross_withdrawals0no_series_cellnga24.pdf
2024Hawaiivented_flared0no_series_cellnga24.pdf
2020Idahogross_withdrawals108108same_numeric0nga24.pdfstates-gross.xlsData 2I57
2020Idahovented_flared00same_numeric0nga24.pdfstates-vented-flared.xlsData 2H57
2021Idahogross_withdrawals1,3741,374same_numeric0nga24.pdfstates-gross.xlsData 2I58
2021Idahovented_flared00same_numeric0nga24.pdfstates-vented-flared.xlsData 2H58
2022Idahogross_withdrawals2,5802,580same_numeric0nga24.pdfstates-gross.xlsData 2I59
2022Idahovented_flared00same_numeric0nga24.pdfstates-vented-flared.xlsData 2H59
2023Idahogross_withdrawals2,4092,409same_numeric0nga24.pdfstates-gross.xlsData 2I60
2023Idahovented_flared00same_numeric0nga24.pdfstates-vented-flared.xlsData 2H60
2024Idahogross_withdrawals1,1461,146same_numeric0nga24.pdfstates-gross.xlsData 2I61
2024Idahovented_flared00same_numeric0nga24.pdfstates-vented-flared.xlsData 2H61
2020Illinoisgross_withdrawals1,8401,840same_numeric0nga24.pdfstates-gross.xlsData 2J57
2020Illinoisvented_flaredNA0annual_NA_series_zeronga24.pdfstates-vented-flared.xlsData 2I57
2021Illinoisgross_withdrawals1,6371,637same_numeric0nga24.pdfstates-gross.xlsData 2J58
2021Illinoisvented_flaredNA0annual_NA_series_zeronga24.pdfstates-vented-flared.xlsData 2I58
2022Illinoisgross_withdrawals2,0032,003same_numeric0nga24.pdfstates-gross.xlsData 2J59
2022Illinoisvented_flaredNA0annual_NA_series_zeronga24.pdfstates-vented-flared.xlsData 2I59
2023Illinoisgross_withdrawals2,5882,588same_numeric0nga24.pdfstates-gross.xlsData 2J60
2023Illinoisvented_flaredNA0annual_NA_series_zeronga24.pdfstates-vented-flared.xlsData 2I60
2024Illinoisgross_withdrawals3,1913,191same_numeric0nga24.pdfstates-gross.xlsData 2J61
2024Illinoisvented_flaredNA0annual_NA_series_zeronga24.pdfstates-vented-flared.xlsData 2I61
2020Indianagross_withdrawals4,1974,197same_numeric0nga24.pdfstates-gross.xlsData 2K57
2020Indianavented_flaredNA0annual_NA_series_zeronga24.pdfstates-vented-flared.xlsData 2J57
2021Indianagross_withdrawals4,0634,063same_numeric0nga24.pdfstates-gross.xlsData 2K58
2021Indianavented_flaredNA0annual_NA_series_zeronga24.pdfstates-vented-flared.xlsData 2J58
2022Indianagross_withdrawals3,8363,836same_numeric0nga24.pdfstates-gross.xlsData 2K59
2022Indianavented_flaredNA0annual_NA_series_zeronga24.pdfstates-vented-flared.xlsData 2J59
2023Indianagross_withdrawals3,8263,826same_numeric0nga24.pdfstates-gross.xlsData 2K60
2023Indianavented_flaredNA0annual_NA_series_zeronga24.pdfstates-vented-flared.xlsData 2J60
2024Indianagross_withdrawals3,2513,251same_numeric0nga24.pdfstates-gross.xlsData 2K61
2024Indianavented_flaredNA0annual_NA_series_zeronga24.pdfstates-vented-flared.xlsData 2J61
2020Iowagross_withdrawals0no_series_cellnga24.pdf
2020Iowavented_flared0no_series_cellnga24.pdf
2021Iowagross_withdrawals0no_series_cellnga24.pdf
2021Iowavented_flared0no_series_cellnga24.pdf
2022Iowagross_withdrawals0no_series_cellnga24.pdf
2022Iowavented_flared0no_series_cellnga24.pdf
2023Iowagross_withdrawals0no_series_cellnga24.pdf
2023Iowavented_flared0no_series_cellnga24.pdf
2024Iowagross_withdrawals0no_series_cellnga24.pdf
2024Iowavented_flared0no_series_cellnga24.pdf
2020Kansasgross_withdrawals163,362163,362same_numeric0nga24.pdfstates-gross.xlsData 1U88
2020Kansasvented_flaredNA0annual_NA_series_zeronga24.pdfstates-vented-flared.xlsData 1M88
2021Kansasgross_withdrawals152,986152,986same_numeric0nga24.pdfstates-gross.xlsData 1U89
2021Kansasvented_flaredNA0annual_NA_series_zeronga24.pdfstates-vented-flared.xlsData 1M89
2022Kansasgross_withdrawals147,950147,950same_numeric0nga24.pdfstates-gross.xlsData 1U90
2022Kansasvented_flaredNA0annual_NA_series_zeronga24.pdfstates-vented-flared.xlsData 1M90
2023Kansasgross_withdrawals136,897136,897same_numeric0nga24.pdfstates-gross.xlsData 1U91
2023Kansasvented_flaredNA0annual_NA_series_zeronga24.pdfstates-vented-flared.xlsData 1M91
2024Kansasgross_withdrawals125,943125,943same_numeric0nga24.pdfstates-gross.xlsData 1U92
2024Kansasvented_flared00same_numeric0nga24.pdfstates-vented-flared.xlsData 1M92
2020Kentuckygross_withdrawals89,59589,595same_numeric0nga24.pdfstates-gross.xlsData 2L57
2020Kentuckyvented_flaredNA0annual_NA_series_zeronga24.pdfstates-vented-flared.xlsData 2K57
2021Kentuckygross_withdrawals75,37375,373same_numeric0nga24.pdfstates-gross.xlsData 2L58
2021Kentuckyvented_flaredNA0annual_NA_series_zeronga24.pdfstates-vented-flared.xlsData 2K58
2022Kentuckygross_withdrawals85,51385,513same_numeric0nga24.pdfstates-gross.xlsData 2L59
2022Kentuckyvented_flaredNA0annual_NA_series_zeronga24.pdfstates-vented-flared.xlsData 2K59
2023Kentuckygross_withdrawals60,47460,474same_numeric0nga24.pdfstates-gross.xlsData 2L60
2023Kentuckyvented_flaredNA0annual_NA_series_zeronga24.pdfstates-vented-flared.xlsData 2K60
2024Kentuckygross_withdrawals58,81658,816same_numeric0nga24.pdfstates-gross.xlsData 2L61
2024Kentuckyvented_flaredNA0annual_NA_series_zeronga24.pdfstates-vented-flared.xlsData 2K61
2020Louisianagross_withdrawals3,211,4913,211,491same_numeric0nga24.pdfstates-gross.xlsData 1V88
2020Louisianavented_flared4,4914,491same_numeric0nga24.pdfstates-vented-flared.xlsData 1N88
2021Louisianagross_withdrawals3,448,5423,448,542same_numeric0nga24.pdfstates-gross.xlsData 1V89
2021Louisianavented_flared3,4993,499same_numeric0nga24.pdfstates-vented-flared.xlsData 1N89
2022Louisianagross_withdrawals4,127,7374,127,737same_numeric0nga24.pdfstates-gross.xlsData 1V90
2022Louisianavented_flared3,8163,816same_numeric0nga24.pdfstates-vented-flared.xlsData 1N90
2023Louisianagross_withdrawals4,355,8794,355,879same_numeric0nga24.pdfstates-gross.xlsData 1V91
2023Louisianavented_flared1,9901,990same_numeric0nga24.pdfstates-vented-flared.xlsData 1N91
2024Louisianagross_withdrawals3,617,3213,617,321same_numeric0nga24.pdfstates-gross.xlsData 1V92
2024Louisianavented_flared1,8471,847same_numeric0nga24.pdfstates-vented-flared.xlsData 1N92
2020Mainegross_withdrawals0no_series_cellnga24.pdf
2020Mainevented_flared0no_series_cellnga24.pdf
2021Mainegross_withdrawals0no_series_cellnga24.pdf
2021Mainevented_flared0no_series_cellnga24.pdf
2022Mainegross_withdrawals0no_series_cellnga24.pdf
2022Mainevented_flared0no_series_cellnga24.pdf
2023Mainegross_withdrawals0no_series_cellnga24.pdf
2023Mainevented_flared0no_series_cellnga24.pdf
2024Mainegross_withdrawals0no_series_cellnga24.pdf
2024Mainevented_flared0no_series_cellnga24.pdf
2020Marylandgross_withdrawals1010same_numeric0nga24.pdfstates-gross.xlsData 2M57
2020Marylandvented_flared00same_numeric0nga24.pdfstates-vented-flared.xlsData 2L57
2021Marylandgross_withdrawals55same_numeric0nga24.pdfstates-gross.xlsData 2M58
2021Marylandvented_flared00same_numeric0nga24.pdfstates-vented-flared.xlsData 2L58
2022Marylandgross_withdrawals55same_numeric0nga24.pdfstates-gross.xlsData 2M59
2022Marylandvented_flared00same_numeric0nga24.pdfstates-vented-flared.xlsData 2L59
2023Marylandgross_withdrawals33same_numeric0nga24.pdfstates-gross.xlsData 2M60
2023Marylandvented_flaredNA0annual_NA_series_zeronga24.pdfstates-vented-flared.xlsData 2L60
2024Marylandgross_withdrawals55same_numeric0nga24.pdfstates-gross.xlsData 2M61
2024Marylandvented_flaredNA0annual_NA_series_zeronga24.pdfstates-vented-flared.xlsData 2L61
2020Massachusettsgross_withdrawals0no_series_cellnga24.pdf
2020Massachusettsvented_flared0no_series_cellnga24.pdf
2021Massachusettsgross_withdrawals0no_series_cellnga24.pdf
2021Massachusettsvented_flared0no_series_cellnga24.pdf
2022Massachusettsgross_withdrawals0no_series_cellnga24.pdf
2022Massachusettsvented_flared0no_series_cellnga24.pdf
2023Massachusettsgross_withdrawals0no_series_cellnga24.pdf
2023Massachusettsvented_flared0no_series_cellnga24.pdf
2024Massachusettsgross_withdrawals0no_series_cellnga24.pdf
2024Massachusettsvented_flared0no_series_cellnga24.pdf
2020Michigangross_withdrawals75,93575,935same_numeric0nga24.pdfstates-gross.xlsData 2N57
2020Michiganvented_flaredNA0annual_NA_series_zeronga24.pdfstates-vented-flared.xlsData 2M57
2021Michigangross_withdrawals74,05774,057same_numeric0nga24.pdfstates-gross.xlsData 2N58
2021Michiganvented_flaredNA0annual_NA_series_zeronga24.pdfstates-vented-flared.xlsData 2M58
2022Michigangross_withdrawals69,91969,919same_numeric0nga24.pdfstates-gross.xlsData 2N59
2022Michiganvented_flaredNA0annual_NA_series_zeronga24.pdfstates-vented-flared.xlsData 2M59
2023Michigangross_withdrawals68,31668,316same_numeric0nga24.pdfstates-gross.xlsData 2N60
2023Michiganvented_flaredNA0annual_NA_series_zeronga24.pdfstates-vented-flared.xlsData 2M60
2024Michigangross_withdrawals64,12964,129same_numeric0nga24.pdfstates-gross.xlsData 2N61
2024Michiganvented_flaredNA0annual_NA_series_zeronga24.pdfstates-vented-flared.xlsData 2M61
2020Minnesotagross_withdrawals0no_series_cellnga24.pdf
2020Minnesotavented_flared0no_series_cellnga24.pdf
2021Minnesotagross_withdrawals0no_series_cellnga24.pdf
2021Minnesotavented_flared0no_series_cellnga24.pdf
2022Minnesotagross_withdrawals0no_series_cellnga24.pdf
2022Minnesotavented_flared0no_series_cellnga24.pdf
2023Minnesotagross_withdrawals0no_series_cellnga24.pdf
2023Minnesotavented_flared0no_series_cellnga24.pdf
2024Minnesotagross_withdrawals0no_series_cellnga24.pdf
2024Minnesotavented_flared0no_series_cellnga24.pdf
2020Mississippigross_withdrawals28,69728,697same_numeric0nga24.pdfstates-gross.xlsData 2O57
2020Mississippivented_flaredNA0annual_NA_series_zeronga24.pdfstates-vented-flared.xlsData 2N57
2021Mississippigross_withdrawals27,56927,569same_numeric0nga24.pdfstates-gross.xlsData 2O58
2021Mississippivented_flaredNA0annual_NA_series_zeronga24.pdfstates-vented-flared.xlsData 2N58
2022Mississippigross_withdrawals28,50728,507same_numeric0nga24.pdfstates-gross.xlsData 2O59
2022Mississippivented_flaredNA0annual_NA_series_zeronga24.pdfstates-vented-flared.xlsData 2N59
2023Mississippigross_withdrawals27,20127,201same_numeric0nga24.pdfstates-gross.xlsData 2O60
2023Mississippivented_flaredNA0annual_NA_series_zeronga24.pdfstates-vented-flared.xlsData 2N60
2024Mississippigross_withdrawals25,75225,752same_numeric0nga24.pdfstates-gross.xlsData 2O61
2024Mississippivented_flaredNA0annual_NA_series_zeronga24.pdfstates-vented-flared.xlsData 2N61
2020Missourigross_withdrawals11same_numeric0nga24.pdfstates-gross.xlsData 2P57
2020Missourivented_flaredNA0annual_NA_series_zeronga24.pdfstates-vented-flared.xlsData 2O57
2021Missourigross_withdrawals*0availability_differencenga24.pdfstates-gross.xlsData 2P58
2021Missourivented_flaredNA0annual_NA_series_zeronga24.pdfstates-vented-flared.xlsData 2O58
2022Missourigross_withdrawals11same_numeric0nga24.pdfstates-gross.xlsData 2P59
2022Missourivented_flaredNA0annual_NA_series_zeronga24.pdfstates-vented-flared.xlsData 2O59
2023Missourigross_withdrawals11same_numeric0nga24.pdfstates-gross.xlsData 2P60
2023Missourivented_flaredNA0annual_NA_series_zeronga24.pdfstates-vented-flared.xlsData 2O60
2024Missourigross_withdrawals11same_numeric0nga24.pdfstates-gross.xlsData 2P61
2024Missourivented_flaredNA0annual_NA_series_zeronga24.pdfstates-vented-flared.xlsData 2O61
2020Montanagross_withdrawals42,06742,067same_numeric0nga24.pdfstates-gross.xlsData 1Z88
2020Montanavented_flared3,8703,870same_numeric0nga24.pdfstates-vented-flared.xlsData 1Q88
2021Montanagross_withdrawals41,84941,849same_numeric0nga24.pdfstates-gross.xlsData 1Z89
2021Montanavented_flared3,1263,126same_numeric0nga24.pdfstates-vented-flared.xlsData 1Q89
2022Montanagross_withdrawals42,90242,902same_numeric0nga24.pdfstates-gross.xlsData 1Z90
2022Montanavented_flared3,0053,005same_numeric0nga24.pdfstates-vented-flared.xlsData 1Q90
2023Montanagross_withdrawals45,51245,512same_numeric0nga24.pdfstates-gross.xlsData 1Z91
2023Montanavented_flared2,8372,837same_numeric0nga24.pdfstates-vented-flared.xlsData 1Q91
2024Montanagross_withdrawals47,60247,602same_numeric0nga24.pdfstates-gross.xlsData 1Z92
2024Montanavented_flared5,4975,497same_numeric0nga24.pdfstates-vented-flared.xlsData 1Q92
2020Nebraskagross_withdrawals351351same_numeric0nga24.pdfstates-gross.xlsData 2Q57
2020Nebraskavented_flaredNA0annual_NA_series_zeronga24.pdfstates-vented-flared.xlsData 2P57
2021Nebraskagross_withdrawals327327same_numeric0nga24.pdfstates-gross.xlsData 2Q58
2021Nebraskavented_flaredNA0annual_NA_series_zeronga24.pdfstates-vented-flared.xlsData 2P58
2022Nebraskagross_withdrawals320320same_numeric0nga24.pdfstates-gross.xlsData 2Q59
2022Nebraskavented_flaredNA0annual_NA_series_zeronga24.pdfstates-vented-flared.xlsData 2P59
2023Nebraskagross_withdrawals265265same_numeric0nga24.pdfstates-gross.xlsData 2Q60
2023Nebraskavented_flaredNA0annual_NA_series_zeronga24.pdfstates-vented-flared.xlsData 2P60
2024Nebraskagross_withdrawals261261same_numeric0nga24.pdfstates-gross.xlsData 2Q61
2024Nebraskavented_flaredNA0annual_NA_series_zeronga24.pdfstates-vented-flared.xlsData 2P61
2020Nevadagross_withdrawals1212same_numeric0nga24.pdfstates-gross.xlsData 2R57
2020Nevadavented_flared00same_numeric0nga24.pdfstates-vented-flared.xlsData 2Q57
2021Nevadagross_withdrawals44same_numeric0nga24.pdfstates-gross.xlsData 2R58
2021Nevadavented_flared00same_numeric0nga24.pdfstates-vented-flared.xlsData 2Q58
2022Nevadagross_withdrawals44same_numeric0nga24.pdfstates-gross.xlsData 2R59
2022Nevadavented_flared00same_numeric0nga24.pdfstates-vented-flared.xlsData 2Q59
2023Nevadagross_withdrawals44same_numeric0nga24.pdfstates-gross.xlsData 2R60
2023Nevadavented_flared00same_numeric0nga24.pdfstates-vented-flared.xlsData 2Q60
2024Nevadagross_withdrawals44same_numeric0nga24.pdfstates-gross.xlsData 2R61
2024Nevadavented_flaredNA0annual_NA_series_zeronga24.pdfstates-vented-flared.xlsData 2Q61
2020New Hampshiregross_withdrawals0no_series_cellnga24.pdf
2020New Hampshirevented_flared0no_series_cellnga24.pdf
2021New Hampshiregross_withdrawals0no_series_cellnga24.pdf
2021New Hampshirevented_flared0no_series_cellnga24.pdf
2022New Hampshiregross_withdrawals0no_series_cellnga24.pdf
2022New Hampshirevented_flared0no_series_cellnga24.pdf
2023New Hampshiregross_withdrawals0no_series_cellnga24.pdf
2023New Hampshirevented_flared0no_series_cellnga24.pdf
2024New Hampshiregross_withdrawals0no_series_cellnga24.pdf
2024New Hampshirevented_flared0no_series_cellnga24.pdf
2020New Jerseygross_withdrawals0no_series_cellnga24.pdf
2020New Jerseyvented_flared0no_series_cellnga24.pdf
2021New Jerseygross_withdrawals0no_series_cellnga24.pdf
2021New Jerseyvented_flared0no_series_cellnga24.pdf
2022New Jerseygross_withdrawals0no_series_cellnga24.pdf
2022New Jerseyvented_flared0no_series_cellnga24.pdf
2023New Jerseygross_withdrawals0no_series_cellnga24.pdf
2023New Jerseyvented_flared0no_series_cellnga24.pdf
2024New Jerseygross_withdrawals0no_series_cellnga24.pdf
2024New Jerseyvented_flared0no_series_cellnga24.pdf
2020New Mexicogross_withdrawals2,005,5182,005,518same_numeric0nga24.pdfstates-gross.xlsData 1AA88
2020New Mexicovented_flared22,53522,535same_numeric0nga24.pdfstates-vented-flared.xlsData 1R88
2021New Mexicogross_withdrawals2,277,0352,277,035same_numeric0nga24.pdfstates-gross.xlsData 1AA89
2021New Mexicovented_flared17,27717,277same_numeric0nga24.pdfstates-vented-flared.xlsData 1R89
2022New Mexicogross_withdrawals2,763,6632,763,663same_numeric0nga24.pdfstates-gross.xlsData 1AA90
2022New Mexicovented_flared20,87320,873same_numeric0nga24.pdfstates-vented-flared.xlsData 1R90
2023New Mexicogross_withdrawals3,194,3643,194,364same_numeric0nga24.pdfstates-gross.xlsData 1AA91
2023New Mexicovented_flared24,86424,864same_numeric0nga24.pdfstates-vented-flared.xlsData 1R91
2024New Mexicogross_withdrawals3,616,8203,616,820same_numeric0nga24.pdfstates-gross.xlsData 1AA92
2024New Mexicovented_flared17,02617,026same_numeric0nga24.pdfstates-vented-flared.xlsData 1R92
2020New Yorkgross_withdrawals9,6579,657same_numeric0nga24.pdfstates-gross.xlsData 2S57
2020New Yorkvented_flaredNA0annual_NA_series_zeronga24.pdfstates-vented-flared.xlsData 2R57
2021New Yorkgross_withdrawals9,7089,708same_numeric0nga24.pdfstates-gross.xlsData 2S58
2021New Yorkvented_flaredNA0annual_NA_series_zeronga24.pdfstates-vented-flared.xlsData 2R58
2022New Yorkgross_withdrawals9,4419,441same_numeric0nga24.pdfstates-gross.xlsData 2S59
2022New Yorkvented_flaredNA0annual_NA_series_zeronga24.pdfstates-vented-flared.xlsData 2R59
2023New Yorkgross_withdrawals8,3368,336same_numeric0nga24.pdfstates-gross.xlsData 2S60
2023New Yorkvented_flaredNA0annual_NA_series_zeronga24.pdfstates-vented-flared.xlsData 2R60
2024New Yorkgross_withdrawals8,8368,836same_numeric0nga24.pdfstates-gross.xlsData 2S61
2024New Yorkvented_flaredNA0annual_NA_series_zeronga24.pdfstates-vented-flared.xlsData 2R61
2020North Carolinagross_withdrawals0no_series_cellnga24.pdf
2020North Carolinavented_flared0no_series_cellnga24.pdf
2021North Carolinagross_withdrawals0no_series_cellnga24.pdf
2021North Carolinavented_flared0no_series_cellnga24.pdf
2022North Carolinagross_withdrawals0no_series_cellnga24.pdf
2022North Carolinavented_flared0no_series_cellnga24.pdf
2023North Carolinagross_withdrawals0no_series_cellnga24.pdf
2023North Carolinavented_flared0no_series_cellnga24.pdf
2024North Carolinagross_withdrawals0no_series_cellnga24.pdf
2024North Carolinavented_flared0no_series_cellnga24.pdf
2020North Dakotagross_withdrawals986,977986,977same_numeric0nga24.pdfstates-gross.xlsData 1AB88
2020North Dakotavented_flared99,53299,532same_numeric0nga24.pdfstates-vented-flared.xlsData 1S88
2021North Dakotagross_withdrawals1,075,5531,075,553same_numeric0nga24.pdfstates-gross.xlsData 1AB89
2021North Dakotavented_flared76,45976,459same_numeric0nga24.pdfstates-vented-flared.xlsData 1S89
2022North Dakotagross_withdrawals1,072,1891,072,189same_numeric0nga24.pdfstates-gross.xlsData 1AB90
2022North Dakotavented_flared63,99863,998same_numeric0nga24.pdfstates-vented-flared.xlsData 1S90
2023North Dakotagross_withdrawals1,187,9001,187,900same_numeric0nga24.pdfstates-gross.xlsData 1AB91
2023North Dakotavented_flared62,17662,176same_numeric0nga24.pdfstates-vented-flared.xlsData 1S91
2024North Dakotagross_withdrawals1,253,3691,253,369same_numeric0nga24.pdfstates-gross.xlsData 1AB92
2024North Dakotavented_flared67,70567,705same_numeric0nga24.pdfstates-vented-flared.xlsData 1S92
2020Ohiogross_withdrawals2,389,6292,389,629same_numeric0nga24.pdfstates-gross.xlsData 1AC88
2020Ohiovented_flaredNA0annual_NA_series_zeronga24.pdfstates-vented-flared.xlsData 1T88
2021Ohiogross_withdrawals2,278,7312,278,731same_numeric0nga24.pdfstates-gross.xlsData 1AC89
2021Ohiovented_flaredNA0annual_NA_series_zeronga24.pdfstates-vented-flared.xlsData 1T89
2022Ohiogross_withdrawals2,274,9902,274,990same_numeric0nga24.pdfstates-gross.xlsData 1AC90
2022Ohiovented_flaredNA0annual_NA_series_zeronga24.pdfstates-vented-flared.xlsData 1T90
2023Ohiogross_withdrawals2,226,6462,226,646same_numeric0nga24.pdfstates-gross.xlsData 1AC91
2023Ohiovented_flaredNA0annual_NA_series_zeronga24.pdfstates-vented-flared.xlsData 1T91
2024Ohiogross_withdrawals2,155,9292,155,929same_numeric0nga24.pdfstates-gross.xlsData 1AC92
2024Ohiovented_flaredNA0annual_NA_series_zeronga24.pdfstates-vented-flared.xlsData 1T92
2020Oklahomagross_withdrawals2,673,2072,673,207same_numeric0nga24.pdfstates-gross.xlsData 1AD88
2020Oklahomavented_flaredNA0annual_NA_series_zeronga24.pdfstates-vented-flared.xlsData 1U88
2021Oklahomagross_withdrawals2,555,4302,555,430same_numeric0nga24.pdfstates-gross.xlsData 1AD89
2021Oklahomavented_flaredNA0annual_NA_series_zeronga24.pdfstates-vented-flared.xlsData 1U89
2022Oklahomagross_withdrawals2,763,0692,763,069same_numeric0nga24.pdfstates-gross.xlsData 1AD90
2022Oklahomavented_flaredNA0annual_NA_series_zeronga24.pdfstates-vented-flared.xlsData 1U90
2023Oklahomagross_withdrawals2,759,5022,759,502same_numeric0nga24.pdfstates-gross.xlsData 1AD91
2023Oklahomavented_flaredNA0annual_NA_series_zeronga24.pdfstates-vented-flared.xlsData 1U91
2024Oklahomagross_withdrawals2,750,6072,750,607same_numeric0nga24.pdfstates-gross.xlsData 1AD92
2024Oklahomavented_flaredNA0annual_NA_series_zeronga24.pdfstates-vented-flared.xlsData 1U92
2020Oregongross_withdrawals320320same_numeric0nga24.pdfstates-gross.xlsData 2T57
2020Oregonvented_flared00same_numeric0nga24.pdfstates-vented-flared.xlsData 2S57
2021Oregongross_withdrawals205205same_numeric0nga24.pdfstates-gross.xlsData 2T58
2021Oregonvented_flaredNA0annual_NA_series_zeronga24.pdfstates-vented-flared.xlsData 2S58
2022Oregongross_withdrawals1313same_numeric0nga24.pdfstates-gross.xlsData 2T59
2022Oregonvented_flaredNA0annual_NA_series_zeronga24.pdfstates-vented-flared.xlsData 2S59
2023Oregongross_withdrawals9191same_numeric0nga24.pdfstates-gross.xlsData 2T60
2023Oregonvented_flaredNA0annual_NA_series_zeronga24.pdfstates-vented-flared.xlsData 2S60
2024Oregongross_withdrawals8484same_numeric0nga24.pdfstates-gross.xlsData 2T61
2024Oregonvented_flaredNA0annual_NA_series_zeronga24.pdfstates-vented-flared.xlsData 2S61
2020Pennsylvaniagross_withdrawals7,168,9027,168,902same_numeric0nga24.pdfstates-gross.xlsData 1AE88
2020Pennsylvaniavented_flaredNA0annual_NA_series_zeronga24.pdfstates-vented-flared.xlsData 1V88
2021Pennsylvaniagross_withdrawals7,647,0687,647,068same_numeric0nga24.pdfstates-gross.xlsData 1AE89
2021Pennsylvaniavented_flaredNA0annual_NA_series_zeronga24.pdfstates-vented-flared.xlsData 1V89
2022Pennsylvaniagross_withdrawals7,513,5677,513,567same_numeric0nga24.pdfstates-gross.xlsData 1AE90
2022Pennsylvaniavented_flaredNA0annual_NA_series_zeronga24.pdfstates-vented-flared.xlsData 1V90
2023Pennsylvaniagross_withdrawals7,565,6347,565,634same_numeric0nga24.pdfstates-gross.xlsData 1AE91
2023Pennsylvaniavented_flaredNA0annual_NA_series_zeronga24.pdfstates-vented-flared.xlsData 1V91
2024Pennsylvaniagross_withdrawals7,422,3037,422,303same_numeric0nga24.pdfstates-gross.xlsData 1AE92
2024Pennsylvaniavented_flaredNA0annual_NA_series_zeronga24.pdfstates-vented-flared.xlsData 1V92
2020Rhode Islandgross_withdrawals0no_series_cellnga24.pdf
2020Rhode Islandvented_flared0no_series_cellnga24.pdf
2021Rhode Islandgross_withdrawals0no_series_cellnga24.pdf
2021Rhode Islandvented_flared0no_series_cellnga24.pdf
2022Rhode Islandgross_withdrawals0no_series_cellnga24.pdf
2022Rhode Islandvented_flared0no_series_cellnga24.pdf
2023Rhode Islandgross_withdrawals0no_series_cellnga24.pdf
2023Rhode Islandvented_flared0no_series_cellnga24.pdf
2024Rhode Islandgross_withdrawals0no_series_cellnga24.pdf
2024Rhode Islandvented_flared0no_series_cellnga24.pdf
2020South Carolinagross_withdrawals0no_series_cellnga24.pdf
2020South Carolinavented_flared0no_series_cellnga24.pdf
2021South Carolinagross_withdrawals0no_series_cellnga24.pdf
2021South Carolinavented_flared0no_series_cellnga24.pdf
2022South Carolinagross_withdrawals0no_series_cellnga24.pdf
2022South Carolinavented_flared0no_series_cellnga24.pdf
2023South Carolinagross_withdrawals0no_series_cellnga24.pdf
2023South Carolinavented_flared0no_series_cellnga24.pdf
2024South Carolinagross_withdrawals0no_series_cellnga24.pdf
2024South Carolinavented_flared0no_series_cellnga24.pdf
2020South Dakotagross_withdrawals160160same_numeric0nga24.pdfstates-gross.xlsData 2U57
2020South Dakotavented_flaredNA0annual_NA_series_zeronga24.pdfstates-vented-flared.xlsData 2T57
2021South Dakotagross_withdrawals161161same_numeric0nga24.pdfstates-gross.xlsData 2U58
2021South Dakotavented_flaredNA0annual_NA_series_zeronga24.pdfstates-vented-flared.xlsData 2T58
2022South Dakotagross_withdrawals165165same_numeric0nga24.pdfstates-gross.xlsData 2U59
2022South Dakotavented_flaredNA0annual_NA_series_zeronga24.pdfstates-vented-flared.xlsData 2T59
2023South Dakotagross_withdrawals125125same_numeric0nga24.pdfstates-gross.xlsData 2U60
2023South Dakotavented_flaredNA0annual_NA_series_zeronga24.pdfstates-vented-flared.xlsData 2T60
2024South Dakotagross_withdrawals135135same_numeric0nga24.pdfstates-gross.xlsData 2U61
2024South Dakotavented_flared00same_numeric0nga24.pdfstates-vented-flared.xlsData 2T61
2020Tennesseegross_withdrawals3,6023,602same_numeric0nga24.pdfstates-gross.xlsData 2V57
2020Tennesseevented_flaredNA0annual_NA_series_zeronga24.pdfstates-vented-flared.xlsData 2U57
2021Tennesseegross_withdrawals3,0163,016same_numeric0nga24.pdfstates-gross.xlsData 2V58
2021Tennesseevented_flaredNA0annual_NA_series_zeronga24.pdfstates-vented-flared.xlsData 2U58
2022Tennesseegross_withdrawals3,0013,001same_numeric0nga24.pdfstates-gross.xlsData 2V59
2022Tennesseevented_flaredNA0annual_NA_series_zeronga24.pdfstates-vented-flared.xlsData 2U59
2023Tennesseegross_withdrawals2,6602,660same_numeric0nga24.pdfstates-gross.xlsData 2V60
2023Tennesseevented_flaredNA0annual_NA_series_zeronga24.pdfstates-vented-flared.xlsData 2U60
2024Tennesseegross_withdrawals2,6672,667same_numeric0nga24.pdfstates-gross.xlsData 2V61
2024Tennesseevented_flaredNA0annual_NA_series_zeronga24.pdfstates-vented-flared.xlsData 2U61
2020Texasgross_withdrawals10,489,72710,489,727same_numeric0nga24.pdfstates-gross.xlsData 1AF88
2020Texasvented_flared125,336125,336same_numeric0nga24.pdfstates-vented-flared.xlsData 1W88
2021Texasgross_withdrawals10,743,10610,743,106same_numeric0nga24.pdfstates-gross.xlsData 1AF89
2021Texasvented_flared102,267102,267same_numeric0nga24.pdfstates-vented-flared.xlsData 1W89
2022Texasgross_withdrawals11,438,59411,438,594same_numeric0nga24.pdfstates-gross.xlsData 1AF90
2022Texasvented_flared99,69899,698same_numeric0nga24.pdfstates-vented-flared.xlsData 1W90
2023Texasgross_withdrawals12,232,99712,232,997same_numeric0nga24.pdfstates-gross.xlsData 1AF91
2023Texasvented_flared156,021156,021same_numeric0nga24.pdfstates-vented-flared.xlsData 1W91
2024Texasgross_withdrawals12,918,98712,918,987same_numeric0nga24.pdfstates-gross.xlsData 1AF92
2024Texasvented_flared163,512163,512same_numeric0nga24.pdfstates-vented-flared.xlsData 1W92
2020Utahgross_withdrawals242,560242,560same_numeric0nga24.pdfstates-gross.xlsData 1AJ88
2020Utahvented_flared595595same_numeric0nga24.pdfstates-vented-flared.xlsData 1Z88
2021Utahgross_withdrawals239,951239,951same_numeric0nga24.pdfstates-gross.xlsData 1AJ89
2021Utahvented_flared529529same_numeric0nga24.pdfstates-vented-flared.xlsData 1Z89
2022Utahgross_withdrawals260,553260,553same_numeric0nga24.pdfstates-gross.xlsData 1AJ90
2022Utahvented_flared1,0371,037same_numeric0nga24.pdfstates-vented-flared.xlsData 1Z90
2023Utahgross_withdrawals289,826289,826same_numeric0nga24.pdfstates-gross.xlsData 1AJ91
2023Utahvented_flared1,8671,867same_numeric0nga24.pdfstates-vented-flared.xlsData 1Z91
2024Utahgross_withdrawals306,320306,320same_numeric0nga24.pdfstates-gross.xlsData 1AJ92
2024Utahvented_flared1,9321,932same_numeric0nga24.pdfstates-vented-flared.xlsData 1Z92
2020Vermontgross_withdrawals0no_series_cellnga24.pdf
2020Vermontvented_flared0no_series_cellnga24.pdf
2021Vermontgross_withdrawals0no_series_cellnga24.pdf
2021Vermontvented_flared0no_series_cellnga24.pdf
2022Vermontgross_withdrawals0no_series_cellnga24.pdf
2022Vermontvented_flared0no_series_cellnga24.pdf
2023Vermontgross_withdrawals0no_series_cellnga24.pdf
2023Vermontvented_flared0no_series_cellnga24.pdf
2024Vermontgross_withdrawals0no_series_cellnga24.pdf
2024Vermontvented_flared0no_series_cellnga24.pdf
2020Virginiagross_withdrawals102,815102,815same_numeric0nga24.pdfstates-gross.xlsData 2W57
2020Virginiavented_flaredNA0annual_NA_series_zeronga24.pdfstates-vented-flared.xlsData 2V57
2021Virginiagross_withdrawals96,04496,044same_numeric0nga24.pdfstates-gross.xlsData 2W58
2021Virginiavented_flaredNA0annual_NA_series_zeronga24.pdfstates-vented-flared.xlsData 2V58
2022Virginiagross_withdrawals88,41188,411same_numeric0nga24.pdfstates-gross.xlsData 2W59
2022Virginiavented_flaredNA0annual_NA_series_zeronga24.pdfstates-vented-flared.xlsData 2V59
2023Virginiagross_withdrawals83,55883,558same_numeric0nga24.pdfstates-gross.xlsData 2W60
2023Virginiavented_flaredNA0annual_NA_series_zeronga24.pdfstates-vented-flared.xlsData 2V60
2024Virginiagross_withdrawals80,89680,896same_numeric0nga24.pdfstates-gross.xlsData 2W61
2024Virginiavented_flaredNA0annual_NA_series_zeronga24.pdfstates-vented-flared.xlsData 2V61
2020Washingtongross_withdrawals0no_series_cellnga24.pdf
2020Washingtonvented_flared0no_series_cellnga24.pdf
2021Washingtongross_withdrawals0no_series_cellnga24.pdf
2021Washingtonvented_flared0no_series_cellnga24.pdf
2022Washingtongross_withdrawals0no_series_cellnga24.pdf
2022Washingtonvented_flared0no_series_cellnga24.pdf
2023Washingtongross_withdrawals0no_series_cellnga24.pdf
2023Washingtonvented_flared0no_series_cellnga24.pdf
2024Washingtongross_withdrawals0no_series_cellnga24.pdf
2024Washingtonvented_flared0no_series_cellnga24.pdf
2020West Virginiagross_withdrawals2,567,9902,567,990same_numeric0nga24.pdfstates-gross.xlsData 1AK88
2020West Virginiavented_flaredNA0annual_NA_series_zeronga24.pdfstates-vented-flared.xlsData 1AA88
2021West Virginiagross_withdrawals2,675,1452,675,145same_numeric0nga24.pdfstates-gross.xlsData 1AK89
2021West Virginiavented_flaredNA0annual_NA_series_zeronga24.pdfstates-vented-flared.xlsData 1AA89
2022West Virginiagross_withdrawals2,845,0822,845,082same_numeric0nga24.pdfstates-gross.xlsData 1AK90
2022West Virginiavented_flaredNA0annual_NA_series_zeronga24.pdfstates-vented-flared.xlsData 1AA90
2023West Virginiagross_withdrawals3,140,0043,140,004same_numeric0nga24.pdfstates-gross.xlsData 1AK91
2023West Virginiavented_flaredNA0annual_NA_series_zeronga24.pdfstates-vented-flared.xlsData 1AA91
2024West Virginiagross_withdrawals3,417,9953,417,995same_numeric0nga24.pdfstates-gross.xlsData 1AK92
2024West Virginiavented_flaredNA0annual_NA_series_zeronga24.pdfstates-vented-flared.xlsData 1AA92
2020Wisconsingross_withdrawals0no_series_cellnga24.pdf
2020Wisconsinvented_flared0no_series_cellnga24.pdf
2021Wisconsingross_withdrawals0no_series_cellnga24.pdf
2021Wisconsinvented_flared0no_series_cellnga24.pdf
2022Wisconsingross_withdrawals0no_series_cellnga24.pdf
2022Wisconsinvented_flared0no_series_cellnga24.pdf
2023Wisconsingross_withdrawals0no_series_cellnga24.pdf
2023Wisconsinvented_flared0no_series_cellnga24.pdf
2024Wisconsingross_withdrawals0no_series_cellnga24.pdf
2024Wisconsinvented_flared0no_series_cellnga24.pdf
2020Wyominggross_withdrawals1,472,8731,472,873same_numeric0nga24.pdfstates-gross.xlsData 1AL88
2020Wyomingvented_flared60,41560,415same_numeric0nga24.pdfstates-vented-flared.xlsData 1AB88
2021Wyominggross_withdrawals1,375,4541,375,454same_numeric0nga24.pdfstates-gross.xlsData 1AL89
2021Wyomingvented_flared65,74265,742same_numeric0nga24.pdfstates-vented-flared.xlsData 1AB89
2022Wyominggross_withdrawals1,298,5661,298,566same_numeric0nga24.pdfstates-gross.xlsData 1AL90
2022Wyomingvented_flared58,67558,675same_numeric0nga24.pdfstates-vented-flared.xlsData 1AB90
2023Wyominggross_withdrawals1,310,0601,310,060same_numeric0nga24.pdfstates-gross.xlsData 1AL91
2023Wyomingvented_flared55,96155,961same_numeric0nga24.pdfstates-vented-flared.xlsData 1AB91
2024Wyominggross_withdrawals1,343,2901,343,290same_numeric0nga24.pdfstates-gross.xlsData 1AL92
2024Wyomingvented_flared59,94159,941same_numeric0nga24.pdfstates-vented-flared.xlsData 1AB92
2012United Statesgross_withdrawals29,542,31329,542,313same_numeric0nga2012.pdfstates-gross.xlsData 1B80
2012United Statesvented_flared212,848212,848same_numeric0nga2012.pdfstates-vented-flared.xlsData 1B80
2012Alabamagross_withdrawals215,710215,710same_numeric0nga2012.pdfstates-gross.xlsData 2C49
2012Alabamavented_flaredNA0annual_NA_series_zeronga2012.pdfstates-vented-flared.xlsData 2C49
2012Alaskagross_withdrawals3,164,7913,164,791same_numeric0nga2012.pdfstates-gross.xlsData 1F80
2012Alaskavented_flared11,76911,769same_numeric0nga2012.pdfstates-vented-flared.xlsData 1C80
2012Arizonagross_withdrawals117117same_numeric0nga2012.pdfstates-gross.xlsData 2G49
2012Arizonavented_flared00same_numeric0nga2012.pdfstates-vented-flared.xlsData 2F49
2012Arkansasgross_withdrawals1,146,1681,146,168same_numeric0nga2012.pdfstates-gross.xlsData 1J80
2012Arkansasvented_flaredNA0annual_NA_series_zeronga2012.pdfstates-vented-flared.xlsData 1F80
2012Californiagross_withdrawals246,822246,822same_numeric0nga2012.pdfstates-gross.xlsData 1K80
2012Californiavented_flaredNA0annual_NA_series_zeronga2012.pdfstates-vented-flared.xlsData 1G80
2012Coloradogross_withdrawals1,709,3761,709,376same_numeric0nga2012.pdfstates-gross.xlsData 1P80
2012Coloradovented_flaredNA0annual_NA_series_zeronga2012.pdfstates-vented-flared.xlsData 1K80
2012Floridagross_withdrawals18,68118,681same_numeric0nga2012.pdfstates-gross.xlsData 2H49
2012Floridavented_flared00same_numeric0nga2012.pdfstates-vented-flared.xlsData 2G49
2012Federal offshore Gulfgross_withdrawals1,527,8751,527,875same_numeric0nga2012.pdfstates-gross.xlsData 1Q80
2012Federal offshore Gulfvented_flared16,29616,296same_numeric0nga2012.pdfstates-vented-flared.xlsData 1L80
2012Illinoisgross_withdrawals2,1252,125same_numeric0nga2012.pdfstates-gross.xlsData 2J49
2012Illinoisvented_flared00same_numeric0nga2012.pdfstates-vented-flared.xlsData 2I49
2012Indianagross_withdrawals8,8148,814same_numeric0nga2012.pdfstates-gross.xlsData 2K49
2012Indianavented_flaredNA0annual_NA_series_zeronga2012.pdfstates-vented-flared.xlsData 2J49
2012Kansasgross_withdrawals296,299296,299same_numeric0nga2012.pdfstates-gross.xlsData 1U80
2012Kansasvented_flaredNA0annual_NA_series_zeronga2012.pdfstates-vented-flared.xlsData 1M80
2012Kentuckygross_withdrawals106,122106,122same_numeric0nga2012.pdfstates-gross.xlsData 2L49
2012Kentuckyvented_flared00same_numeric0nga2012.pdfstates-vented-flared.xlsData 2K49
2012Louisianagross_withdrawals2,955,4372,955,437same_numeric0nga2012.pdfstates-gross.xlsData 1V80
2012Louisianavented_flaredNA0annual_NA_series_zeronga2012.pdfstates-vented-flared.xlsData 1N80
2012Marylandgross_withdrawals4444same_numeric0nga2012.pdfstates-gross.xlsData 2M49
2012Marylandvented_flared00same_numeric0nga2012.pdfstates-vented-flared.xlsData 2L49
2012Michigangross_withdrawals129,333129,333same_numeric0nga2012.pdfstates-gross.xlsData 2N49
2012Michiganvented_flaredNA0annual_NA_series_zeronga2012.pdfstates-vented-flared.xlsData 2M49
2012Mississippigross_withdrawals452,915452,915same_numeric0nga2012.pdfstates-gross.xlsData 2O49
2012Mississippivented_flaredNA0annual_NA_series_zeronga2012.pdfstates-vented-flared.xlsData 2N49
2012Montanagross_withdrawals66,95466,954same_numeric0nga2012.pdfstates-gross.xlsData 1Z80
2012Montanavented_flaredNA0annual_NA_series_zeronga2012.pdfstates-vented-flared.xlsData 1Q80
2012Nebraskagross_withdrawals1,3281,328same_numeric0nga2012.pdfstates-gross.xlsData 2Q49
2012Nebraskavented_flaredNA0annual_NA_series_zeronga2012.pdfstates-vented-flared.xlsData 2P49
2012Nevadagross_withdrawals44same_numeric0nga2012.pdfstates-gross.xlsData 2R49
2012Nevadavented_flared00same_numeric0nga2012.pdfstates-vented-flared.xlsData 2Q49
2012New Mexicogross_withdrawals1,276,2961,276,296same_numeric0nga2012.pdfstates-gross.xlsData 1AA80
2012New Mexicovented_flared12,25912,259same_numeric0nga2012.pdfstates-vented-flared.xlsData 1R80
2012New Yorkgross_withdrawals26,42426,424same_numeric0nga2012.pdfstates-gross.xlsData 2S49
2012New Yorkvented_flared00same_numeric0nga2012.pdfstates-vented-flared.xlsData 2R49
2012North Dakotagross_withdrawals258,568258,568same_numeric0nga2012.pdfstates-gross.xlsData 1AB80
2012North Dakotavented_flared79,56479,564same_numeric0nga2012.pdfstates-vented-flared.xlsData 1S80
2012Ohiogross_withdrawals84,48284,482same_numeric0nga2012.pdfstates-gross.xlsData 1AC80
2012Ohiovented_flaredNA0annual_NA_series_zeronga2012.pdfstates-vented-flared.xlsData 1T80
2012Oklahomagross_withdrawals2,023,4612,023,461same_numeric0nga2012.pdfstates-gross.xlsData 1AD80
2012Oklahomavented_flaredNA0annual_NA_series_zeronga2012.pdfstates-vented-flared.xlsData 1U80
2012Oregongross_withdrawals770770same_numeric0nga2012.pdfstates-gross.xlsData 2T49
2012Oregonvented_flared00same_numeric0nga2012.pdfstates-vented-flared.xlsData 2S49
2012Pennsylvaniagross_withdrawals2,256,6962,256,696same_numeric0nga2012.pdfstates-gross.xlsData 1AE80
2012Pennsylvaniavented_flaredNA0annual_NA_series_zeronga2012.pdfstates-vented-flared.xlsData 1V80
2012South Dakotagross_withdrawals15,08515,085same_numeric0nga2012.pdfstates-gross.xlsData 2U49
2012South Dakotavented_flaredNA0annual_NA_series_zeronga2012.pdfstates-vented-flared.xlsData 2T49
2012Tennesseegross_withdrawals5,8255,825same_numeric0nga2012.pdfstates-gross.xlsData 2V49
2012Tennesseevented_flaredNA0annual_NA_series_zeronga2012.pdfstates-vented-flared.xlsData 2U49
2012Texasgross_withdrawals8,143,5108,143,510same_numeric0nga2012.pdfstates-gross.xlsData 1AF80
2012Texasvented_flared47,53047,530same_numeric0nga2012.pdfstates-vented-flared.xlsData 1W80
2012Utahgross_withdrawals490,393490,393same_numeric0nga2012.pdfstates-gross.xlsData 1AJ80
2012Utahvented_flaredNA0annual_NA_series_zeronga2012.pdfstates-vented-flared.xlsData 1Z80
2012Virginiagross_withdrawals146,405146,405same_numeric0nga2012.pdfstates-gross.xlsData 2W49
2012Virginiavented_flaredNA0annual_NA_series_zeronga2012.pdfstates-vented-flared.xlsData 2V49
2012West Virginiagross_withdrawals539,860539,860same_numeric0nga2012.pdfstates-gross.xlsData 1AK80
2012West Virginiavented_flared00same_numeric0nga2012.pdfstates-vented-flared.xlsData 1AA80
2012Wyominggross_withdrawals2,225,6222,225,622same_numeric0nga2012.pdfstates-gross.xlsData 1AL80
2012Wyomingvented_flared45,42945,429same_numeric0nga2012.pdfstates-vented-flared.xlsData 1AB80
2013United Statesgross_withdrawals30,005,25429,522,551numeric_revision-482,703nga2013.pdfstates-gross.xlsData 1B81
2013United Statesvented_flared260,394260,394same_numeric0nga2013.pdfstates-vented-flared.xlsData 1B81
2013Alabamagross_withdrawals196,326196,326same_numeric0nga2013.pdfstates-gross.xlsData 2C50
2013Alabamavented_flaredNA0annual_NA_series_zeronga2013.pdfstates-vented-flared.xlsData 2C50
2013Alaskagross_withdrawals3,215,3583,215,358same_numeric0nga2013.pdfstates-gross.xlsData 1F81
2013Alaskavented_flared7,2197,219same_numeric0nga2013.pdfstates-vented-flared.xlsData 1C81
2013Arizonagross_withdrawals7272same_numeric0nga2013.pdfstates-gross.xlsData 2G50
2013Arizonavented_flared00same_numeric0nga2013.pdfstates-vented-flared.xlsData 2F50
2013Arkansasgross_withdrawals1,139,6541,139,654same_numeric0nga2013.pdfstates-gross.xlsData 1J81
2013Arkansasvented_flaredNA0annual_NA_series_zeronga2013.pdfstates-vented-flared.xlsData 1F81
2013Californiagross_withdrawals252,310252,310same_numeric0nga2013.pdfstates-gross.xlsData 1K81
2013Californiavented_flaredNA0annual_NA_series_zeronga2013.pdfstates-vented-flared.xlsData 1G81
2013Coloradogross_withdrawals1,604,8601,604,860same_numeric0nga2013.pdfstates-gross.xlsData 1P81
2013Coloradovented_flaredNA0annual_NA_series_zeronga2013.pdfstates-vented-flared.xlsData 1K81
2013Floridagross_withdrawals18,01118,011same_numeric0nga2013.pdfstates-gross.xlsData 2H50
2013Floridavented_flared00same_numeric0nga2013.pdfstates-vented-flared.xlsData 2G50
2013Federal offshore Gulfgross_withdrawals1,326,6971,326,697same_numeric0nga2013.pdfstates-gross.xlsData 1Q81
2013Federal offshore Gulfvented_flared14,61914,619same_numeric0nga2013.pdfstates-vented-flared.xlsData 1L81
2013Illinoisgross_withdrawals2,8872,887same_numeric0nga2013.pdfstates-gross.xlsData 2J50
2013Illinoisvented_flared00same_numeric0nga2013.pdfstates-vented-flared.xlsData 2I50
2013Indianagross_withdrawals7,9387,938same_numeric0nga2013.pdfstates-gross.xlsData 2K50
2013Indianavented_flaredNA0annual_NA_series_zeronga2013.pdfstates-vented-flared.xlsData 2J50
2013Kansasgross_withdrawals292,467292,467same_numeric0nga2013.pdfstates-gross.xlsData 1U81
2013Kansasvented_flaredNA0annual_NA_series_zeronga2013.pdfstates-vented-flared.xlsData 1M81
2013Kentuckygross_withdrawals94,66594,665same_numeric0nga2013.pdfstates-gross.xlsData 2L50
2013Kentuckyvented_flared00same_numeric0nga2013.pdfstates-vented-flared.xlsData 2K50
2013Louisianagross_withdrawals2,413,5752,366,943numeric_revision-46,632nga2013.pdfstates-gross.xlsData 1V81
2013Louisianavented_flared3,9123,912same_numeric0nga2013.pdfstates-vented-flared.xlsData 1N81
2013Marylandgross_withdrawals3232same_numeric0nga2013.pdfstates-gross.xlsData 2M50
2013Marylandvented_flared00same_numeric0nga2013.pdfstates-vented-flared.xlsData 2L50
2013Michigangross_withdrawals123,622123,622same_numeric0nga2013.pdfstates-gross.xlsData 2N50
2013Michiganvented_flaredNA0annual_NA_series_zeronga2013.pdfstates-vented-flared.xlsData 2M50
2013Mississippigross_withdrawals413,32959,272numeric_revision-354,057nga2013.pdfstates-gross.xlsData 2O50
2013Mississippivented_flaredNA0annual_NA_series_zeronga2013.pdfstates-vented-flared.xlsData 2N50
2013Montanagross_withdrawals63,24263,242same_numeric0nga2013.pdfstates-gross.xlsData 1Z81
2013Montanavented_flaredNA0annual_NA_series_zeronga2013.pdfstates-vented-flared.xlsData 1Q81
2013Nebraskagross_withdrawals1,0321,032same_numeric0nga2013.pdfstates-gross.xlsData 2Q50
2013Nebraskavented_flaredNA0annual_NA_series_zeronga2013.pdfstates-vented-flared.xlsData 2P50
2013Nevadagross_withdrawals33same_numeric0nga2013.pdfstates-gross.xlsData 2R50
2013Nevadavented_flared00same_numeric0nga2013.pdfstates-vented-flared.xlsData 2Q50
2013New Mexicogross_withdrawals1,271,1851,247,394numeric_revision-23,791nga2013.pdfstates-gross.xlsData 1AA81
2013New Mexicovented_flared21,05321,053same_numeric0nga2013.pdfstates-vented-flared.xlsData 1R81
2013New Yorkgross_withdrawals23,45823,458same_numeric0nga2013.pdfstates-gross.xlsData 2S50
2013New Yorkvented_flared00same_numeric0nga2013.pdfstates-vented-flared.xlsData 2R50
2013North Dakotagross_withdrawals345,787345,787same_numeric0nga2013.pdfstates-gross.xlsData 1AB81
2013North Dakotavented_flared102,855102,855same_numeric0nga2013.pdfstates-vented-flared.xlsData 1S81
2013Ohiogross_withdrawals186,181166,017numeric_revision-20,164nga2013.pdfstates-gross.xlsData 1AC81
2013Ohiovented_flaredNA0annual_NA_series_zeronga2013.pdfstates-vented-flared.xlsData 1T81
2013Oklahomagross_withdrawals2,143,9991,993,754numeric_revision-150,245nga2013.pdfstates-gross.xlsData 1AD81
2013Oklahomavented_flaredNA0annual_NA_series_zeronga2013.pdfstates-vented-flared.xlsData 1U81
2013Oregongross_withdrawals770770same_numeric0nga2013.pdfstates-gross.xlsData 2T50
2013Oregonvented_flared00same_numeric0nga2013.pdfstates-vented-flared.xlsData 2S50
2013Pennsylvaniagross_withdrawals3,259,0423,259,042same_numeric0nga2013.pdfstates-gross.xlsData 1AE81
2013Pennsylvaniavented_flaredNA0annual_NA_series_zeronga2013.pdfstates-vented-flared.xlsData 1V81
2013South Dakotagross_withdrawals16,20516,205same_numeric0nga2013.pdfstates-gross.xlsData 2U50
2013South Dakotavented_flaredNA0annual_NA_series_zeronga2013.pdfstates-vented-flared.xlsData 2T50
2013Tennesseegross_withdrawals5,4005,400same_numeric0nga2013.pdfstates-gross.xlsData 2V50
2013Tennesseevented_flaredNA0annual_NA_series_zeronga2013.pdfstates-vented-flared.xlsData 2U50
2013Texasgross_withdrawals8,211,2558,299,472numeric_revision88,217nga2013.pdfstates-gross.xlsData 1AF81
2013Texasvented_flared76,11376,113same_numeric0nga2013.pdfstates-vented-flared.xlsData 1W81
2013Utahgross_withdrawals470,863470,863same_numeric0nga2013.pdfstates-gross.xlsData 1AJ81
2013Utahvented_flaredNA0annual_NA_series_zeronga2013.pdfstates-vented-flared.xlsData 1Z81
2013Virginiagross_withdrawals139,382139,382same_numeric0nga2013.pdfstates-gross.xlsData 2W50
2013Virginiavented_flaredNA0annual_NA_series_zeronga2013.pdfstates-vented-flared.xlsData 2V50
2013West Virginiagross_withdrawals717,892741,853numeric_revision23,961nga2013.pdfstates-gross.xlsData 1AK81
2013West Virginiavented_flared00same_numeric0nga2013.pdfstates-vented-flared.xlsData 1AA81
2013Wyominggross_withdrawals2,047,7572,047,757same_numeric0nga2013.pdfstates-gross.xlsData 1AL81
2013Wyomingvented_flared34,62234,622same_numeric0nga2013.pdfstates-vented-flared.xlsData 1AB81
2014United Statesgross_withdrawals31,345,54631,405,381numeric_revision59,835nga2014.pdfstates-gross.xlsData 1B82
2014United Statesvented_flared288,743293,916numeric_revision5,173nga2014.pdfstates-vented-flared.xlsData 1B82
2014Alabamagross_withdrawals181,054181,060numeric_revision6nga2014.pdfstates-gross.xlsData 2C51
2014Alabamavented_flaredNAavailability_differencenga2014.pdfstates-vented-flared.xlsData 2C51
2014Alaskagross_withdrawals3,168,5663,168,545numeric_revision-21nga2014.pdfstates-gross.xlsData 1F82
2014Alaskavented_flared6,5546,554same_numeric0nga2014.pdfstates-vented-flared.xlsData 1C82
2014Arizonagross_withdrawals106106same_numeric0nga2014.pdfstates-gross.xlsData 2G51
2014Arizonavented_flared00same_numeric0nga2014.pdfstates-vented-flared.xlsData 2F51
2014Arkansasgross_withdrawals1,123,6781,122,733numeric_revision-945nga2014.pdfstates-gross.xlsData 1J82
2014Arkansasvented_flaredNAavailability_differencenga2014.pdfstates-vented-flared.xlsData 1F82
2014Californiagross_withdrawals252,718238,988numeric_revision-13,730nga2014.pdfstates-gross.xlsData 1K82
2014Californiavented_flaredNAavailability_differencenga2014.pdfstates-vented-flared.xlsData 1G82
2014Coloradogross_withdrawals1,631,3901,643,487numeric_revision12,097nga2014.pdfstates-gross.xlsData 1P82
2014Coloradovented_flaredNAavailability_differencenga2014.pdfstates-vented-flared.xlsData 1K82
2014Floridagross_withdrawals21,2593,178numeric_revision-18,081nga2014.pdfstates-gross.xlsData 2H51
2014Floridavented_flared0availability_differencenga2014.pdfstates-vented-flared.xlsData 2G51
2014Federal offshore Gulfgross_withdrawals1,275,2131,275,738numeric_revision525nga2014.pdfstates-gross.xlsData 1Q82
2014Federal offshore Gulfvented_flared15,12316,575numeric_revision1,452nga2014.pdfstates-vented-flared.xlsData 1L82
2014Illinoisgross_withdrawals2,6261,929numeric_revision-697nga2014.pdfstates-gross.xlsData 2J51
2014Illinoisvented_flared0availability_differencenga2014.pdfstates-vented-flared.xlsData 2I51
2014Indianagross_withdrawals6,6166,616same_numeric0nga2014.pdfstates-gross.xlsData 2K51
2014Indianavented_flaredNA0annual_NA_series_zeronga2014.pdfstates-vented-flared.xlsData 2J51
2014Kansasgross_withdrawals286,080286,480numeric_revision400nga2014.pdfstates-gross.xlsData 1U82
2014Kansasvented_flaredNAavailability_differencenga2014.pdfstates-vented-flared.xlsData 1M82
2014Kentuckygross_withdrawals78,73793,091numeric_revision14,354nga2014.pdfstates-gross.xlsData 2L51
2014Kentuckyvented_flared0availability_differencenga2014.pdfstates-vented-flared.xlsData 2K51
2014Louisianagross_withdrawals1,987,6301,968,618numeric_revision-19,012nga2014.pdfstates-gross.xlsData 1V82
2014Louisianavented_flared4,1434,606numeric_revision463nga2014.pdfstates-vented-flared.xlsData 1N82
2014Marylandgross_withdrawals2020same_numeric0nga2014.pdfstates-gross.xlsData 2M51
2014Marylandvented_flared00same_numeric0nga2014.pdfstates-vented-flared.xlsData 2L51
2014Michigangross_withdrawals114,946115,065numeric_revision119nga2014.pdfstates-gross.xlsData 2N51
2014Michiganvented_flaredNAavailability_differencenga2014.pdfstates-vented-flared.xlsData 2M51
2014Mississippigross_withdrawals54,44054,446numeric_revision6nga2014.pdfstates-gross.xlsData 2O51
2014Mississippivented_flaredNAavailability_differencenga2014.pdfstates-vented-flared.xlsData 2N51
2014Missourigross_withdrawals93numeric_revision-6nga2014.pdfstates-gross.xlsData 2P51
2014Missourivented_flared00same_numeric0nga2014.pdfstates-vented-flared.xlsData 2O51
2014Montanagross_withdrawals59,93059,160numeric_revision-770nga2014.pdfstates-gross.xlsData 1Z82
2014Montanavented_flaredNAavailability_differencenga2014.pdfstates-vented-flared.xlsData 1Q82
2014Nebraskagross_withdrawals402417numeric_revision15nga2014.pdfstates-gross.xlsData 2Q51
2014Nebraskavented_flaredNAavailability_differencenga2014.pdfstates-vented-flared.xlsData 2P51
2014Nevadagross_withdrawals33same_numeric0nga2014.pdfstates-gross.xlsData 2R51
2014Nevadavented_flared00same_numeric0nga2014.pdfstates-vented-flared.xlsData 2Q51
2014New Mexicogross_withdrawals1,265,5791,266,379numeric_revision800nga2014.pdfstates-gross.xlsData 1AA82
2014New Mexicovented_flared22,14319,119numeric_revision-3,024nga2014.pdfstates-vented-flared.xlsData 1R82
2014New Yorkgross_withdrawals20,20120,201same_numeric0nga2014.pdfstates-gross.xlsData 2S51
2014New Yorkvented_flared00same_numeric0nga2014.pdfstates-vented-flared.xlsData 2R51
2014North Dakotagross_withdrawals462,929463,216numeric_revision287nga2014.pdfstates-gross.xlsData 1AB82
2014North Dakotavented_flared129,384129,717numeric_revision333nga2014.pdfstates-vented-flared.xlsData 1S82
2014Ohiogross_withdrawals518,767512,371numeric_revision-6,396nga2014.pdfstates-gross.xlsData 1AC82
2014Ohiovented_flaredNA0annual_NA_series_zeronga2014.pdfstates-vented-flared.xlsData 1T82
2014Oklahomagross_withdrawals2,310,1142,331,086numeric_revision20,972nga2014.pdfstates-gross.xlsData 1AD82
2014Oklahomavented_flaredNA0annual_NA_series_zeronga2014.pdfstates-vented-flared.xlsData 1U82
2014Oregongross_withdrawals9501,142numeric_revision192nga2014.pdfstates-gross.xlsData 2T51
2014Oregonvented_flared00same_numeric0nga2014.pdfstates-vented-flared.xlsData 2S51
2014Pennsylvaniagross_withdrawals4,214,6434,257,693numeric_revision43,050nga2014.pdfstates-gross.xlsData 1AE82
2014Pennsylvaniavented_flaredNA0annual_NA_series_zeronga2014.pdfstates-vented-flared.xlsData 1V82
2014South Dakotagross_withdrawals15,30715,305numeric_revision-2nga2014.pdfstates-gross.xlsData 2U51
2014South Dakotavented_flaredNAavailability_differencenga2014.pdfstates-vented-flared.xlsData 2T51
2014Tennesseegross_withdrawals5,2945,294same_numeric0nga2014.pdfstates-gross.xlsData 2V51
2014Tennesseevented_flaredNA0annual_NA_series_zeronga2014.pdfstates-vented-flared.xlsData 2U51
2014Texasgross_withdrawals8,663,3338,659,188numeric_revision-4,145nga2014.pdfstates-gross.xlsData 1AF82
2014Texasvented_flared81,75590,125numeric_revision8,370nga2014.pdfstates-vented-flared.xlsData 1W82
2014Utahgross_withdrawals453,207454,545numeric_revision1,338nga2014.pdfstates-gross.xlsData 1AJ82
2014Utahvented_flaredNAavailability_differencenga2014.pdfstates-vented-flared.xlsData 1Z82
2014Virginiagross_withdrawals131,885133,661numeric_revision1,776nga2014.pdfstates-gross.xlsData 2W51
2014Virginiavented_flaredNAavailability_differencenga2014.pdfstates-vented-flared.xlsData 2V51
2014West Virginiagross_withdrawals1,040,2501,067,114numeric_revision26,864nga2014.pdfstates-gross.xlsData 1AK82
2014West Virginiavented_flared0availability_differencenga2014.pdfstates-vented-flared.xlsData 1AA82
2014Wyominggross_withdrawals1,997,6661,998,505numeric_revision839nga2014.pdfstates-gross.xlsData 1AL82
2014Wyomingvented_flared29,64127,220numeric_revision-2,421nga2014.pdfstates-vented-flared.xlsData 1AB82
2015United Statesgross_withdrawals32,894,72732,914,647numeric_revision19,920nga2015.pdfstates-gross.xlsData 1B83
2015United Statesvented_flared278,623289,545numeric_revision10,922nga2015.pdfstates-vented-flared.xlsData 1B83
2015Alabamagross_withdrawals168,249168,246numeric_revision-3nga2015.pdfstates-gross.xlsData 2C52
2015Alabamavented_flaredNA0annual_NA_series_zeronga2015.pdfstates-vented-flared.xlsData 2C52
2015Alaskagross_withdrawals3,175,3013,175,301same_numeric0nga2015.pdfstates-gross.xlsData 1F83
2015Alaskavented_flared5,4775,385numeric_revision-92nga2015.pdfstates-vented-flared.xlsData 1C83
2015Arizonagross_withdrawals9595same_numeric0nga2015.pdfstates-gross.xlsData 2G52
2015Arizonavented_flared00same_numeric0nga2015.pdfstates-vented-flared.xlsData 2F52
2015Arkansasgross_withdrawals1,010,2741,010,382numeric_revision108nga2015.pdfstates-gross.xlsData 1J83
2015Arkansasvented_flaredNA0annual_NA_series_zeronga2015.pdfstates-vented-flared.xlsData 1F83
2015Californiagross_withdrawals231,060236,648numeric_revision5,588nga2015.pdfstates-gross.xlsData 1K83
2015Californiavented_flaredNA0annual_NA_series_zeronga2015.pdfstates-vented-flared.xlsData 1G83
2015Coloradogross_withdrawals1,704,8361,688,733numeric_revision-16,103nga2015.pdfstates-gross.xlsData 1P83
2015Coloradovented_flaredNA0annual_NA_series_zeronga2015.pdfstates-vented-flared.xlsData 1K83
2015Floridagross_withdrawals5,7905,790same_numeric0nga2015.pdfstates-gross.xlsData 2H52
2015Floridavented_flaredNA0annual_NA_series_zeronga2015.pdfstates-vented-flared.xlsData 2G52
2015Federal offshore Gulfgross_withdrawals1,309,3801,307,641numeric_revision-1,739nga2015.pdfstates-gross.xlsData 1Q83
2015Federal offshore Gulfvented_flared16,29010,858numeric_revision-5,432nga2015.pdfstates-vented-flared.xlsData 1L83
2015Illinoisgross_withdrawals2,0802,080same_numeric0nga2015.pdfstates-gross.xlsData 2J52
2015Illinoisvented_flaredNA0annual_NA_series_zeronga2015.pdfstates-vented-flared.xlsData 2I52
2015Indianagross_withdrawals7,2507,250same_numeric0nga2015.pdfstates-gross.xlsData 2K52
2015Indianavented_flaredNA0annual_NA_series_zeronga2015.pdfstates-vented-flared.xlsData 2J52
2015Kansasgross_withdrawals285,236284,184numeric_revision-1,052nga2015.pdfstates-gross.xlsData 1U83
2015Kansasvented_flaredNA0annual_NA_series_zeronga2015.pdfstates-vented-flared.xlsData 1M83
2015Kentuckygross_withdrawals85,77595,907numeric_revision10,132nga2015.pdfstates-gross.xlsData 2L52
2015Kentuckyvented_flaredNA0annual_NA_series_zeronga2015.pdfstates-vented-flared.xlsData 2K52
2015Louisianagross_withdrawals1,784,7971,813,232numeric_revision28,435nga2015.pdfstates-gross.xlsData 1V83
2015Louisianavented_flared3,7483,787numeric_revision39nga2015.pdfstates-vented-flared.xlsData 1N83
2015Marylandgross_withdrawals2738numeric_revision11nga2015.pdfstates-gross.xlsData 2M52
2015Marylandvented_flared00same_numeric0nga2015.pdfstates-vented-flared.xlsData 2L52
2015Michigangross_withdrawals107,634107,664numeric_revision30nga2015.pdfstates-gross.xlsData 2N52
2015Michiganvented_flaredNA0annual_NA_series_zeronga2015.pdfstates-vented-flared.xlsData 2M52
2015Mississippigross_withdrawals58,20758,181numeric_revision-26nga2015.pdfstates-gross.xlsData 2O52
2015Mississippivented_flaredNA0annual_NA_series_zeronga2015.pdfstates-vented-flared.xlsData 2N52
2015Missourigross_withdrawals11same_numeric0nga2015.pdfstates-gross.xlsData 2P52
2015Missourivented_flared00same_numeric0nga2015.pdfstates-vented-flared.xlsData 2O52
2015Montanagross_withdrawals57,42158,240numeric_revision819nga2015.pdfstates-gross.xlsData 1Z83
2015Montanavented_flaredNA6,884availability_differencenga2015.pdfstates-vented-flared.xlsData 1Q83
2015Nebraskagross_withdrawals477477same_numeric0nga2015.pdfstates-gross.xlsData 2Q52
2015Nebraskavented_flaredNA0annual_NA_series_zeronga2015.pdfstates-vented-flared.xlsData 2P52
2015Nevadagross_withdrawals34numeric_revision1nga2015.pdfstates-gross.xlsData 2R52
2015Nevadavented_flared00same_numeric0nga2015.pdfstates-vented-flared.xlsData 2Q52
2015New Mexicogross_withdrawals1,296,4581,296,793numeric_revision335nga2015.pdfstates-gross.xlsData 1AA83
2015New Mexicovented_flared24,85024,850same_numeric0nga2015.pdfstates-vented-flared.xlsData 1R83
2015New Yorkgross_withdrawals17,82917,325numeric_revision-504nga2015.pdfstates-gross.xlsData 2S52
2015New Yorkvented_flared00same_numeric0nga2015.pdfstates-vented-flared.xlsData 2R52
2015North Dakotagross_withdrawals584,743584,632numeric_revision-111nga2015.pdfstates-gross.xlsData 1AB83
2015North Dakotavented_flared106,590106,565numeric_revision-25nga2015.pdfstates-vented-flared.xlsData 1S83
2015Ohiogross_withdrawals1,014,8481,007,270numeric_revision-7,578nga2015.pdfstates-gross.xlsData 1AC83
2015Ohiovented_flaredNA0annual_NA_series_zeronga2015.pdfstates-vented-flared.xlsData 1T83
2015Oklahomagross_withdrawals2,499,5992,499,599same_numeric0nga2015.pdfstates-gross.xlsData 1AD83
2015Oklahomavented_flaredNA0annual_NA_series_zeronga2015.pdfstates-vented-flared.xlsData 1U83
2015Oregongross_withdrawals848848same_numeric0nga2015.pdfstates-gross.xlsData 2T52
2015Oregonvented_flared00same_numeric0nga2015.pdfstates-vented-flared.xlsData 2S52
2015Pennsylvaniagross_withdrawals4,812,9834,812,983same_numeric0nga2015.pdfstates-gross.xlsData 1AE83
2015Pennsylvaniavented_flaredNA0annual_NA_series_zeronga2015.pdfstates-vented-flared.xlsData 1V83
2015South Dakotagross_withdrawals14,53114,510numeric_revision-21nga2015.pdfstates-gross.xlsData 2U52
2015South Dakotavented_flaredNA13,957availability_differencenga2015.pdfstates-vented-flared.xlsData 2T52
2015Tennesseegross_withdrawals4,2764,276same_numeric0nga2015.pdfstates-gross.xlsData 2V52
2015Tennesseevented_flaredNA0annual_NA_series_zeronga2015.pdfstates-vented-flared.xlsData 2U52
2015Texasgross_withdrawals8,801,2828,799,465numeric_revision-1,817nga2015.pdfstates-gross.xlsData 1AF83
2015Texasvented_flared113,786113,786same_numeric0nga2015.pdfstates-vented-flared.xlsData 1W83
2015Utahgross_withdrawals423,300417,020numeric_revision-6,280nga2015.pdfstates-gross.xlsData 1AJ83
2015Utahvented_flaredNA0annual_NA_series_zeronga2015.pdfstates-vented-flared.xlsData 1Z83
2015Virginiagross_withdrawals127,584127,586numeric_revision2nga2015.pdfstates-gross.xlsData 2W52
2015Virginiavented_flaredNA0annual_NA_series_zeronga2015.pdfstates-vented-flared.xlsData 2V52
2015West Virginiagross_withdrawals1,318,8221,315,248numeric_revision-3,574nga2015.pdfstates-gross.xlsData 1AK83
2015West Virginiavented_flaredNA0annual_NA_series_zeronga2015.pdfstates-vented-flared.xlsData 1AA83
2015Wyominggross_withdrawals1,983,7311,995,920numeric_revision12,189nga2015.pdfstates-gross.xlsData 1AL83
2015Wyomingvented_flared7,8833,473numeric_revision-4,410nga2015.pdfstates-vented-flared.xlsData 1AB83
2016United Statesgross_withdrawals32,635,51132,591,578numeric_revision-43,933nga2016.pdfstates-gross.xlsData 1B84
2016United Statesvented_flared210,554230,410numeric_revision19,856nga2016.pdfstates-vented-flared.xlsData 1B84
2016Alabamagross_withdrawals164,804164,815numeric_revision11nga2016.pdfstates-gross.xlsData 2C53
2016Alabamavented_flaredNAavailability_differencenga2016.pdfstates-vented-flared.xlsData 2C53
2016Alaskagross_withdrawals3,229,9683,230,193numeric_revision225nga2016.pdfstates-gross.xlsData 1F84
2016Alaskavented_flared8,5418,541same_numeric0nga2016.pdfstates-vented-flared.xlsData 1C84
2016Arizonagross_withdrawals4747same_numeric0nga2016.pdfstates-gross.xlsData 2G53
2016Arizonavented_flared00same_numeric0nga2016.pdfstates-vented-flared.xlsData 2F53
2016Arkansasgross_withdrawals823,223823,196numeric_revision-27nga2016.pdfstates-gross.xlsData 1J84
2016Arkansasvented_flaredNAavailability_differencenga2016.pdfstates-vented-flared.xlsData 1F84
2016Californiagross_withdrawals205,024205,025numeric_revision1nga2016.pdfstates-gross.xlsData 1K84
2016Californiavented_flaredNAavailability_differencenga2016.pdfstates-vented-flared.xlsData 1G84
2016Coloradogross_withdrawals1,701,7351,688,375numeric_revision-13,360nga2016.pdfstates-gross.xlsData 1P84
2016Coloradovented_flaredNA2,620availability_differencenga2016.pdfstates-vented-flared.xlsData 1K84
2016Floridagross_withdrawals3,43112,551numeric_revision9,120nga2016.pdfstates-gross.xlsData 2H53
2016Floridavented_flaredNAavailability_differencenga2016.pdfstates-vented-flared.xlsData 2G53
2016Federal offshore Gulfgross_withdrawals1,220,0221,220,656numeric_revision634nga2016.pdfstates-gross.xlsData 1Q84
2016Federal offshore Gulfvented_flared9,70615,067numeric_revision5,361nga2016.pdfstates-vented-flared.xlsData 1L84
2016Idahogross_withdrawals4,6374,637same_numeric0nga2016.pdfstates-gross.xlsData 2I53
2016Idahovented_flared00same_numeric0nga2016.pdfstates-vented-flared.xlsData 2H53
2016Illinoisgross_withdrawals2,1832,183same_numeric0nga2016.pdfstates-gross.xlsData 2J53
2016Illinoisvented_flaredNAavailability_differencenga2016.pdfstates-vented-flared.xlsData 2I53
2016Indianagross_withdrawals6,2056,205same_numeric0nga2016.pdfstates-gross.xlsData 2K53
2016Indianavented_flaredNA0annual_NA_series_zeronga2016.pdfstates-vented-flared.xlsData 2J53
2016Kansasgross_withdrawals243,459244,795numeric_revision1,336nga2016.pdfstates-gross.xlsData 1U84
2016Kansasvented_flaredNAavailability_differencenga2016.pdfstates-vented-flared.xlsData 1M84
2016Kentuckygross_withdrawals91,60991,640numeric_revision31nga2016.pdfstates-gross.xlsData 2L53
2016Kentuckyvented_flaredNAavailability_differencenga2016.pdfstates-vented-flared.xlsData 2K53
2016Louisianagross_withdrawals1,752,2691,793,406numeric_revision41,137nga2016.pdfstates-gross.xlsData 1V84
2016Louisianavented_flared5,1065,106same_numeric0nga2016.pdfstates-vented-flared.xlsData 1N84
2016Marylandgross_withdrawals3434same_numeric0nga2016.pdfstates-gross.xlsData 2M53
2016Marylandvented_flared00same_numeric0nga2016.pdfstates-vented-flared.xlsData 2L53
2016Michigangross_withdrawals100,599102,003numeric_revision1,404nga2016.pdfstates-gross.xlsData 2N53
2016Michiganvented_flaredNAavailability_differencenga2016.pdfstates-vented-flared.xlsData 2M53
2016Mississippigross_withdrawals48,50648,504numeric_revision-2nga2016.pdfstates-gross.xlsData 2O53
2016Mississippivented_flaredNAavailability_differencenga2016.pdfstates-vented-flared.xlsData 2N53
2016Missourigross_withdrawals11same_numeric0nga2016.pdfstates-gross.xlsData 2P53
2016Missourivented_flared00same_numeric0nga2016.pdfstates-vented-flared.xlsData 2O53
2016Montanagross_withdrawals52,12552,146numeric_revision21nga2016.pdfstates-gross.xlsData 1Z84
2016Montanavented_flared4,3184,214numeric_revision-104nga2016.pdfstates-vented-flared.xlsData 1Q84
2016Nebraskagross_withdrawals531526numeric_revision-5nga2016.pdfstates-gross.xlsData 2Q53
2016Nebraskavented_flaredNAavailability_differencenga2016.pdfstates-vented-flared.xlsData 2P53
2016Nevadagross_withdrawals33same_numeric0nga2016.pdfstates-gross.xlsData 2R53
2016Nevadavented_flared00same_numeric0nga2016.pdfstates-vented-flared.xlsData 2Q53
2016New Mexicogross_withdrawals1,284,6981,282,666numeric_revision-2,032nga2016.pdfstates-gross.xlsData 1AA84
2016New Mexicovented_flared6,16225,680numeric_revision19,518nga2016.pdfstates-vented-flared.xlsData 1R84
2016New Yorkgross_withdrawals13,44613,523numeric_revision77nga2016.pdfstates-gross.xlsData 2S53
2016New Yorkvented_flared00same_numeric0nga2016.pdfstates-vented-flared.xlsData 2R53
2016North Dakotagross_withdrawals608,832608,849numeric_revision17nga2016.pdfstates-gross.xlsData 1AB84
2016North Dakotavented_flared70,13670,045numeric_revision-91nga2016.pdfstates-vented-flared.xlsData 1S84
2016Ohiogross_withdrawals1,439,9051,437,285numeric_revision-2,620nga2016.pdfstates-gross.xlsData 1AC84
2016Ohiovented_flaredNA0annual_NA_series_zeronga2016.pdfstates-vented-flared.xlsData 1T84
2016Oklahomagross_withdrawals2,468,3122,468,312same_numeric0nga2016.pdfstates-gross.xlsData 1AD84
2016Oklahomavented_flaredNA0annual_NA_series_zeronga2016.pdfstates-vented-flared.xlsData 1U84
2016Oregongross_withdrawals937801numeric_revision-136nga2016.pdfstates-gross.xlsData 2T53
2016Oregonvented_flared00same_numeric0nga2016.pdfstates-vented-flared.xlsData 2S53
2016Pennsylvaniagross_withdrawals5,313,2585,210,209numeric_revision-103,049nga2016.pdfstates-gross.xlsData 1AE84
2016Pennsylvaniavented_flaredNA0annual_NA_series_zeronga2016.pdfstates-vented-flared.xlsData 1V84
2016South Dakotagross_withdrawals10,109455numeric_revision-9,654nga2016.pdfstates-gross.xlsData 2U53
2016South Dakotavented_flared9,6200numeric_revision-9,620nga2016.pdfstates-vented-flared.xlsData 2T53
2016Tennesseegross_withdrawals3,6033,603same_numeric0nga2016.pdfstates-gross.xlsData 2V53
2016Tennesseevented_flaredNA0annual_NA_series_zeronga2016.pdfstates-vented-flared.xlsData 2U53
2016Texasgross_withdrawals8,133,8378,156,296numeric_revision22,459nga2016.pdfstates-gross.xlsData 1AF84
2016Texasvented_flared87,52787,527same_numeric0nga2016.pdfstates-vented-flared.xlsData 1W84
2016Utahgross_withdrawals364,665365,268numeric_revision603nga2016.pdfstates-gross.xlsData 1AJ84
2016Utahvented_flaredNAavailability_differencenga2016.pdfstates-vented-flared.xlsData 1Z84
2016Virginiagross_withdrawals120,241120,288numeric_revision47nga2016.pdfstates-gross.xlsData 2W53
2016Virginiavented_flaredNAavailability_differencenga2016.pdfstates-vented-flared.xlsData 2V53
2016West Virginiagross_withdrawals1,375,1081,384,458numeric_revision9,350nga2016.pdfstates-gross.xlsData 1AK84
2016West Virginiavented_flaredNAavailability_differencenga2016.pdfstates-vented-flared.xlsData 1AA84
2016Wyominggross_withdrawals1,848,1451,848,623numeric_revision478nga2016.pdfstates-gross.xlsData 1AL84
2016Wyomingvented_flared9,43711,610numeric_revision2,173nga2016.pdfstates-vented-flared.xlsData 1AB84
2017United Statesgross_withdrawals33,357,37533,292,113numeric_revision-65,262nga2017.pdfstates-gross.xlsData 1B85
2017United Statesvented_flared235,570255,488numeric_revision19,918nga2017.pdfstates-vented-flared.xlsData 1B85
2017Alabamagross_withdrawals150,084150,038numeric_revision-46nga2017.pdfstates-gross.xlsData 2C54
2017Alabamavented_flaredNAavailability_differencenga2017.pdfstates-vented-flared.xlsData 2C54
2017Alaskagross_withdrawals3,250,7693,250,769same_numeric0nga2017.pdfstates-gross.xlsData 1F85
2017Alaskavented_flared7,6057,605same_numeric0nga2017.pdfstates-vented-flared.xlsData 1C85
2017Arizonagross_withdrawals5656same_numeric0nga2017.pdfstates-gross.xlsData 2G54
2017Arizonavented_flared00same_numeric0nga2017.pdfstates-vented-flared.xlsData 2F54
2017Arkansasgross_withdrawals707,292694,676numeric_revision-12,616nga2017.pdfstates-gross.xlsData 1J85
2017Arkansasvented_flaredNAavailability_differencenga2017.pdfstates-vented-flared.xlsData 1F85
2017Californiagross_withdrawals209,327212,458numeric_revision3,131nga2017.pdfstates-gross.xlsData 1K85
2017Californiavented_flaredNA0annual_NA_series_zeronga2017.pdfstates-vented-flared.xlsData 1G85
2017Coloradogross_withdrawals1,687,6671,710,643numeric_revision22,976nga2017.pdfstates-gross.xlsData 1P85
2017Coloradovented_flared4,2794,279same_numeric0nga2017.pdfstates-vented-flared.xlsData 1K85
2017Floridagross_withdrawals14,87114,870numeric_revision-1nga2017.pdfstates-gross.xlsData 2H54
2017Floridavented_flaredNAavailability_differencenga2017.pdfstates-vented-flared.xlsData 2G54
2017Federal offshore Gulfgross_withdrawals1,078,1301,078,218numeric_revision88nga2017.pdfstates-gross.xlsData 1Q85
2017Federal offshore Gulfvented_flared13,76413,733numeric_revision-31nga2017.pdfstates-vented-flared.xlsData 1L85
2017Idahogross_withdrawals3,7913,791same_numeric0nga2017.pdfstates-gross.xlsData 2I54
2017Idahovented_flared00same_numeric0nga2017.pdfstates-vented-flared.xlsData 2H54
2017Illinoisgross_withdrawals2,1312,131same_numeric0nga2017.pdfstates-gross.xlsData 2J54
2017Illinoisvented_flaredNAavailability_differencenga2017.pdfstates-vented-flared.xlsData 2I54
2017Indianagross_withdrawals5,9145,914same_numeric0nga2017.pdfstates-gross.xlsData 2K54
2017Indianavented_flaredNA0annual_NA_series_zeronga2017.pdfstates-vented-flared.xlsData 2J54
2017Kansasgross_withdrawals214,480219,639numeric_revision5,159nga2017.pdfstates-gross.xlsData 1U85
2017Kansasvented_flaredNAavailability_differencenga2017.pdfstates-vented-flared.xlsData 1M85
2017Kentuckygross_withdrawals88,71588,715same_numeric0nga2017.pdfstates-gross.xlsData 2L54
2017Kentuckyvented_flaredNAavailability_differencenga2017.pdfstates-vented-flared.xlsData 2K54
2017Louisianagross_withdrawals2,147,6122,148,704numeric_revision1,092nga2017.pdfstates-gross.xlsData 1V85
2017Louisianavented_flared5,1785,338numeric_revision160nga2017.pdfstates-vented-flared.xlsData 1N85
2017Marylandgross_withdrawals3232same_numeric0nga2017.pdfstates-gross.xlsData 2M54
2017Marylandvented_flared00same_numeric0nga2017.pdfstates-vented-flared.xlsData 2L54
2017Michigangross_withdrawals97,00096,451numeric_revision-549nga2017.pdfstates-gross.xlsData 2N54
2017Michiganvented_flaredNAavailability_differencenga2017.pdfstates-vented-flared.xlsData 2M54
2017Mississippigross_withdrawals38,43538,438numeric_revision3nga2017.pdfstates-gross.xlsData 2O54
2017Mississippivented_flaredNAavailability_differencenga2017.pdfstates-vented-flared.xlsData 2N54
2017Missourigross_withdrawals11same_numeric0nga2017.pdfstates-gross.xlsData 2P54
2017Missourivented_flared00same_numeric0nga2017.pdfstates-vented-flared.xlsData 2O54
2017Montanagross_withdrawals49,21849,437numeric_revision219nga2017.pdfstates-gross.xlsData 1Z85
2017Montanavented_flared3,1233,121numeric_revision-2nga2017.pdfstates-vented-flared.xlsData 1Q85
2017Nebraskagross_withdrawals455455same_numeric0nga2017.pdfstates-gross.xlsData 2Q54
2017Nebraskavented_flaredNAavailability_differencenga2017.pdfstates-vented-flared.xlsData 2P54
2017Nevadagross_withdrawals33same_numeric0nga2017.pdfstates-gross.xlsData 2R54
2017Nevadavented_flared00same_numeric0nga2017.pdfstates-vented-flared.xlsData 2Q54
2017New Mexicogross_withdrawals1,324,9091,323,019numeric_revision-1,890nga2017.pdfstates-gross.xlsData 1AA85
2017New Mexicovented_flared2,98417,494numeric_revision14,510nga2017.pdfstates-vented-flared.xlsData 1R85
2017New Yorkgross_withdrawals11,39511,395same_numeric0nga2017.pdfstates-gross.xlsData 2S54
2017New Yorkvented_flared00same_numeric0nga2017.pdfstates-vented-flared.xlsData 2R54
2017North Dakotagross_withdrawals688,605688,600numeric_revision-5nga2017.pdfstates-gross.xlsData 1AB85
2017North Dakotavented_flared88,50488,555numeric_revision51nga2017.pdfstates-vented-flared.xlsData 1S85
2017Ohiogross_withdrawals1,772,9321,791,359numeric_revision18,427nga2017.pdfstates-gross.xlsData 1AC85
2017Ohiovented_flaredNA0annual_NA_series_zeronga2017.pdfstates-vented-flared.xlsData 1T85
2017Oklahomagross_withdrawals2,513,8972,513,897same_numeric0nga2017.pdfstates-gross.xlsData 1AD85
2017Oklahomavented_flaredNA0annual_NA_series_zeronga2017.pdfstates-vented-flared.xlsData 1U85
2017Oregongross_withdrawals659659same_numeric0nga2017.pdfstates-gross.xlsData 2T54
2017Oregonvented_flared00same_numeric0nga2017.pdfstates-vented-flared.xlsData 2S54
2017Pennsylvaniagross_withdrawals5,463,8885,453,638numeric_revision-10,250nga2017.pdfstates-gross.xlsData 1AE85
2017Pennsylvaniavented_flaredNA0annual_NA_series_zeronga2017.pdfstates-vented-flared.xlsData 1V85
2017South Dakotagross_withdrawals476476same_numeric0nga2017.pdfstates-gross.xlsData 2U54
2017South Dakotavented_flared00same_numeric0nga2017.pdfstates-vented-flared.xlsData 2T54
2017Tennesseegross_withdrawals2,9822,982same_numeric0nga2017.pdfstates-gross.xlsData 2V54
2017Tennesseevented_flaredNA0annual_NA_series_zeronga2017.pdfstates-vented-flared.xlsData 2U54
2017Texasgross_withdrawals7,995,7368,079,974numeric_revision84,238nga2017.pdfstates-gross.xlsData 1AF85
2017Texasvented_flared101,00196,946numeric_revision-4,055nga2017.pdfstates-vented-flared.xlsData 1W85
2017Utahgross_withdrawals314,733315,211numeric_revision478nga2017.pdfstates-gross.xlsData 1AJ85
2017Utahvented_flaredNAavailability_differencenga2017.pdfstates-vented-flared.xlsData 1Z85
2017Virginiagross_withdrawals115,452115,452same_numeric0nga2017.pdfstates-gross.xlsData 2W54
2017Virginiavented_flaredNAavailability_differencenga2017.pdfstates-vented-flared.xlsData 2V54
2017West Virginiagross_withdrawals1,601,0471,514,278numeric_revision-86,769nga2017.pdfstates-gross.xlsData 1AK85
2017West Virginiavented_flaredNAavailability_differencenga2017.pdfstates-vented-flared.xlsData 1AA85
2017Wyominggross_withdrawals1,804,6811,715,732numeric_revision-88,949nga2017.pdfstates-gross.xlsData 1AL85
2017Wyomingvented_flared9,13218,417numeric_revision9,285nga2017.pdfstates-vented-flared.xlsData 1AB85
2018United Statesgross_withdrawals37,129,37437,325,539numeric_revision196,165nga2018.pdfstates-gross.xlsData 1B86
2018United Statesvented_flared468,347470,601numeric_revision2,254nga2018.pdfstates-vented-flared.xlsData 1B86
2018Alabamagross_withdrawals139,485139,477numeric_revision-8nga2018.pdfstates-gross.xlsData 2C55
2018Alabamavented_flaredNAavailability_differencenga2018.pdfstates-vented-flared.xlsData 2C55
2018Alaskagross_withdrawals3,254,7123,254,712same_numeric0nga2018.pdfstates-gross.xlsData 1F86
2018Alaskavented_flared8,2108,210same_numeric0nga2018.pdfstates-vented-flared.xlsData 1C86
2018Arizonagross_withdrawals4642numeric_revision-4nga2018.pdfstates-gross.xlsData 2G55
2018Arizonavented_flared00same_numeric0nga2018.pdfstates-vented-flared.xlsData 2F55
2018Arkansasgross_withdrawals589,973589,985numeric_revision12nga2018.pdfstates-gross.xlsData 1J86
2018Arkansasvented_flaredNAavailability_differencenga2018.pdfstates-vented-flared.xlsData 1F86
2018Californiagross_withdrawals202,616202,617numeric_revision1nga2018.pdfstates-gross.xlsData 1K86
2018Californiavented_flared00same_numeric0nga2018.pdfstates-vented-flared.xlsData 1G86
2018Coloradogross_withdrawals1,836,4221,853,423numeric_revision17,001nga2018.pdfstates-gross.xlsData 1P86
2018Coloradovented_flared5,0976,021numeric_revision924nga2018.pdfstates-vented-flared.xlsData 1K86
2018Floridagross_withdrawals15,42415,424same_numeric0nga2018.pdfstates-gross.xlsData 2H55
2018Floridavented_flaredNAavailability_differencenga2018.pdfstates-vented-flared.xlsData 2G55
2018Federal offshore Gulfgross_withdrawals993,083992,704numeric_revision-379nga2018.pdfstates-gross.xlsData 1Q86
2018Federal offshore Gulfvented_flared13,83913,932numeric_revision93nga2018.pdfstates-vented-flared.xlsData 1L86
2018Idahogross_withdrawals1,8671,867same_numeric0nga2018.pdfstates-gross.xlsData 2I55
2018Idahovented_flared67numeric_revision1nga2018.pdfstates-vented-flared.xlsData 2H55
2018Illinoisgross_withdrawals2,4182,464numeric_revision46nga2018.pdfstates-gross.xlsData 2J55
2018Illinoisvented_flaredNAavailability_differencenga2018.pdfstates-vented-flared.xlsData 2I55
2018Indianagross_withdrawals5,0545,054same_numeric0nga2018.pdfstates-gross.xlsData 2K55
2018Indianavented_flaredNA0annual_NA_series_zeronga2018.pdfstates-vented-flared.xlsData 2J55
2018Kansasgross_withdrawals201,505201,391numeric_revision-114nga2018.pdfstates-gross.xlsData 1U86
2018Kansasvented_flaredNAavailability_differencenga2018.pdfstates-vented-flared.xlsData 1M86
2018Kentuckygross_withdrawals83,97384,047numeric_revision74nga2018.pdfstates-gross.xlsData 2L55
2018Kentuckyvented_flaredNAavailability_differencenga2018.pdfstates-vented-flared.xlsData 2K55
2018Louisianagross_withdrawals2,818,1242,839,919numeric_revision21,795nga2018.pdfstates-gross.xlsData 1V86
2018Louisianavented_flared5,9395,966numeric_revision27nga2018.pdfstates-vented-flared.xlsData 1N86
2018Marylandgross_withdrawals2413numeric_revision-11nga2018.pdfstates-gross.xlsData 2M55
2018Marylandvented_flared00same_numeric0nga2018.pdfstates-vented-flared.xlsData 2L55
2018Michigangross_withdrawals89,52589,572numeric_revision47nga2018.pdfstates-gross.xlsData 2N55
2018Michiganvented_flaredNAavailability_differencenga2018.pdfstates-vented-flared.xlsData 2M55
2018Mississippigross_withdrawals35,56435,564same_numeric0nga2018.pdfstates-gross.xlsData 2O55
2018Mississippivented_flaredNAavailability_differencenga2018.pdfstates-vented-flared.xlsData 2N55
2018Missourigross_withdrawals*1availability_differencenga2018.pdfstates-gross.xlsData 2P55
2018Missourivented_flared00same_numeric0nga2018.pdfstates-vented-flared.xlsData 2O55
2018Montanagross_withdrawals47,06747,074numeric_revision7nga2018.pdfstates-gross.xlsData 1Z86
2018Montanavented_flared3,5403,540same_numeric0nga2018.pdfstates-vented-flared.xlsData 1Q86
2018Nebraskagross_withdrawals433433same_numeric0nga2018.pdfstates-gross.xlsData 2Q55
2018Nebraskavented_flaredNAavailability_differencenga2018.pdfstates-vented-flared.xlsData 2P55
2018Nevadagross_withdrawals33same_numeric0nga2018.pdfstates-gross.xlsData 2R55
2018Nevadavented_flared00same_numeric0nga2018.pdfstates-vented-flared.xlsData 2Q55
2018New Mexicogross_withdrawals1,527,3191,540,984numeric_revision13,665nga2018.pdfstates-gross.xlsData 1AA86
2018New Mexicovented_flared37,22037,413numeric_revision193nga2018.pdfstates-vented-flared.xlsData 1R86
2018New Yorkgross_withdrawals11,79810,653numeric_revision-1,145nga2018.pdfstates-gross.xlsData 2S55
2018New Yorkvented_flared00same_numeric0nga2018.pdfstates-vented-flared.xlsData 2R55
2018North Dakotagross_withdrawals858,969860,817numeric_revision1,848nga2018.pdfstates-gross.xlsData 1AB86
2018North Dakotavented_flared147,485148,501numeric_revision1,016nga2018.pdfstates-vented-flared.xlsData 1S86
2018Ohiogross_withdrawals2,409,1532,403,382numeric_revision-5,771nga2018.pdfstates-gross.xlsData 1AC86
2018Ohiovented_flaredNA0annual_NA_series_zeronga2018.pdfstates-vented-flared.xlsData 1T86
2018Oklahomagross_withdrawals2,946,1172,875,787numeric_revision-70,330nga2018.pdfstates-gross.xlsData 1AD86
2018Oklahomavented_flaredNA0annual_NA_series_zeronga2018.pdfstates-vented-flared.xlsData 1U86
2018Oregongross_withdrawals499499same_numeric0nga2018.pdfstates-gross.xlsData 2T55
2018Oregonvented_flared00same_numeric0nga2018.pdfstates-vented-flared.xlsData 2S55
2018Pennsylvaniagross_withdrawals6,210,6736,264,832numeric_revision54,159nga2018.pdfstates-gross.xlsData 1AE86
2018Pennsylvaniavented_flaredNA0annual_NA_series_zeronga2018.pdfstates-vented-flared.xlsData 1V86
2018South Dakotagross_withdrawals442447numeric_revision5nga2018.pdfstates-gross.xlsData 2U55
2018South Dakotavented_flared00same_numeric0nga2018.pdfstates-vented-flared.xlsData 2T55
2018Tennesseegross_withdrawals3,5383,283numeric_revision-255nga2018.pdfstates-gross.xlsData 2V55
2018Tennesseevented_flaredNA0annual_NA_series_zeronga2018.pdfstates-vented-flared.xlsData 2U55
2018Texasgross_withdrawals8,915,2669,109,174numeric_revision193,908nga2018.pdfstates-gross.xlsData 1AF86
2018Texasvented_flared238,054238,054same_numeric0nga2018.pdfstates-vented-flared.xlsData 1W86
2018Utahgross_withdrawals296,810295,826numeric_revision-984nga2018.pdfstates-gross.xlsData 1AJ86
2018Utahvented_flaredNAavailability_differencenga2018.pdfstates-vented-flared.xlsData 1Z86
2018Virginiagross_withdrawals111,476111,476same_numeric0nga2018.pdfstates-gross.xlsData 2W55
2018Virginiavented_flaredNAavailability_differencenga2018.pdfstates-vented-flared.xlsData 2V55
2018West Virginiagross_withdrawals1,799,0971,771,698numeric_revision-27,399nga2018.pdfstates-gross.xlsData 1AK86
2018West Virginiavented_flaredNAavailability_differencenga2018.pdfstates-vented-flared.xlsData 1AA86
2018Wyominggross_withdrawals1,720,8971,720,897same_numeric0nga2018.pdfstates-gross.xlsData 1AL86
2018Wyomingvented_flared8,9588,958same_numeric0nga2018.pdfstates-vented-flared.xlsData 1AB86
2019United Statesgross_withdrawals40,892,45840,780,210numeric_revision-112,248nga2019.pdfstates-gross.xlsData 1B87
2019United Statesvented_flared538,479539,480numeric_revision1,001nga2019.pdfstates-vented-flared.xlsData 1B87
2019Alabamagross_withdrawals130,065130,069numeric_revision4nga2019.pdfstates-gross.xlsData 2C56
2019Alabamavented_flaredNA0annual_NA_series_zeronga2019.pdfstates-vented-flared.xlsData 2C56
2019Alaskagross_withdrawals3,250,3533,250,353same_numeric0nga2019.pdfstates-gross.xlsData 1F87
2019Alaskavented_flared7,2487,248same_numeric0nga2019.pdfstates-vented-flared.xlsData 1C87
2019Arizonagross_withdrawals6666same_numeric0nga2019.pdfstates-gross.xlsData 2G56
2019Arizonavented_flared00same_numeric0nga2019.pdfstates-vented-flared.xlsData 2F56
2019Arkansasgross_withdrawals524,705524,757numeric_revision52nga2019.pdfstates-gross.xlsData 1J87
2019Arkansasvented_flaredNA0annual_NA_series_zeronga2019.pdfstates-vented-flared.xlsData 1F87
2019Californiagross_withdrawals196,823196,823same_numeric0nga2019.pdfstates-gross.xlsData 1K87
2019Californiavented_flared00same_numeric0nga2019.pdfstates-vented-flared.xlsData 1G87
2019Coloradogross_withdrawals1,993,8281,991,195numeric_revision-2,633nga2019.pdfstates-gross.xlsData 1P87
2019Coloradovented_flared5,1144,279numeric_revision-835nga2019.pdfstates-vented-flared.xlsData 1K87
2019Floridagross_withdrawals5,2235,453numeric_revision230nga2019.pdfstates-gross.xlsData 2H56
2019Floridavented_flaredNA0annual_NA_series_zeronga2019.pdfstates-vented-flared.xlsData 2G56
2019Federal offshore Gulfgross_withdrawals1,033,9221,034,038numeric_revision116nga2019.pdfstates-gross.xlsData 1Q87
2019Federal offshore Gulfvented_flared14,46114,399numeric_revision-62nga2019.pdfstates-vented-flared.xlsData 1L87
2019Idahogross_withdrawals1,0331,033same_numeric0nga2019.pdfstates-gross.xlsData 2I56
2019Idahovented_flared00same_numeric0nga2019.pdfstates-vented-flared.xlsData 2H56
2019Illinoisgross_withdrawals2,2102,150numeric_revision-60nga2019.pdfstates-gross.xlsData 2J56
2019Illinoisvented_flaredNA0annual_NA_series_zeronga2019.pdfstates-vented-flared.xlsData 2I56
2019Indianagross_withdrawals5,0445,044same_numeric0nga2019.pdfstates-gross.xlsData 2K56
2019Indianavented_flaredNA0annual_NA_series_zeronga2019.pdfstates-vented-flared.xlsData 2J56
2019Kansasgross_withdrawals183,097183,087numeric_revision-10nga2019.pdfstates-gross.xlsData 1U87
2019Kansasvented_flaredNA0annual_NA_series_zeronga2019.pdfstates-vented-flared.xlsData 1M87
2019Kentuckygross_withdrawals77,88277,882same_numeric0nga2019.pdfstates-gross.xlsData 2L56
2019Kentuckyvented_flaredNA0annual_NA_series_zeronga2019.pdfstates-vented-flared.xlsData 2K56
2019Louisianagross_withdrawals3,230,2723,218,949numeric_revision-11,323nga2019.pdfstates-gross.xlsData 1V87
2019Louisianavented_flared5,1005,101numeric_revision1nga2019.pdfstates-vented-flared.xlsData 1N87
2019Marylandgross_withdrawals1013numeric_revision3nga2019.pdfstates-gross.xlsData 2M56
2019Marylandvented_flared00same_numeric0nga2019.pdfstates-vented-flared.xlsData 2L56
2019Michigangross_withdrawals83,73383,969numeric_revision236nga2019.pdfstates-gross.xlsData 2N56
2019Michiganvented_flaredNA0annual_NA_series_zeronga2019.pdfstates-vented-flared.xlsData 2M56
2019Mississippigross_withdrawals33,30733,307same_numeric0nga2019.pdfstates-gross.xlsData 2O56
2019Mississippivented_flaredNA0annual_NA_series_zeronga2019.pdfstates-vented-flared.xlsData 2N56
2019Missourigross_withdrawals11same_numeric0nga2019.pdfstates-gross.xlsData 2P56
2019Missourivented_flared00same_numeric0nga2019.pdfstates-vented-flared.xlsData 2O56
2019Montanagross_withdrawals48,35548,616numeric_revision261nga2019.pdfstates-gross.xlsData 1Z87
2019Montanavented_flared5,0885,078numeric_revision-10nga2019.pdfstates-vented-flared.xlsData 1Q87
2019Nebraskagross_withdrawals384384same_numeric0nga2019.pdfstates-gross.xlsData 2Q56
2019Nebraskavented_flaredNA0annual_NA_series_zeronga2019.pdfstates-vented-flared.xlsData 2P56
2019Nevadagross_withdrawals25numeric_revision3nga2019.pdfstates-gross.xlsData 2R56
2019Nevadavented_flared00same_numeric0nga2019.pdfstates-vented-flared.xlsData 2Q56
2019New Mexicogross_withdrawals1,852,7191,818,227numeric_revision-34,492nga2019.pdfstates-gross.xlsData 1AA87
2019New Mexicovented_flared36,22837,294numeric_revision1,066nga2019.pdfstates-vented-flared.xlsData 1R87
2019New Yorkgross_withdrawals10,96210,962same_numeric0nga2019.pdfstates-gross.xlsData 2S56
2019New Yorkvented_flared00same_numeric0nga2019.pdfstates-vented-flared.xlsData 2R56
2019North Dakotagross_withdrawals1,061,9051,061,091numeric_revision-814nga2019.pdfstates-gross.xlsData 1AB87
2019North Dakotavented_flared205,168205,278numeric_revision110nga2019.pdfstates-vented-flared.xlsData 1S87
2019Ohiogross_withdrawals2,654,1862,651,631numeric_revision-2,555nga2019.pdfstates-gross.xlsData 1AC87
2019Ohiovented_flaredNA0annual_NA_series_zeronga2019.pdfstates-vented-flared.xlsData 1T87
2019Oklahomagross_withdrawals3,175,0083,036,052numeric_revision-138,956nga2019.pdfstates-gross.xlsData 1AD87
2019Oklahomavented_flaredNA0annual_NA_series_zeronga2019.pdfstates-vented-flared.xlsData 1U87
2019Oregongross_withdrawals399399same_numeric0nga2019.pdfstates-gross.xlsData 2T56
2019Oregonvented_flared00same_numeric0nga2019.pdfstates-vented-flared.xlsData 2S56
2019Pennsylvaniagross_withdrawals6,896,7926,896,792same_numeric0nga2019.pdfstates-gross.xlsData 1AE87
2019Pennsylvaniavented_flaredNA0annual_NA_series_zeronga2019.pdfstates-vented-flared.xlsData 1V87
2019South Dakotagross_withdrawals414414same_numeric0nga2019.pdfstates-gross.xlsData 2U56
2019South Dakotavented_flared00same_numeric0nga2019.pdfstates-vented-flared.xlsData 2T56
2019Tennesseegross_withdrawals2,8103,107numeric_revision297nga2019.pdfstates-gross.xlsData 2V56
2019Tennesseevented_flaredNA0annual_NA_series_zeronga2019.pdfstates-vented-flared.xlsData 2U56
2019Texasgross_withdrawals10,355,45310,432,505numeric_revision77,052nga2019.pdfstates-gross.xlsData 1AF87
2019Texasvented_flared251,186251,186same_numeric0nga2019.pdfstates-vented-flared.xlsData 1W87
2019Utahgross_withdrawals271,870272,752numeric_revision882nga2019.pdfstates-gross.xlsData 1AJ87
2019Utahvented_flaredNA944availability_differencenga2019.pdfstates-vented-flared.xlsData 1Z87
2019Virginiagross_withdrawals106,366106,366same_numeric0nga2019.pdfstates-gross.xlsData 2W56
2019Virginiavented_flaredNA0annual_NA_series_zeronga2019.pdfstates-vented-flared.xlsData 2V56
2019West Virginiagross_withdrawals2,155,7572,155,214numeric_revision-543nga2019.pdfstates-gross.xlsData 1AK87
2019West Virginiavented_flaredNA0annual_NA_series_zeronga2019.pdfstates-vented-flared.xlsData 1AA87
2019Wyominggross_withdrawals1,547,5041,547,504same_numeric0nga2019.pdfstates-gross.xlsData 1AL87
2019Wyomingvented_flared8,8868,672numeric_revision-214nga2019.pdfstates-vented-flared.xlsData 1AB87
2020United Statesgross_withdrawals40,729,92740,729,927same_numeric0table-003.pdfstates-gross.xlsData 1B88
2020United Statesvented_flared339,272339,272same_numeric0table-003.pdfstates-vented-flared.xlsData 1B88
2021United Statesgross_withdrawals41,676,74341,676,743same_numeric0table-003.pdfstates-gross.xlsData 1B89
2021United Statesvented_flared287,775287,775same_numeric0table-003.pdfstates-vented-flared.xlsData 1B89
2022United Statesgross_withdrawals43,700,92843,700,928same_numeric0table-003.pdfstates-gross.xlsData 1B90
2022United Statesvented_flared271,682271,682same_numeric0table-003.pdfstates-vented-flared.xlsData 1B90
2023United Statesgross_withdrawals45,399,67045,399,670same_numeric0table-003.pdfstates-gross.xlsData 1B91
2023United Statesvented_flared324,207324,207same_numeric0table-003.pdfstates-vented-flared.xlsData 1B91
2024United Statesgross_withdrawals45,867,76145,867,761same_numeric0table-003.pdfstates-gross.xlsData 1B92
2024United Statesvented_flared335,163335,163same_numeric0table-003.pdfstates-vented-flared.xlsData 1B92

Download the same complete table (CSV)

State concentration in the published U.S. total, all 30 rows

Top reporting states divided by EIA published national combined disposal total. Does not estimate unavailable state quantities.

Period: 2020 through 2024, fixed 2024 Annual edition. Units: Million cubic feet (MMcf) unless explicitly percentage, percentage points, rank or row count. Bcf conversions in article and graphics divide MMcf by 1,000..

Original sources: EIA Natural Gas Annual 2024, source edition November 2025, reissued February 2026

State concentration in the published U.S. total; 2020 through 2024, fixed 2024 Annual edition; Million cubic feet (MMcf) unless explicitly percentage, percentage points, rank or row count. Bcf conversions in article and graphics divide MMcf by 1,000.
yeartop state countstatescombined vented flared mmcfreported us vented flared mmcfshare reported us pct
20201Texas125,336339,27236.9426
20202Texas; North Dakota224,868339,27266.2796
20203Texas; North Dakota; Wyoming285,283339,27284.0868
20204Texas; North Dakota; Wyoming; New Mexico307,818339,27290.7290
20205Texas; North Dakota; Wyoming; New Mexico; Alaska313,525339,27292.4111
202010Texas; North Dakota; Wyoming; New Mexico; Alaska; Louisiana; Montana; Colorado; California; Utah327,080339,27296.4064
20211Texas102,267287,77535.5371
20212Texas; North Dakota178,726287,77562.1062
20213Texas; North Dakota; Wyoming244,468287,77584.9511
20214Texas; North Dakota; Wyoming; New Mexico261,745287,77590.9547
20215Texas; North Dakota; Wyoming; New Mexico; Alaska267,714287,77593.0289
202110Texas; North Dakota; Wyoming; New Mexico; Alaska; Louisiana; Montana; Colorado; California; Utah278,027287,77596.6126
20221Texas99,698271,68236.6966
20222Texas; North Dakota163,696271,68260.2528
20223Texas; North Dakota; Wyoming222,371271,68281.8497
20224Texas; North Dakota; Wyoming; New Mexico243,244271,68289.5326
20225Texas; North Dakota; Wyoming; New Mexico; Alaska250,357271,68292.1508
202210Texas; North Dakota; Wyoming; New Mexico; Alaska; Louisiana; Montana; California; Utah; Colorado260,315271,68295.8161
20231Texas156,021324,20748.1239
20232Texas; North Dakota218,197324,20767.3018
20233Texas; North Dakota; Wyoming274,158324,20784.5626
20234Texas; North Dakota; Wyoming; New Mexico299,022324,20792.2318
20235Texas; North Dakota; Wyoming; New Mexico; Alaska306,056324,20794.4014
202310Texas; North Dakota; Wyoming; New Mexico; Alaska; Montana; Louisiana; Utah; California; Colorado314,716324,20797.0725
20241Texas163,512335,16348.7858
20242Texas; North Dakota231,217335,16368.9864
20243Texas; North Dakota; Wyoming291,158335,16386.8706
20244Texas; North Dakota; Wyoming; New Mexico308,184335,16391.9505
20245Texas; North Dakota; Wyoming; New Mexico; Alaska314,495335,16393.8334
202410Texas; North Dakota; Wyoming; New Mexico; Alaska; Montana; Utah; Louisiana; California; Colorado325,350335,16397.0722

Download the same complete table (CSV)

Separate historical Annual snapshots, all 282 rows

Each year is its own archived Annual Table 3 edition. Do not join as a current revised time series or calculate a continuous cross vintage trend.

Period: 2012 through 2019, separate original publication vintages. Units: Million cubic feet (MMcf) unless explicitly percentage, percentage points, rank or row count. Bcf conversions in article and graphics divide MMcf by 1,000..

Original sources: EIA 2012 Annual archive, Table 3 · EIA 2013 Annual archive, Table 3 · EIA 2014 Annual archive, Table 3 · EIA 2015 Annual archive, Table 3 · EIA 2016 Annual archive, Table 3 · EIA 2017 Annual archive, Table 3 · EIA 2018 Annual archive, Table 3 · EIA 2019 Annual archive, Table 3

Separate historical Annual snapshots; 2012 through 2019, separate original publication vintages; Million cubic feet (MMcf) unless explicitly percentage, percentage points, rank or row count. Bcf conversions in article and graphics divide MMcf by 1,000.
yearareageography typegross withdrawals mmcfvented flared mmcfvented flared statusvented flared source markervented flared pct grossgross source markersource filesource tablevintage
2012Alabamastate215,710not_availableNA215,710nga2012.pdf32012 Annual
2012Alaskastate3,164,79111,769reported_positive11,7690.37193,164,791nga2012.pdf32012 Annual
2012Arizonastate1170reported_zero00117nga2012.pdf32012 Annual
2012Arkansasstate1,146,168not_availableNA1,146,168nga2012.pdf32012 Annual
2012Californiastate246,822not_availableNA246,822nga2012.pdf32012 Annual
2012Coloradostate1,709,376not_availableNA1,709,376nga2012.pdf32012 Annual
2012Federal offshore Gulfoffshore_region1,527,87516,296reported_positive16,2961.06661,527,875nga2012.pdf32012 Annual
2012Floridastate18,6810reported_zero0018,681nga2012.pdf32012 Annual
2012Illinoisstate2,1250reported_zero002,125nga2012.pdf32012 Annual
2012Indianastate8,814not_availableNA8,814nga2012.pdf32012 Annual
2012Kansasstate296,299not_availableNA296,299nga2012.pdf32012 Annual
2012Kentuckystate106,1220reported_zero00106,122nga2012.pdf32012 Annual
2012Louisianastate2,955,437not_availableNA2,955,437nga2012.pdf32012 Annual
2012Marylandstate440reported_zero0044nga2012.pdf32012 Annual
2012Michiganstate129,333not_availableNA129,333nga2012.pdf32012 Annual
2012Mississippistate452,915not_availableNA452,915nga2012.pdf32012 Annual
2012Montanastate66,954not_availableNA66,954nga2012.pdf32012 Annual
2012Nebraskastate1,328not_availableNA1,328nga2012.pdf32012 Annual
2012Nevadastate40reported_zero004nga2012.pdf32012 Annual
2012New Mexicostate1,276,29612,259reported_positive12,2590.96051,276,296nga2012.pdf32012 Annual
2012New Yorkstate26,4240reported_zero0026,424nga2012.pdf32012 Annual
2012North Dakotastate258,56879,564reported_positive79,56430.7710258,568nga2012.pdf32012 Annual
2012Ohiostate84,482not_availableNA84,482nga2012.pdf32012 Annual
2012Oklahomastate2,023,461not_availableNA2,023,461nga2012.pdf32012 Annual
2012Oregonstate7700reported_zero00770nga2012.pdf32012 Annual
2012Pennsylvaniastate2,256,696not_availableNA2,256,696nga2012.pdf32012 Annual
2012South Dakotastate15,085not_availableNA15,085nga2012.pdf32012 Annual
2012Tennesseestate5,825not_availableNA5,825nga2012.pdf32012 Annual
2012Texasstate8,143,51047,530reported_positive47,5300.58378,143,510nga2012.pdf32012 Annual
2012United Statesnational29,542,313212,848reported_positive212,8480.720529,542,313nga2012.pdf32012 Annual
2012Utahstate490,393not_availableNA490,393nga2012.pdf32012 Annual
2012Virginiastate146,405not_availableNA146,405nga2012.pdf32012 Annual
2012West Virginiastate539,8600reported_zero00539,860nga2012.pdf32012 Annual
2012Wyomingstate2,225,62245,429reported_positive45,4292.04122,225,622nga2012.pdf32012 Annual
2013Alabamastate196,326not_availableNA196,326nga2013.pdf32013 Annual
2013Alaskastate3,215,3587,219reported_positive7,2190.22453,215,358nga2013.pdf32013 Annual
2013Arizonastate720reported_zero0072nga2013.pdf32013 Annual
2013Arkansasstate1,139,654not_availableNA1,139,654nga2013.pdf32013 Annual
2013Californiastate252,310not_availableNA252,310nga2013.pdf32013 Annual
2013Coloradostate1,604,860not_availableNA1,604,860nga2013.pdf32013 Annual
2013Federal offshore Gulfoffshore_region1,326,69714,619reported_positive14,6191.10191,326,697nga2013.pdf32013 Annual
2013Floridastate18,0110reported_zero0018,011nga2013.pdf32013 Annual
2013Illinoisstate2,8870reported_zero002,887nga2013.pdf32013 Annual
2013Indianastate7,938not_availableNA7,938nga2013.pdf32013 Annual
2013Kansasstate292,467not_availableNA292,467nga2013.pdf32013 Annual
2013Kentuckystate94,6650reported_zero0094,665nga2013.pdf32013 Annual
2013Louisianastate2,413,5753,912reported_positive3,9120.16212,413,575nga2013.pdf32013 Annual
2013Marylandstate320reported_zero0032nga2013.pdf32013 Annual
2013Michiganstate123,622not_availableNA123,622nga2013.pdf32013 Annual
2013Mississippistate413,329not_availableNA413,329nga2013.pdf32013 Annual
2013Montanastate63,242not_availableNA63,242nga2013.pdf32013 Annual
2013Nebraskastate1,032not_availableNA1,032nga2013.pdf32013 Annual
2013Nevadastate30reported_zero003nga2013.pdf32013 Annual
2013New Mexicostate1,271,18521,053reported_positive21,0531.65621,271,185nga2013.pdf32013 Annual
2013New Yorkstate23,4580reported_zero0023,458nga2013.pdf32013 Annual
2013North Dakotastate345,787102,855reported_positive102,85529.7452345,787nga2013.pdf32013 Annual
2013Ohiostate186,181not_availableNA186,181nga2013.pdf32013 Annual
2013Oklahomastate2,143,999not_availableNA2,143,999nga2013.pdf32013 Annual
2013Oregonstate7700reported_zero00770nga2013.pdf32013 Annual
2013Pennsylvaniastate3,259,042not_availableNA3,259,042nga2013.pdf32013 Annual
2013South Dakotastate16,205not_availableNA16,205nga2013.pdf32013 Annual
2013Tennesseestate5,400not_availableNA5,400nga2013.pdf32013 Annual
2013Texasstate8,211,25576,113reported_positive76,1130.92698,211,255nga2013.pdf32013 Annual
2013United Statesnational30,005,254260,394reported_positive260,3940.867830,005,254nga2013.pdf32013 Annual
2013Utahstate470,863not_availableNA470,863nga2013.pdf32013 Annual
2013Virginiastate139,382not_availableNA139,382nga2013.pdf32013 Annual
2013West Virginiastate717,8920reported_zero00717,892nga2013.pdf32013 Annual
2013Wyomingstate2,047,75734,622reported_positive34,6221.69072,047,757nga2013.pdf32013 Annual
2014Alabamastate181,054not_availableNA181,054nga2014.pdf32014 Annual
2014Alaskastate3,168,5666,554reported_positive6,5540.20683,168,566nga2014.pdf32014 Annual
2014Arizonastate1060reported_zero00106nga2014.pdf32014 Annual
2014Arkansasstate1,123,678not_availableNA1,123,678nga2014.pdf32014 Annual
2014Californiastate252,718not_availableNA252,718nga2014.pdf32014 Annual
2014Coloradostate1,631,390not_availableNA1,631,390nga2014.pdf32014 Annual
2014Federal offshore Gulfoffshore_region1,275,21315,123reported_positive15,1231.18591,275,213nga2014.pdf32014 Annual
2014Floridastate21,2590reported_zero0021,259nga2014.pdf32014 Annual
2014Illinoisstate2,6260reported_zero002,626nga2014.pdf32014 Annual
2014Indianastate6,616not_availableNA6,616nga2014.pdf32014 Annual
2014Kansasstate286,080not_availableNA286,080nga2014.pdf32014 Annual
2014Kentuckystate78,7370reported_zero0078,737nga2014.pdf32014 Annual
2014Louisianastate1,987,6304,143reported_positive4,1430.20841,987,630nga2014.pdf32014 Annual
2014Marylandstate200reported_zero0020nga2014.pdf32014 Annual
2014Michiganstate114,946not_availableNA114,946nga2014.pdf32014 Annual
2014Mississippistate54,440not_availableNA54,440nga2014.pdf32014 Annual
2014Missouristate90reported_zero009nga2014.pdf32014 Annual
2014Montanastate59,930not_availableNA59,930nga2014.pdf32014 Annual
2014Nebraskastate402not_availableNA402nga2014.pdf32014 Annual
2014Nevadastate30reported_zero003nga2014.pdf32014 Annual
2014New Mexicostate1,265,57922,143reported_positive22,1431.74961,265,579nga2014.pdf32014 Annual
2014New Yorkstate20,2010reported_zero0020,201nga2014.pdf32014 Annual
2014North Dakotastate462,929129,384reported_positive129,38427.9490462,929nga2014.pdf32014 Annual
2014Ohiostate518,767not_availableNA518,767nga2014.pdf32014 Annual
2014Oklahomastate2,310,114not_availableNA2,310,114nga2014.pdf32014 Annual
2014Oregonstate9500reported_zero00950nga2014.pdf32014 Annual
2014Pennsylvaniastate4,214,643not_availableNA4,214,643nga2014.pdf32014 Annual
2014South Dakotastate15,307not_availableNA15,307nga2014.pdf32014 Annual
2014Tennesseestate5,294not_availableNA5,294nga2014.pdf32014 Annual
2014Texasstate8,663,33381,755reported_positive81,7550.94378,663,333nga2014.pdf32014 Annual
2014United Statesnational31,345,546288,743reported_positive288,7430.921231,345,546nga2014.pdf32014 Annual
2014Utahstate453,207not_availableNA453,207nga2014.pdf32014 Annual
2014Virginiastate131,885not_availableNA131,885nga2014.pdf32014 Annual
2014West Virginiastate1,040,2500reported_zero001,040,250nga2014.pdf32014 Annual
2014Wyomingstate1,997,66629,641reported_positive29,6411.48381,997,666nga2014.pdf32014 Annual
2015Alabamastate168,249not_availableNA168,249nga2015.pdf32015 Annual
2015Alaskastate3,175,3015,477reported_positive5,4770.17253,175,301nga2015.pdf32015 Annual
2015Arizonastate950reported_zero0095nga2015.pdf32015 Annual
2015Arkansasstate1,010,274not_availableNA1,010,274nga2015.pdf32015 Annual
2015Californiastate231,060not_availableNA231,060nga2015.pdf32015 Annual
2015Coloradostate1,704,836not_availableNA1,704,836nga2015.pdf32015 Annual
2015Federal offshore Gulfoffshore_region1,309,38016,290reported_positive16,2901.24411,309,380nga2015.pdf32015 Annual
2015Floridastate5,790not_availableNA5,790nga2015.pdf32015 Annual
2015Illinoisstate2,080not_availableNA2,080nga2015.pdf32015 Annual
2015Indianastate7,250not_availableNA7,250nga2015.pdf32015 Annual
2015Kansasstate285,236not_availableNA285,236nga2015.pdf32015 Annual
2015Kentuckystate85,775not_availableNA85,775nga2015.pdf32015 Annual
2015Louisianastate1,784,7973,748reported_positive3,7480.21001,784,797nga2015.pdf32015 Annual
2015Marylandstate270reported_zero0027nga2015.pdf32015 Annual
2015Michiganstate107,634not_availableNA107,634nga2015.pdf32015 Annual
2015Mississippistate58,207not_availableNA58,207nga2015.pdf32015 Annual
2015Missouristate10reported_zero001nga2015.pdf32015 Annual
2015Montanastate57,421not_availableNA57,421nga2015.pdf32015 Annual
2015Nebraskastate477not_availableNA477nga2015.pdf32015 Annual
2015Nevadastate30reported_zero003nga2015.pdf32015 Annual
2015New Mexicostate1,296,45824,850reported_positive24,8501.91681,296,458nga2015.pdf32015 Annual
2015New Yorkstate17,8290reported_zero0017,829nga2015.pdf32015 Annual
2015North Dakotastate584,743106,590reported_positive106,59018.2285584,743nga2015.pdf32015 Annual
2015Ohiostate1,014,848not_availableNA1,014,848nga2015.pdf32015 Annual
2015Oklahomastate2,499,599not_availableNA2,499,599nga2015.pdf32015 Annual
2015Oregonstate8480reported_zero00848nga2015.pdf32015 Annual
2015Pennsylvaniastate4,812,983not_availableNA4,812,983nga2015.pdf32015 Annual
2015South Dakotastate14,531not_availableNA14,531nga2015.pdf32015 Annual
2015Tennesseestate4,276not_availableNA4,276nga2015.pdf32015 Annual
2015Texasstate8,801,282113,786reported_positive113,7861.29288,801,282nga2015.pdf32015 Annual
2015United Statesnational32,894,727278,623reported_positive278,6230.847032,894,727nga2015.pdf32015 Annual
2015Utahstate423,300not_availableNA423,300nga2015.pdf32015 Annual
2015Virginiastate127,584not_availableNA127,584nga2015.pdf32015 Annual
2015West Virginiastate1,318,822not_availableNA1,318,822nga2015.pdf32015 Annual
2015Wyomingstate1,983,7317,883reported_positive7,8830.39741,983,731nga2015.pdf32015 Annual
2016Alabamastate164,804not_availableNA164,804nga2016.pdf32016 Annual
2016Alaskastate3,229,9688,541reported_positive8,5410.26443,229,968nga2016.pdf32016 Annual
2016Arizonastate470reported_zero0047nga2016.pdf32016 Annual
2016Arkansasstate823,223not_availableNA823,223nga2016.pdf32016 Annual
2016Californiastate205,024not_availableNA205,024nga2016.pdf32016 Annual
2016Coloradostate1,701,735not_availableNA1,701,735nga2016.pdf32016 Annual
2016Federal offshore Gulfoffshore_region1,220,0229,706reported_positive9,7060.79561,220,022nga2016.pdf32016 Annual
2016Floridastate3,431not_availableNA3,431nga2016.pdf32016 Annual
2016Idahostate4,6370reported_zero004,637nga2016.pdf32016 Annual
2016Illinoisstate2,183not_availableNA2,183nga2016.pdf32016 Annual
2016Indianastate6,205not_availableNA6,205nga2016.pdf32016 Annual
2016Kansasstate243,459not_availableNA243,459nga2016.pdf32016 Annual
2016Kentuckystate91,609not_availableNA91,609nga2016.pdf32016 Annual
2016Louisianastate1,752,2695,106reported_positive5,1060.29141,752,269nga2016.pdf32016 Annual
2016Marylandstate340reported_zero0034nga2016.pdf32016 Annual
2016Michiganstate100,599not_availableNA100,599nga2016.pdf32016 Annual
2016Mississippistate48,506not_availableNA48,506nga2016.pdf32016 Annual
2016Missouristate10reported_zero001nga2016.pdf32016 Annual
2016Montanastate52,1254,318reported_positive4,3188.283952,125nga2016.pdf32016 Annual
2016Nebraskastate531not_availableNA531nga2016.pdf32016 Annual
2016Nevadastate30reported_zero003nga2016.pdf32016 Annual
2016New Mexicostate1,284,6986,162reported_positive6,1620.47961,284,698nga2016.pdf32016 Annual
2016New Yorkstate13,4460reported_zero0013,446nga2016.pdf32016 Annual
2016North Dakotastate608,83270,136reported_positive70,13611.5198608,832nga2016.pdf32016 Annual
2016Ohiostate1,439,905not_availableNA1,439,905nga2016.pdf32016 Annual
2016Oklahomastate2,468,312not_availableNA2,468,312nga2016.pdf32016 Annual
2016Oregonstate9370reported_zero00937nga2016.pdf32016 Annual
2016Pennsylvaniastate5,313,258not_availableNA5,313,258nga2016.pdf32016 Annual
2016South Dakotastate10,1099,620reported_positive9,62095.162710,109nga2016.pdf32016 Annual
2016Tennesseestate3,603not_availableNA3,603nga2016.pdf32016 Annual
2016Texasstate8,133,83787,527reported_positive87,5271.07618,133,837nga2016.pdf32016 Annual
2016United Statesnational32,635,511210,554reported_positive210,5540.645232,635,511nga2016.pdf32016 Annual
2016Utahstate364,665not_availableNA364,665nga2016.pdf32016 Annual
2016Virginiastate120,241not_availableNA120,241nga2016.pdf32016 Annual
2016West Virginiastate1,375,108not_availableNA1,375,108nga2016.pdf32016 Annual
2016Wyomingstate1,848,1459,437reported_positive9,4370.51061,848,145nga2016.pdf32016 Annual
2017Alabamastate150,084not_availableNA150,084nga2017.pdf32017 Annual
2017Alaskastate3,250,7697,605reported_positive7,6050.23393,250,769nga2017.pdf32017 Annual
2017Arizonastate560reported_zero0056nga2017.pdf32017 Annual
2017Arkansasstate707,292not_availableNA707,292nga2017.pdf32017 Annual
2017Californiastate209,327not_availableNA209,327nga2017.pdf32017 Annual
2017Coloradostate1,687,6674,279reported_positive4,2790.25351,687,667nga2017.pdf32017 Annual
2017Federal offshore Gulfoffshore_region1,078,13013,764reported_positive13,7641.27671,078,130nga2017.pdf32017 Annual
2017Floridastate14,871not_availableNA14,871nga2017.pdf32017 Annual
2017Idahostate3,7910reported_zero003,791nga2017.pdf32017 Annual
2017Illinoisstate2,131not_availableNA2,131nga2017.pdf32017 Annual
2017Indianastate5,914not_availableNA5,914nga2017.pdf32017 Annual
2017Kansasstate214,480not_availableNA214,480nga2017.pdf32017 Annual
2017Kentuckystate88,715not_availableNA88,715nga2017.pdf32017 Annual
2017Louisianastate2,147,6125,178reported_positive5,1780.24112,147,612nga2017.pdf32017 Annual
2017Marylandstate320reported_zero0032nga2017.pdf32017 Annual
2017Michiganstate97,000not_availableNA97,000nga2017.pdf32017 Annual
2017Mississippistate38,435not_availableNA38,435nga2017.pdf32017 Annual
2017Missouristate10reported_zero001nga2017.pdf32017 Annual
2017Montanastate49,2183,123reported_positive3,1236.345249,218nga2017.pdf32017 Annual
2017Nebraskastate455not_availableNA455nga2017.pdf32017 Annual
2017Nevadastate30reported_zero003nga2017.pdf32017 Annual
2017New Mexicostate1,324,9092,984reported_positive2,9840.22521,324,909nga2017.pdf32017 Annual
2017New Yorkstate11,3950reported_zero0011,395nga2017.pdf32017 Annual
2017North Dakotastate688,60588,504reported_positive88,50412.8527688,605nga2017.pdf32017 Annual
2017Ohiostate1,772,932not_availableNA1,772,932nga2017.pdf32017 Annual
2017Oklahomastate2,513,897not_availableNA2,513,897nga2017.pdf32017 Annual
2017Oregonstate6590reported_zero00659nga2017.pdf32017 Annual
2017Pennsylvaniastate5,463,888not_availableNA5,463,888nga2017.pdf32017 Annual
2017South Dakotastate4760reported_zero00476nga2017.pdf32017 Annual
2017Tennesseestate2,982not_availableNA2,982nga2017.pdf32017 Annual
2017Texasstate7,995,736101,001reported_positive101,0011.26327,995,736nga2017.pdf32017 Annual
2017United Statesnational33,357,375235,570reported_positive235,5700.706233,357,375nga2017.pdf32017 Annual
2017Utahstate314,733not_availableNA314,733nga2017.pdf32017 Annual
2017Virginiastate115,452not_availableNA115,452nga2017.pdf32017 Annual
2017West Virginiastate1,601,047not_availableNA1,601,047nga2017.pdf32017 Annual
2017Wyomingstate1,804,6819,132reported_positive9,1320.50601,804,681nga2017.pdf32017 Annual
2018Alabamastate139,485not_availableNA139,485nga2018.pdf32018 Annual
2018Alaskastate3,254,7128,210reported_positive8,2100.25223,254,712nga2018.pdf32018 Annual
2018Arizonastate460reported_zero0046nga2018.pdf32018 Annual
2018Arkansasstate589,973not_availableNA589,973nga2018.pdf32018 Annual
2018Californiastate202,6160reported_zero00202,616nga2018.pdf32018 Annual
2018Coloradostate1,836,4225,097reported_positive5,0970.27761,836,422nga2018.pdf32018 Annual
2018Federal offshore Gulfoffshore_region993,08313,839reported_positive13,8391.3935993,083nga2018.pdf32018 Annual
2018Floridastate15,424not_availableNA15,424nga2018.pdf32018 Annual
2018Idahostate1,8676reported_positive60.32141,867nga2018.pdf32018 Annual
2018Illinoisstate2,418not_availableNA2,418nga2018.pdf32018 Annual
2018Indianastate5,054not_availableNA5,054nga2018.pdf32018 Annual
2018Kansasstate201,505not_availableNA201,505nga2018.pdf32018 Annual
2018Kentuckystate83,973not_availableNA83,973nga2018.pdf32018 Annual
2018Louisianastate2,818,1245,939reported_positive5,9390.21072,818,124nga2018.pdf32018 Annual
2018Marylandstate240reported_zero0024nga2018.pdf32018 Annual
2018Michiganstate89,525not_availableNA89,525nga2018.pdf32018 Annual
2018Mississippistate35,564not_availableNA35,564nga2018.pdf32018 Annual
2018Missouristate0reported_zero0*nga2018.pdf32018 Annual
2018Montanastate47,0673,540reported_positive3,5407.521247,067nga2018.pdf32018 Annual
2018Nebraskastate433not_availableNA433nga2018.pdf32018 Annual
2018Nevadastate30reported_zero003nga2018.pdf32018 Annual
2018New Mexicostate1,527,31937,220reported_positive37,2202.43701,527,319nga2018.pdf32018 Annual
2018New Yorkstate11,7980reported_zero0011,798nga2018.pdf32018 Annual
2018North Dakotastate858,969147,485reported_positive147,48517.1700858,969nga2018.pdf32018 Annual
2018Ohiostate2,409,153not_availableNA2,409,153nga2018.pdf32018 Annual
2018Oklahomastate2,946,117not_availableNA2,946,117nga2018.pdf32018 Annual
2018Oregonstate4990reported_zero00499nga2018.pdf32018 Annual
2018Pennsylvaniastate6,210,673not_availableNA6,210,673nga2018.pdf32018 Annual
2018South Dakotastate4420reported_zero00442nga2018.pdf32018 Annual
2018Tennesseestate3,538not_availableNA3,538nga2018.pdf32018 Annual
2018Texasstate8,915,266238,054reported_positive238,0542.67028,915,266nga2018.pdf32018 Annual
2018United Statesnational37,129,374468,347reported_positive468,3471.261437,129,374nga2018.pdf32018 Annual
2018Utahstate296,810not_availableNA296,810nga2018.pdf32018 Annual
2018Virginiastate111,476not_availableNA111,476nga2018.pdf32018 Annual
2018West Virginiastate1,799,097not_availableNA1,799,097nga2018.pdf32018 Annual
2018Wyomingstate1,720,8978,958reported_positive8,9580.52051,720,897nga2018.pdf32018 Annual
2019Alabamastate130,065not_availableNA130,065nga2019.pdf32019 Annual
2019Alaskastate3,250,3537,248reported_positive7,2480.22303,250,353nga2019.pdf32019 Annual
2019Arizonastate660reported_zero0066nga2019.pdf32019 Annual
2019Arkansasstate524,705not_availableNA524,705nga2019.pdf32019 Annual
2019Californiastate196,8230reported_zero00196,823nga2019.pdf32019 Annual
2019Coloradostate1,993,8285,114reported_positive5,1140.25651,993,828nga2019.pdf32019 Annual
2019Federal offshore Gulfoffshore_region1,033,92214,461reported_positive14,4611.39871,033,922nga2019.pdf32019 Annual
2019Floridastate5,223not_availableNA5,223nga2019.pdf32019 Annual
2019Idahostate1,0330reported_zero001,033nga2019.pdf32019 Annual
2019Illinoisstate2,210not_availableNA2,210nga2019.pdf32019 Annual
2019Indianastate5,044not_availableNA5,044nga2019.pdf32019 Annual
2019Kansasstate183,097not_availableNA183,097nga2019.pdf32019 Annual
2019Kentuckystate77,882not_availableNA77,882nga2019.pdf32019 Annual
2019Louisianastate3,230,2725,100reported_positive5,1000.15793,230,272nga2019.pdf32019 Annual
2019Marylandstate100reported_zero0010nga2019.pdf32019 Annual
2019Michiganstate83,733not_availableNA83,733nga2019.pdf32019 Annual
2019Mississippistate33,307not_availableNA33,307nga2019.pdf32019 Annual
2019Missouristate10reported_zero001nga2019.pdf32019 Annual
2019Montanastate48,3555,088reported_positive5,08810.522248,355nga2019.pdf32019 Annual
2019Nebraskastate384not_availableNA384nga2019.pdf32019 Annual
2019Nevadastate20reported_zero002nga2019.pdf32019 Annual
2019New Mexicostate1,852,71936,228reported_positive36,2281.95541,852,719nga2019.pdf32019 Annual
2019New Yorkstate10,9620reported_zero0010,962nga2019.pdf32019 Annual
2019North Dakotastate1,061,905205,168reported_positive205,16819.32071,061,905nga2019.pdf32019 Annual
2019Ohiostate2,654,186not_availableNA2,654,186nga2019.pdf32019 Annual
2019Oklahomastate3,175,008not_availableNA3,175,008nga2019.pdf32019 Annual
2019Oregonstate3990reported_zero00399nga2019.pdf32019 Annual
2019Pennsylvaniastate6,896,792not_availableNA6,896,792nga2019.pdf32019 Annual
2019South Dakotastate4140reported_zero00414nga2019.pdf32019 Annual
2019Tennesseestate2,810not_availableNA2,810nga2019.pdf32019 Annual
2019Texasstate10,355,453251,186reported_positive251,1862.425610,355,453nga2019.pdf32019 Annual
2019United Statesnational40,892,458538,479reported_positive538,4791.316840,892,458nga2019.pdf32019 Annual
2019Utahstate271,870not_availableNA271,870nga2019.pdf32019 Annual
2019Virginiastate106,366not_availableNA106,366nga2019.pdf32019 Annual
2019West Virginiastate2,155,757not_availableNA2,155,757nga2019.pdf32019 Annual
2019Wyomingstate1,547,5048,886reported_positive8,8860.57421,547,504nga2019.pdf32019 Annual

Download the same complete table (CSV)

Matched edition state and national changes, all 70 rows

Only same geography and fixed 2024 Annual edition observations. Endpoint changes, relative percent changes and percentage point changes are separate. Starting zero quantities have no defined relative percent change.

Period: 2020 through 2024, fixed 2024 Annual edition. Units: Million cubic feet (MMcf) unless explicitly percentage, percentage points, rank or row count. Bcf conversions in article and graphics divide MMcf by 1,000..

Original sources: EIA Natural Gas Annual 2024, source edition November 2025, reissued February 2026

Matched edition state and national changes; 2020 through 2024, fixed 2024 Annual edition; Million cubic feet (MMcf) unless explicitly percentage, percentage points, rank or row count. Bcf conversions in article and graphics divide MMcf by 1,000.
begin yearend yearareageography typebegin vented flared mmcfend vented flared mmcfchange vented flared mmcfchange vented flared pctbegin gross mmcfend gross mmcfchange gross pctbegin vented flared pct grossend vented flared pct grosschange rate percentage pointsrelative rate change pct
2,0202,021Alaskastate5,7075,9692624.59093,430,3223,486,0561.62470.16640.17120.00492.9187
2,0202,021Californiastate1,5551,506-49-3.1511157,534137,540-12.69190.98711.09500.107910.9277
2,0202,021Coloradostate3,0441,653-1,391-45.69651,999,7841,891,913-5.39410.15220.0874-0.0648-42.6002
2,0202,021Federal offshore Gulfoffshore_region12,1939,748-2,445-20.0525806,336792,102-1.76531.51211.2306-0.2815-18.6158
2,0202,021Idahostate0001081,3741,172.2222000
2,0202,021Louisianastate4,4913,499-992-22.08863,211,4913,448,5427.38130.13980.1015-0.0384-27.4442
2,0202,021Marylandstate000105-50000
2,0202,021Montanastate3,8703,126-744-19.224842,06741,849-0.51829.19967.4697-1.7299-18.8040
2,0202,021Nevadastate000124-66.6667000
2,0202,021New Mexicostate22,53517,277-5,258-23.33262,005,5182,277,03513.53851.12360.7588-0.3649-32.4745
2,0202,021North Dakotastate99,53276,459-23,073-23.1815986,9771,075,5538.974510.08457.1088-2.9757-29.5078
2,0202,021Texasstate125,336102,267-23,069-18.405710,489,72710,743,1062.41551.19480.9519-0.2429-20.3301
2,0202,021United Statesnational339,272287,775-51,497-15.178740,729,92741,676,7432.32460.83300.6905-0.1425-17.1057
2,0202,021Utahstate595529-66-11.0924242,560239,951-1.07560.24530.2205-0.0248-10.1257
2,0202,021Wyomingstate60,41565,7425,3278.81731,472,8731,375,454-6.61424.10184.77970.677816.5245
2,0212,022Alaskastate5,9697,1131,14419.16573,486,0563,586,8862.89240.17120.19830.027115.8159
2,0212,022Californiastate1,5061,534281.8592137,540135,984-1.13131.09501.12810.03313.0248
2,0212,022Coloradostate1,653566-1,087-65.75921,891,9131,833,421-3.09170.08740.0309-0.0565-64.6668
2,0212,022Federal offshore Gulfoffshore_region9,74811,3661,61816.5983792,102784,681-0.93691.23061.44850.217817.7010
2,0212,022Idahostate0001,3742,58087.7729000
2,0212,022Louisianastate3,4993,8163179.05973,448,5424,127,73719.69510.10150.0924-0.0090-8.8854
2,0212,022Marylandstate000550000
2,0212,022Montanastate3,1263,005-121-3.870841,84942,9022.51627.46977.0043-0.4654-6.2302
2,0212,022Nevadastate000440000
2,0212,022New Mexicostate17,27720,8733,59620.81382,277,0352,763,66321.37110.75880.7553-0.0035-0.4592
2,0212,022North Dakotastate76,45963,998-12,461-16.29761,075,5531,072,189-0.31287.10885.9689-1.1399-16.0350
2,0212,022Texasstate102,26799,698-2,569-2.512110,743,10611,438,5946.47380.95190.8716-0.0803-8.4395
2,0212,022United Statesnational287,775271,682-16,093-5.592241,676,74343,700,9284.85690.69050.6217-0.0688-9.9651
2,0212,022Utahstate5291,03750896.0302239,951260,5538.58590.22050.39800.177580.5301
2,0212,022Wyomingstate65,74258,675-7,067-10.74961,375,4541,298,566-5.59004.77974.5184-0.2612-5.4651
2,0222,023Alaskastate7,1137,034-79-1.11063,586,8863,503,995-2.31090.19830.20070.00241.2287
2,0222,023Californiastate1,5341,334-200-13.0378135,984133,181-2.06131.12811.0016-0.1264-11.2076
2,0222,023Coloradostate5666326611.66081,833,4211,826,767-0.36290.03090.03460.003712.0675
2,0222,023Federal offshore Gulfoffshore_region11,3669,491-1,875-16.4966784,681750,026-4.41641.44851.2654-0.1831-12.6383
2,0222,023Idahostate0002,5802,409-6.6279000
2,0222,023Louisianastate3,8161,990-1,826-47.85124,127,7374,355,8795.52700.09240.0457-0.0468-50.5825
2,0222,023Montanastate3,0052,837-168-5.590742,90245,5126.08367.00436.2335-0.7708-11.0048
2,0222,023Nevadastate000440000
2,0222,023New Mexicostate20,87324,8643,99119.12042,763,6633,194,36415.58440.75530.77840.02313.0592
2,0222,023North Dakotastate63,99862,176-1,822-2.84701,072,1891,187,90010.79205.96895.2341-0.7348-12.3104
2,0222,023Texasstate99,698156,02156,32356.493611,438,59412,232,9976.94490.87161.27540.403846.3310
2,0222,023United Statesnational271,682324,20752,52519.333343,700,92845,399,6703.88720.62170.71410.092414.8681
2,0222,023Utahstate1,0371,86783080.0386260,553289,82611.23500.39800.64420.246261.8543
2,0222,023Wyomingstate58,67555,961-2,714-4.62551,298,5661,310,0600.88514.51844.2716-0.2468-5.4623
2,0202,024Alaskastate5,7076,31160410.58353,430,3223,549,1653.46450.16640.17780.01146.8806
2,0202,024Californiastate1,5551,360-195-12.5402157,534125,751-20.17530.98711.08150.09449.5649
2,0202,024Coloradostate3,044219-2,825-92.80551,999,7841,846,820-7.64900.15220.0119-0.1404-92.2096
2,0202,024Federal offshore Gulfoffshore_region12,1939,814-2,379-19.5112806,336684,665-15.08941.51211.4334-0.0787-5.2076
2,0202,024Idahostate0001081,146961.1111000
2,0202,024Louisianastate4,4911,847-2,644-58.87333,211,4913,617,32112.63680.13980.0511-0.0888-63.4873
2,0202,024Montanastate3,8705,4971,62742.041342,06747,60213.15769.199611.54782.348225.5253
2,0202,024New Mexicostate22,53517,026-5,509-24.44642,005,5183,616,82080.34341.12360.4707-0.6529-58.1057
2,0202,024North Dakotastate99,53267,705-31,827-31.9767986,9771,253,36926.990710.08455.4018-4.6827-46.4344
2,0202,024Texasstate125,336163,51238,17630.458910,489,72712,918,98723.15851.19481.26570.07085.9277
2,0202,024United Statesnational339,272335,163-4,109-1.211140,729,92745,867,76112.61440.83300.7307-0.1023-12.2769
2,0202,024Utahstate5951,9321,337224.7059242,560306,32026.28630.24530.63070.3854157.1189
2,0202,024Wyomingstate60,41559,941-474-0.78461,472,8731,343,290-8.79804.10184.46230.36048.7864
2,0232,024Alaskastate7,0346,311-723-10.27863,503,9953,549,1651.28910.20070.1778-0.0229-11.4205
2,0232,024Californiastate1,3341,360261.9490133,181125,751-5.57891.00161.08150.07997.9727
2,0232,024Coloradostate632219-413-65.34811,826,7671,846,8201.09770.03460.0119-0.0227-65.7244
2,0232,024Federal offshore Gulfoffshore_region9,4919,8143233.4032750,026684,665-8.71451.26541.43340.168013.2745
2,0232,024Idahostate0002,4091,146-52.4284000
2,0232,024Louisianastate1,9901,847-143-7.18594,355,8793,617,321-16.95540.04570.05110.005411.7642
2,0232,024Montanastate2,8375,4972,66093.761045,51247,6024.59226.233511.54785.314385.2538
2,0232,024New Mexicostate24,86417,026-7,838-31.52353,194,3643,616,82013.22500.77840.4707-0.3076-39.5218
2,0232,024North Dakotastate62,17667,7055,5298.89251,187,9001,253,3695.51135.23415.40180.16773.2046
2,0232,024Texasstate156,021163,5127,4914.801312,232,99712,918,9875.60771.27541.2657-0.0097-0.7636
2,0232,024United Statesnational324,207335,16310,9563.379345,399,67045,867,7611.03100.71410.73070.01662.3243
2,0232,024Utahstate1,8671,932653.4815289,826306,3205.69100.64420.6307-0.0135-2.0905
2,0232,024Wyomingstate55,96159,9413,9807.11211,310,0601,343,2902.53654.27164.46230.19064.4624

Download the same complete table (CSV)

Complete 2020 through 2024 source geography panel, all 265 rows

All fifty state summaries plus DC, federal offshore Gulf and U.S. total in each year. Geographic completeness is not complete disposal measurement. Preserve source markers, zero denominator rates undefined.

Period: 2020 through 2024, fixed 2024 Annual edition. Units: Million cubic feet (MMcf) unless explicitly percentage, percentage points, rank or row count. Bcf conversions in article and graphics divide MMcf by 1,000..

Original sources: EIA Natural Gas Annual 2024, source edition November 2025, reissued February 2026

Complete 2020 through 2024 source geography panel; 2020 through 2024, fixed 2024 Annual edition; Million cubic feet (MMcf) unless explicitly percentage, percentage points, rank or row count. Bcf conversions in article and graphics divide MMcf by 1,000.
yearareageography typegross withdrawals mmcfvented flared mmcfvented flared statusvented flared source markervented flared pct grossgross source markersource filesource tablevintage
2020Alabamastate117,030not_availableNA117,030nga24.pdfS12024 Annual, released November 2025, reissued February 2026
2020Alaskastate3,430,3225,707reported_positive5,7070.16643,430,322nga24.pdfS22024 Annual, released November 2025, reissued February 2026
2020Arizonastate87not_availableNA87nga24.pdfS32024 Annual, released November 2025, reissued February 2026
2020Arkansasstate481,205not_availableNA481,205nga24.pdfS42024 Annual, released November 2025, reissued February 2026
2020Californiastate157,5341,555reported_positive1,5550.9871157,534nga24.pdfS52024 Annual, released November 2025, reissued February 2026
2020Coloradostate1,999,7843,044reported_positive3,0440.15221,999,784nga24.pdfS62024 Annual, released November 2025, reissued February 2026
2020Connecticutstate00reported_zero00nga24.pdfS72024 Annual, released November 2025, reissued February 2026
2020Delawarestate00reported_zero00nga24.pdfS82024 Annual, released November 2025, reissued February 2026
2020District of Columbiadistrict00reported_zero00nga24.pdfS92024 Annual, released November 2025, reissued February 2026
2020Federal offshore Gulfoffshore_region806,33612,193reported_positive12,1931.5121806,336nga24.pdfS122024 Annual, released November 2025, reissued February 2026
2020Floridastate6,025not_availableNA6,025nga24.pdfS102024 Annual, released November 2025, reissued February 2026
2020Georgiastate00reported_zero00nga24.pdfS112024 Annual, released November 2025, reissued February 2026
2020Hawaiistate00reported_zero00nga24.pdfS132024 Annual, released November 2025, reissued February 2026
2020Idahostate1080reported_zero00108nga24.pdfS142024 Annual, released November 2025, reissued February 2026
2020Illinoisstate1,840not_availableNA1,840nga24.pdfS152024 Annual, released November 2025, reissued February 2026
2020Indianastate4,197not_availableNA4,197nga24.pdfS162024 Annual, released November 2025, reissued February 2026
2020Iowastate00reported_zero00nga24.pdfS172024 Annual, released November 2025, reissued February 2026
2020Kansasstate163,362not_availableNA163,362nga24.pdfS182024 Annual, released November 2025, reissued February 2026
2020Kentuckystate89,595not_availableNA89,595nga24.pdfS192024 Annual, released November 2025, reissued February 2026
2020Louisianastate3,211,4914,491reported_positive4,4910.13983,211,491nga24.pdfS202024 Annual, released November 2025, reissued February 2026
2020Mainestate00reported_zero00nga24.pdfS212024 Annual, released November 2025, reissued February 2026
2020Marylandstate100reported_zero0010nga24.pdfS222024 Annual, released November 2025, reissued February 2026
2020Massachusettsstate00reported_zero00nga24.pdfS232024 Annual, released November 2025, reissued February 2026
2020Michiganstate75,935not_availableNA75,935nga24.pdfS242024 Annual, released November 2025, reissued February 2026
2020Minnesotastate00reported_zero00nga24.pdfS252024 Annual, released November 2025, reissued February 2026
2020Mississippistate28,697not_availableNA28,697nga24.pdfS262024 Annual, released November 2025, reissued February 2026
2020Missouristate1not_availableNA1nga24.pdfS272024 Annual, released November 2025, reissued February 2026
2020Montanastate42,0673,870reported_positive3,8709.199642,067nga24.pdfS282024 Annual, released November 2025, reissued February 2026
2020Nebraskastate351not_availableNA351nga24.pdfS292024 Annual, released November 2025, reissued February 2026
2020Nevadastate120reported_zero0012nga24.pdfS302024 Annual, released November 2025, reissued February 2026
2020New Hampshirestate00reported_zero00nga24.pdfS312024 Annual, released November 2025, reissued February 2026
2020New Jerseystate00reported_zero00nga24.pdfS322024 Annual, released November 2025, reissued February 2026
2020New Mexicostate2,005,51822,535reported_positive22,5351.12362,005,518nga24.pdfS332024 Annual, released November 2025, reissued February 2026
2020New Yorkstate9,657not_availableNA9,657nga24.pdfS342024 Annual, released November 2025, reissued February 2026
2020North Carolinastate00reported_zero00nga24.pdfS352024 Annual, released November 2025, reissued February 2026
2020North Dakotastate986,97799,532reported_positive99,53210.0845986,977nga24.pdfS362024 Annual, released November 2025, reissued February 2026
2020Ohiostate2,389,629not_availableNA2,389,629nga24.pdfS372024 Annual, released November 2025, reissued February 2026
2020Oklahomastate2,673,207not_availableNA2,673,207nga24.pdfS382024 Annual, released November 2025, reissued February 2026
2020Oregonstate3200reported_zero00320nga24.pdfS392024 Annual, released November 2025, reissued February 2026
2020Pennsylvaniastate7,168,902not_availableNA7,168,902nga24.pdfS402024 Annual, released November 2025, reissued February 2026
2020Rhode Islandstate00reported_zero00nga24.pdfS412024 Annual, released November 2025, reissued February 2026
2020South Carolinastate00reported_zero00nga24.pdfS422024 Annual, released November 2025, reissued February 2026
2020South Dakotastate160not_availableNA160nga24.pdfS432024 Annual, released November 2025, reissued February 2026
2020Tennesseestate3,602not_availableNA3,602nga24.pdfS442024 Annual, released November 2025, reissued February 2026
2020Texasstate10,489,727125,336reported_positive125,3361.194810,489,727nga24.pdfS452024 Annual, released November 2025, reissued February 2026
2020United Statesnational40,729,927339,272reported_positive339,2720.833040,729,927table-003.pdf32024 Annual, released November 2025, reissued February 2026
2020Utahstate242,560595reported_positive5950.2453242,560nga24.pdfS462024 Annual, released November 2025, reissued February 2026
2020Vermontstate00reported_zero00nga24.pdfS472024 Annual, released November 2025, reissued February 2026
2020Virginiastate102,815not_availableNA102,815nga24.pdfS482024 Annual, released November 2025, reissued February 2026
2020Washingtonstate00reported_zero00nga24.pdfS492024 Annual, released November 2025, reissued February 2026
2020West Virginiastate2,567,990not_availableNA2,567,990nga24.pdfS502024 Annual, released November 2025, reissued February 2026
2020Wisconsinstate00reported_zero00nga24.pdfS512024 Annual, released November 2025, reissued February 2026
2020Wyomingstate1,472,87360,415reported_positive60,4154.10181,472,873nga24.pdfS522024 Annual, released November 2025, reissued February 2026
2021Alabamastate107,233not_availableNA107,233nga24.pdfS12024 Annual, released November 2025, reissued February 2026
2021Alaskastate3,486,0565,969reported_positive5,9690.17123,486,056nga24.pdfS22024 Annual, released November 2025, reissued February 2026
2021Arizonastate229not_availableNA229nga24.pdfS32024 Annual, released November 2025, reissued February 2026
2021Arkansasstate448,283not_availableNA448,283nga24.pdfS42024 Annual, released November 2025, reissued February 2026
2021Californiastate137,5401,506reported_positive1,5061.0950137,540nga24.pdfS52024 Annual, released November 2025, reissued February 2026
2021Coloradostate1,891,9131,653reported_positive1,6530.08741,891,913nga24.pdfS62024 Annual, released November 2025, reissued February 2026
2021Connecticutstate00reported_zero00nga24.pdfS72024 Annual, released November 2025, reissued February 2026
2021Delawarestate00reported_zero00nga24.pdfS82024 Annual, released November 2025, reissued February 2026
2021District of Columbiadistrict00reported_zero00nga24.pdfS92024 Annual, released November 2025, reissued February 2026
2021Federal offshore Gulfoffshore_region792,1029,748reported_positive9,7481.2306792,102nga24.pdfS122024 Annual, released November 2025, reissued February 2026
2021Floridastate8,994not_availableNA8,994nga24.pdfS102024 Annual, released November 2025, reissued February 2026
2021Georgiastate00reported_zero00nga24.pdfS112024 Annual, released November 2025, reissued February 2026
2021Hawaiistate00reported_zero00nga24.pdfS132024 Annual, released November 2025, reissued February 2026
2021Idahostate1,3740reported_zero001,374nga24.pdfS142024 Annual, released November 2025, reissued February 2026
2021Illinoisstate1,637not_availableNA1,637nga24.pdfS152024 Annual, released November 2025, reissued February 2026
2021Indianastate4,063not_availableNA4,063nga24.pdfS162024 Annual, released November 2025, reissued February 2026
2021Iowastate00reported_zero00nga24.pdfS172024 Annual, released November 2025, reissued February 2026
2021Kansasstate152,986not_availableNA152,986nga24.pdfS182024 Annual, released November 2025, reissued February 2026
2021Kentuckystate75,373not_availableNA75,373nga24.pdfS192024 Annual, released November 2025, reissued February 2026
2021Louisianastate3,448,5423,499reported_positive3,4990.10153,448,542nga24.pdfS202024 Annual, released November 2025, reissued February 2026
2021Mainestate00reported_zero00nga24.pdfS212024 Annual, released November 2025, reissued February 2026
2021Marylandstate50reported_zero005nga24.pdfS222024 Annual, released November 2025, reissued February 2026
2021Massachusettsstate00reported_zero00nga24.pdfS232024 Annual, released November 2025, reissued February 2026
2021Michiganstate74,057not_availableNA74,057nga24.pdfS242024 Annual, released November 2025, reissued February 2026
2021Minnesotastate00reported_zero00nga24.pdfS252024 Annual, released November 2025, reissued February 2026
2021Mississippistate27,569not_availableNA27,569nga24.pdfS262024 Annual, released November 2025, reissued February 2026
2021Missouristatenot_availableNA*nga24.pdfS272024 Annual, released November 2025, reissued February 2026
2021Montanastate41,8493,126reported_positive3,1267.469741,849nga24.pdfS282024 Annual, released November 2025, reissued February 2026
2021Nebraskastate327not_availableNA327nga24.pdfS292024 Annual, released November 2025, reissued February 2026
2021Nevadastate40reported_zero004nga24.pdfS302024 Annual, released November 2025, reissued February 2026
2021New Hampshirestate00reported_zero00nga24.pdfS312024 Annual, released November 2025, reissued February 2026
2021New Jerseystate00reported_zero00nga24.pdfS322024 Annual, released November 2025, reissued February 2026
2021New Mexicostate2,277,03517,277reported_positive17,2770.75882,277,035nga24.pdfS332024 Annual, released November 2025, reissued February 2026
2021New Yorkstate9,708not_availableNA9,708nga24.pdfS342024 Annual, released November 2025, reissued February 2026
2021North Carolinastate00reported_zero00nga24.pdfS352024 Annual, released November 2025, reissued February 2026
2021North Dakotastate1,075,55376,459reported_positive76,4597.10881,075,553nga24.pdfS362024 Annual, released November 2025, reissued February 2026
2021Ohiostate2,278,731not_availableNA2,278,731nga24.pdfS372024 Annual, released November 2025, reissued February 2026
2021Oklahomastate2,555,430not_availableNA2,555,430nga24.pdfS382024 Annual, released November 2025, reissued February 2026
2021Oregonstate205not_availableNA205nga24.pdfS392024 Annual, released November 2025, reissued February 2026
2021Pennsylvaniastate7,647,068not_availableNA7,647,068nga24.pdfS402024 Annual, released November 2025, reissued February 2026
2021Rhode Islandstate00reported_zero00nga24.pdfS412024 Annual, released November 2025, reissued February 2026
2021South Carolinastate00reported_zero00nga24.pdfS422024 Annual, released November 2025, reissued February 2026
2021South Dakotastate161not_availableNA161nga24.pdfS432024 Annual, released November 2025, reissued February 2026
2021Tennesseestate3,016not_availableNA3,016nga24.pdfS442024 Annual, released November 2025, reissued February 2026
2021Texasstate10,743,106102,267reported_positive102,2670.951910,743,106nga24.pdfS452024 Annual, released November 2025, reissued February 2026
2021United Statesnational41,676,743287,775reported_positive287,7750.690541,676,743table-003.pdf32024 Annual, released November 2025, reissued February 2026
2021Utahstate239,951529reported_positive5290.2205239,951nga24.pdfS462024 Annual, released November 2025, reissued February 2026
2021Vermontstate00reported_zero00nga24.pdfS472024 Annual, released November 2025, reissued February 2026
2021Virginiastate96,044not_availableNA96,044nga24.pdfS482024 Annual, released November 2025, reissued February 2026
2021Washingtonstate00reported_zero00nga24.pdfS492024 Annual, released November 2025, reissued February 2026
2021West Virginiastate2,675,145not_availableNA2,675,145nga24.pdfS502024 Annual, released November 2025, reissued February 2026
2021Wisconsinstate00reported_zero00nga24.pdfS512024 Annual, released November 2025, reissued February 2026
2021Wyomingstate1,375,45465,742reported_positive65,7424.77971,375,454nga24.pdfS522024 Annual, released November 2025, reissued February 2026
2022Alabamastate95,795not_availableNA95,795nga24.pdfS12024 Annual, released November 2025, reissued February 2026
2022Alaskastate3,586,8867,113reported_positive7,1130.19833,586,886nga24.pdfS22024 Annual, released November 2025, reissued February 2026
2022Arizonastate183not_availableNA183nga24.pdfS32024 Annual, released November 2025, reissued February 2026
2022Arkansasstate416,225not_availableNA416,225nga24.pdfS42024 Annual, released November 2025, reissued February 2026
2022Californiastate135,9841,534reported_positive1,5341.1281135,984nga24.pdfS52024 Annual, released November 2025, reissued February 2026
2022Coloradostate1,833,421566reported_positive5660.03091,833,421nga24.pdfS62024 Annual, released November 2025, reissued February 2026
2022Connecticutstate00reported_zero00nga24.pdfS72024 Annual, released November 2025, reissued February 2026
2022Delawarestate00reported_zero00nga24.pdfS82024 Annual, released November 2025, reissued February 2026
2022District of Columbiadistrict00reported_zero00nga24.pdfS92024 Annual, released November 2025, reissued February 2026
2022Federal offshore Gulfoffshore_region784,68111,366reported_positive11,3661.4485784,681nga24.pdfS122024 Annual, released November 2025, reissued February 2026
2022Floridastate5,175not_availableNA5,175nga24.pdfS102024 Annual, released November 2025, reissued February 2026
2022Georgiastate00reported_zero00nga24.pdfS112024 Annual, released November 2025, reissued February 2026
2022Hawaiistate00reported_zero00nga24.pdfS132024 Annual, released November 2025, reissued February 2026
2022Idahostate2,5800reported_zero002,580nga24.pdfS142024 Annual, released November 2025, reissued February 2026
2022Illinoisstate2,003not_availableNA2,003nga24.pdfS152024 Annual, released November 2025, reissued February 2026
2022Indianastate3,836not_availableNA3,836nga24.pdfS162024 Annual, released November 2025, reissued February 2026
2022Iowastate00reported_zero00nga24.pdfS172024 Annual, released November 2025, reissued February 2026
2022Kansasstate147,950not_availableNA147,950nga24.pdfS182024 Annual, released November 2025, reissued February 2026
2022Kentuckystate85,513not_availableNA85,513nga24.pdfS192024 Annual, released November 2025, reissued February 2026
2022Louisianastate4,127,7373,816reported_positive3,8160.09244,127,737nga24.pdfS202024 Annual, released November 2025, reissued February 2026
2022Mainestate00reported_zero00nga24.pdfS212024 Annual, released November 2025, reissued February 2026
2022Marylandstate50reported_zero005nga24.pdfS222024 Annual, released November 2025, reissued February 2026
2022Massachusettsstate00reported_zero00nga24.pdfS232024 Annual, released November 2025, reissued February 2026
2022Michiganstate69,919not_availableNA69,919nga24.pdfS242024 Annual, released November 2025, reissued February 2026
2022Minnesotastate00reported_zero00nga24.pdfS252024 Annual, released November 2025, reissued February 2026
2022Mississippistate28,507not_availableNA28,507nga24.pdfS262024 Annual, released November 2025, reissued February 2026
2022Missouristate1not_availableNA1nga24.pdfS272024 Annual, released November 2025, reissued February 2026
2022Montanastate42,9023,005reported_positive3,0057.004342,902nga24.pdfS282024 Annual, released November 2025, reissued February 2026
2022Nebraskastate320not_availableNA320nga24.pdfS292024 Annual, released November 2025, reissued February 2026
2022Nevadastate40reported_zero004nga24.pdfS302024 Annual, released November 2025, reissued February 2026
2022New Hampshirestate00reported_zero00nga24.pdfS312024 Annual, released November 2025, reissued February 2026
2022New Jerseystate00reported_zero00nga24.pdfS322024 Annual, released November 2025, reissued February 2026
2022New Mexicostate2,763,66320,873reported_positive20,8730.75532,763,663nga24.pdfS332024 Annual, released November 2025, reissued February 2026
2022New Yorkstate9,441not_availableNA9,441nga24.pdfS342024 Annual, released November 2025, reissued February 2026
2022North Carolinastate00reported_zero00nga24.pdfS352024 Annual, released November 2025, reissued February 2026
2022North Dakotastate1,072,18963,998reported_positive63,9985.96891,072,189nga24.pdfS362024 Annual, released November 2025, reissued February 2026
2022Ohiostate2,274,990not_availableNA2,274,990nga24.pdfS372024 Annual, released November 2025, reissued February 2026
2022Oklahomastate2,763,069not_availableNA2,763,069nga24.pdfS382024 Annual, released November 2025, reissued February 2026
2022Oregonstate13not_availableNA13nga24.pdfS392024 Annual, released November 2025, reissued February 2026
2022Pennsylvaniastate7,513,567not_availableNA7,513,567nga24.pdfS402024 Annual, released November 2025, reissued February 2026
2022Rhode Islandstate00reported_zero00nga24.pdfS412024 Annual, released November 2025, reissued February 2026
2022South Carolinastate00reported_zero00nga24.pdfS422024 Annual, released November 2025, reissued February 2026
2022South Dakotastate165not_availableNA165nga24.pdfS432024 Annual, released November 2025, reissued February 2026
2022Tennesseestate3,001not_availableNA3,001nga24.pdfS442024 Annual, released November 2025, reissued February 2026
2022Texasstate11,438,59499,698reported_positive99,6980.871611,438,594nga24.pdfS452024 Annual, released November 2025, reissued February 2026
2022United Statesnational43,700,928271,682reported_positive271,6820.621743,700,928table-003.pdf32024 Annual, released November 2025, reissued February 2026
2022Utahstate260,5531,037reported_positive1,0370.3980260,553nga24.pdfS462024 Annual, released November 2025, reissued February 2026
2022Vermontstate00reported_zero00nga24.pdfS472024 Annual, released November 2025, reissued February 2026
2022Virginiastate88,411not_availableNA88,411nga24.pdfS482024 Annual, released November 2025, reissued February 2026
2022Washingtonstate00reported_zero00nga24.pdfS492024 Annual, released November 2025, reissued February 2026
2022West Virginiastate2,845,082not_availableNA2,845,082nga24.pdfS502024 Annual, released November 2025, reissued February 2026
2022Wisconsinstate00reported_zero00nga24.pdfS512024 Annual, released November 2025, reissued February 2026
2022Wyomingstate1,298,56658,675reported_positive58,6754.51841,298,566nga24.pdfS522024 Annual, released November 2025, reissued February 2026
2023Alabamastate87,391not_availableNA87,391nga24.pdfS12024 Annual, released November 2025, reissued February 2026
2023Alaskastate3,503,9957,034reported_positive7,0340.20073,503,995nga24.pdfS22024 Annual, released November 2025, reissued February 2026
2023Arizonastate172not_availableNA172nga24.pdfS32024 Annual, released November 2025, reissued February 2026
2023Arkansasstate389,529not_availableNA389,529nga24.pdfS42024 Annual, released November 2025, reissued February 2026
2023Californiastate133,1811,334reported_positive1,3341.0016133,181nga24.pdfS52024 Annual, released November 2025, reissued February 2026
2023Coloradostate1,826,767632reported_positive6320.03461,826,767nga24.pdfS62024 Annual, released November 2025, reissued February 2026
2023Connecticutstate00reported_zero00nga24.pdfS72024 Annual, released November 2025, reissued February 2026
2023Delawarestate00reported_zero00nga24.pdfS82024 Annual, released November 2025, reissued February 2026
2023District of Columbiadistrict00reported_zero00nga24.pdfS92024 Annual, released November 2025, reissued February 2026
2023Federal offshore Gulfoffshore_region750,0269,491reported_positive9,4911.2654750,026nga24.pdfS122024 Annual, released November 2025, reissued February 2026
2023Floridastate3,534not_availableNA3,534nga24.pdfS102024 Annual, released November 2025, reissued February 2026
2023Georgiastate00reported_zero00nga24.pdfS112024 Annual, released November 2025, reissued February 2026
2023Hawaiistate00reported_zero00nga24.pdfS132024 Annual, released November 2025, reissued February 2026
2023Idahostate2,4090reported_zero002,409nga24.pdfS142024 Annual, released November 2025, reissued February 2026
2023Illinoisstate2,588not_availableNA2,588nga24.pdfS152024 Annual, released November 2025, reissued February 2026
2023Indianastate3,826not_availableNA3,826nga24.pdfS162024 Annual, released November 2025, reissued February 2026
2023Iowastate00reported_zero00nga24.pdfS172024 Annual, released November 2025, reissued February 2026
2023Kansasstate136,897not_availableNA136,897nga24.pdfS182024 Annual, released November 2025, reissued February 2026
2023Kentuckystate60,474not_availableNA60,474nga24.pdfS192024 Annual, released November 2025, reissued February 2026
2023Louisianastate4,355,8791,990reported_positive1,9900.04574,355,879nga24.pdfS202024 Annual, released November 2025, reissued February 2026
2023Mainestate00reported_zero00nga24.pdfS212024 Annual, released November 2025, reissued February 2026
2023Marylandstate3not_availableNA3nga24.pdfS222024 Annual, released November 2025, reissued February 2026
2023Massachusettsstate00reported_zero00nga24.pdfS232024 Annual, released November 2025, reissued February 2026
2023Michiganstate68,316not_availableNA68,316nga24.pdfS242024 Annual, released November 2025, reissued February 2026
2023Minnesotastate00reported_zero00nga24.pdfS252024 Annual, released November 2025, reissued February 2026
2023Mississippistate27,201not_availableNA27,201nga24.pdfS262024 Annual, released November 2025, reissued February 2026
2023Missouristate1not_availableNA1nga24.pdfS272024 Annual, released November 2025, reissued February 2026
2023Montanastate45,5122,837reported_positive2,8376.233545,512nga24.pdfS282024 Annual, released November 2025, reissued February 2026
2023Nebraskastate265not_availableNA265nga24.pdfS292024 Annual, released November 2025, reissued February 2026
2023Nevadastate40reported_zero004nga24.pdfS302024 Annual, released November 2025, reissued February 2026
2023New Hampshirestate00reported_zero00nga24.pdfS312024 Annual, released November 2025, reissued February 2026
2023New Jerseystate00reported_zero00nga24.pdfS322024 Annual, released November 2025, reissued February 2026
2023New Mexicostate3,194,36424,864reported_positive24,8640.77843,194,364nga24.pdfS332024 Annual, released November 2025, reissued February 2026
2023New Yorkstate8,336not_availableNA8,336nga24.pdfS342024 Annual, released November 2025, reissued February 2026
2023North Carolinastate00reported_zero00nga24.pdfS352024 Annual, released November 2025, reissued February 2026
2023North Dakotastate1,187,90062,176reported_positive62,1765.23411,187,900nga24.pdfS362024 Annual, released November 2025, reissued February 2026
2023Ohiostate2,226,646not_availableNA2,226,646nga24.pdfS372024 Annual, released November 2025, reissued February 2026
2023Oklahomastate2,759,502not_availableNA2,759,502nga24.pdfS382024 Annual, released November 2025, reissued February 2026
2023Oregonstate91not_availableNA91nga24.pdfS392024 Annual, released November 2025, reissued February 2026
2023Pennsylvaniastate7,565,634not_availableNA7,565,634nga24.pdfS402024 Annual, released November 2025, reissued February 2026
2023Rhode Islandstate00reported_zero00nga24.pdfS412024 Annual, released November 2025, reissued February 2026
2023South Carolinastate00reported_zero00nga24.pdfS422024 Annual, released November 2025, reissued February 2026
2023South Dakotastate125not_availableNA125nga24.pdfS432024 Annual, released November 2025, reissued February 2026
2023Tennesseestate2,660not_availableNA2,660nga24.pdfS442024 Annual, released November 2025, reissued February 2026
2023Texasstate12,232,997156,021reported_positive156,0211.275412,232,997nga24.pdfS452024 Annual, released November 2025, reissued February 2026
2023United Statesnational45,399,670324,207reported_positive324,2070.714145,399,670table-003.pdf32024 Annual, released November 2025, reissued February 2026
2023Utahstate289,8261,867reported_positive1,8670.6442289,826nga24.pdfS462024 Annual, released November 2025, reissued February 2026
2023Vermontstate00reported_zero00nga24.pdfS472024 Annual, released November 2025, reissued February 2026
2023Virginiastate83,558not_availableNA83,558nga24.pdfS482024 Annual, released November 2025, reissued February 2026
2023Washingtonstate00reported_zero00nga24.pdfS492024 Annual, released November 2025, reissued February 2026
2023West Virginiastate3,140,004not_availableNA3,140,004nga24.pdfS502024 Annual, released November 2025, reissued February 2026
2023Wisconsinstate00reported_zero00nga24.pdfS512024 Annual, released November 2025, reissued February 2026
2023Wyomingstate1,310,06055,961reported_positive55,9614.27161,310,060nga24.pdfS522024 Annual, released November 2025, reissued February 2026
2024Alabamastate75,800not_availableNA75,800nga24.pdfS12024 Annual, released November 2025, reissued February 2026
2024Alaskastate3,549,1656,311reported_positive6,3110.17783,549,165nga24.pdfS22024 Annual, released November 2025, reissued February 2026
2024Arizonastate139not_availableNA139nga24.pdfS32024 Annual, released November 2025, reissued February 2026
2024Arkansasstate355,308not_availableNA355,308nga24.pdfS42024 Annual, released November 2025, reissued February 2026
2024Californiastate125,7511,360reported_positive1,3601.0815125,751nga24.pdfS52024 Annual, released November 2025, reissued February 2026
2024Coloradostate1,846,820219reported_positive2190.01191,846,820nga24.pdfS62024 Annual, released November 2025, reissued February 2026
2024Connecticutstate00reported_zero00nga24.pdfS72024 Annual, released November 2025, reissued February 2026
2024Delawarestate00reported_zero00nga24.pdfS82024 Annual, released November 2025, reissued February 2026
2024District of Columbiadistrict00reported_zero00nga24.pdfS92024 Annual, released November 2025, reissued February 2026
2024Federal offshore Gulfoffshore_region684,6659,814reported_positive9,8141.4334684,665nga24.pdfS122024 Annual, released November 2025, reissued February 2026
2024Floridastate4,454not_availableNA4,454nga24.pdfS102024 Annual, released November 2025, reissued February 2026
2024Georgiastate00reported_zero00nga24.pdfS112024 Annual, released November 2025, reissued February 2026
2024Hawaiistate00reported_zero00nga24.pdfS132024 Annual, released November 2025, reissued February 2026
2024Idahostate1,1460reported_zero001,146nga24.pdfS142024 Annual, released November 2025, reissued February 2026
2024Illinoisstate3,191not_availableNA3,191nga24.pdfS152024 Annual, released November 2025, reissued February 2026
2024Indianastate3,251not_availableNA3,251nga24.pdfS162024 Annual, released November 2025, reissued February 2026
2024Iowastate00reported_zero00nga24.pdfS172024 Annual, released November 2025, reissued February 2026
2024Kansasstate125,9430reported_zero00125,943nga24.pdfS182024 Annual, released November 2025, reissued February 2026
2024Kentuckystate58,816not_availableNA58,816nga24.pdfS192024 Annual, released November 2025, reissued February 2026
2024Louisianastate3,617,3211,847reported_positive1,8470.05113,617,321nga24.pdfS202024 Annual, released November 2025, reissued February 2026
2024Mainestate00reported_zero00nga24.pdfS212024 Annual, released November 2025, reissued February 2026
2024Marylandstate5not_availableNA5nga24.pdfS222024 Annual, released November 2025, reissued February 2026
2024Massachusettsstate00reported_zero00nga24.pdfS232024 Annual, released November 2025, reissued February 2026
2024Michiganstate64,129not_availableNA64,129nga24.pdfS242024 Annual, released November 2025, reissued February 2026
2024Minnesotastate00reported_zero00nga24.pdfS252024 Annual, released November 2025, reissued February 2026
2024Mississippistate25,752not_availableNA25,752nga24.pdfS262024 Annual, released November 2025, reissued February 2026
2024Missouristate1not_availableNA1nga24.pdfS272024 Annual, released November 2025, reissued February 2026
2024Montanastate47,6025,497reported_positive5,49711.547847,602nga24.pdfS282024 Annual, released November 2025, reissued February 2026
2024Nebraskastate261not_availableNA261nga24.pdfS292024 Annual, released November 2025, reissued February 2026
2024Nevadastate4not_availableNA4nga24.pdfS302024 Annual, released November 2025, reissued February 2026
2024New Hampshirestate00reported_zero00nga24.pdfS312024 Annual, released November 2025, reissued February 2026
2024New Jerseystate00reported_zero00nga24.pdfS322024 Annual, released November 2025, reissued February 2026
2024New Mexicostate3,616,82017,026reported_positive17,0260.47073,616,820nga24.pdfS332024 Annual, released November 2025, reissued February 2026
2024New Yorkstate8,836not_availableNA8,836nga24.pdfS342024 Annual, released November 2025, reissued February 2026
2024North Carolinastate00reported_zero00nga24.pdfS352024 Annual, released November 2025, reissued February 2026
2024North Dakotastate1,253,36967,705reported_positive67,7055.40181,253,369nga24.pdfS362024 Annual, released November 2025, reissued February 2026
2024Ohiostate2,155,929not_availableNA2,155,929nga24.pdfS372024 Annual, released November 2025, reissued February 2026
2024Oklahomastate2,750,607not_availableNA2,750,607nga24.pdfS382024 Annual, released November 2025, reissued February 2026
2024Oregonstate84not_availableNA84nga24.pdfS392024 Annual, released November 2025, reissued February 2026
2024Pennsylvaniastate7,422,303not_availableNA7,422,303nga24.pdfS402024 Annual, released November 2025, reissued February 2026
2024Rhode Islandstate00reported_zero00nga24.pdfS412024 Annual, released November 2025, reissued February 2026
2024South Carolinastate00reported_zero00nga24.pdfS422024 Annual, released November 2025, reissued February 2026
2024South Dakotastate1350reported_zero00135nga24.pdfS432024 Annual, released November 2025, reissued February 2026
2024Tennesseestate2,667not_availableNA2,667nga24.pdfS442024 Annual, released November 2025, reissued February 2026
2024Texasstate12,918,987163,512reported_positive163,5121.265712,918,987nga24.pdfS452024 Annual, released November 2025, reissued February 2026
2024United Statesnational45,867,761335,163reported_positive335,1630.730745,867,761table-003.pdf32024 Annual, released November 2025, reissued February 2026
2024Utahstate306,3201,932reported_positive1,9320.6307306,320nga24.pdfS462024 Annual, released November 2025, reissued February 2026
2024Vermontstate00reported_zero00nga24.pdfS472024 Annual, released November 2025, reissued February 2026
2024Virginiastate80,896not_availableNA80,896nga24.pdfS482024 Annual, released November 2025, reissued February 2026
2024Washingtonstate00reported_zero00nga24.pdfS492024 Annual, released November 2025, reissued February 2026
2024West Virginiastate3,417,995not_availableNA3,417,995nga24.pdfS502024 Annual, released November 2025, reissued February 2026
2024Wisconsinstate00reported_zero00nga24.pdfS512024 Annual, released November 2025, reissued February 2026
2024Wyomingstate1,343,29059,941reported_positive59,9414.46231,343,290nga24.pdfS522024 Annual, released November 2025, reissued February 2026

Download the same complete table (CSV)

Data and downloads

Read the tables directly or download the research. No form or account is required.

Reproducible research bundle (ZIP) · Research reference (PDF, 2 pages, 161 KB) · Full data dictionary · Calculation program (Python)

2024 state rankings (CSV)

2025 incomplete series excluded (CSV)

Annual coverage audit (CSV)

Annual national reconciliation (CSV)

Annual source inputs (CSV)

Annual state ranks (CSV)

Annual versus current series audit (CSV)

Annual volume concentration (CSV)

Archived as published 2012 2019 (CSV)

Current series source cells (CSV)

Matched period changes (CSV)

Source cell ledger (CSV)

State panel 2020 2024 (CSV)

Cite this page

Credit the U.S. Energy Information Administration for source observations and American Mineral Registry for compilation and calculations. Preserve the 2020 through 2024 fixed edition, combined venting and flaring category, matched gross denominator and reported value eligibility. The stated license applies to original American Mineral Registry writing, calculations and graphics, not a claim over third party source content.

American Mineral Registry. "U.S. Natural Gas Venting and Flaring Statistics: State Volumes and Rates." American Mineral Registry, November 2026. https://americanmineralregistry.com/research/us-natural-gas-venting-flaring-statistics/
<a href="https://americanmineralregistry.com/research/us-natural-gas-venting-flaring-statistics/">U.S. Natural Gas Venting and Flaring</a> (American Mineral Registry, November 2026)