Key takeaways
- EIA recorded 45.868 trillion cubic feet of U.S. gross natural gas withdrawals and 37.725 trillion cubic feet of dry production in 2024. Dry production was 82.2% of gross withdrawals. The denominator is annual gross U.S. gas withdrawals from EIA’s national series.
- U.S. marketed natural gas production was 41.384 trillion cubic feet in 2024. EIA recorded 4.484 trillion cubic feet of repressuring, venting and flaring, and nonhydrocarbon gas removal combined.
- EIA’s U.S. extraction loss was 3.659 trillion cubic feet in 2024, or 8.8% of marketed production. The figure measures the gaseous equivalent of liquids extracted in processing.
- U.S. dry gas production grew by 18.459 trillion cubic feet from 2007 to 2024 while gross withdrawals grew by 21.204 trillion cubic feet. Dry output accounted for 87.1% of the difference between the two EIA gross withdrawal observations.
- Plant extraction loss rose by 2.729 trillion cubic feet between 2007 and 2024 in EIA’s U.S. natural gas series. The gross-to-dry gap widened by 2.745 trillion cubic feet over the same years. Other deductions partly offset one another.
- At the 2007 dry-to-gross ratio, the U.S. would have recorded 35.830 trillion cubic feet of dry gas at its observed 2024 gross volume, 1.895 trillion cubic feet below the EIA result. The comparison holds the ratio fixed as a calculation using the two published years.
- Louisiana and New Mexico were separated by 501 MMcf in 2024 gross withdrawals, but Louisiana reported 268,673 MMcf more dry natural gas. The difference in the reported liquids extraction deductions was 254,241 MMcf. The published state allocation does not identify the origin of every molecule processed.

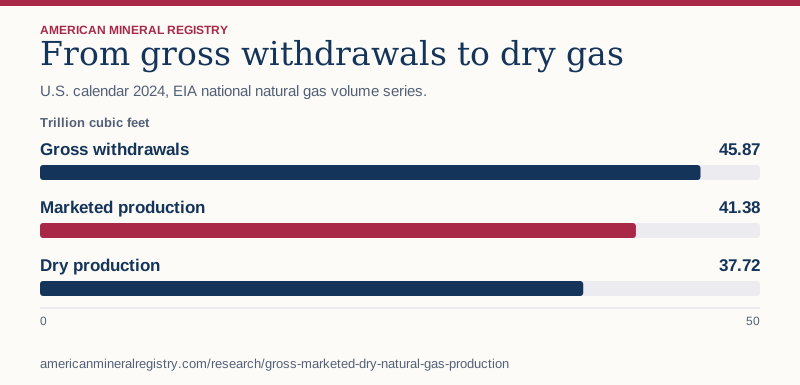
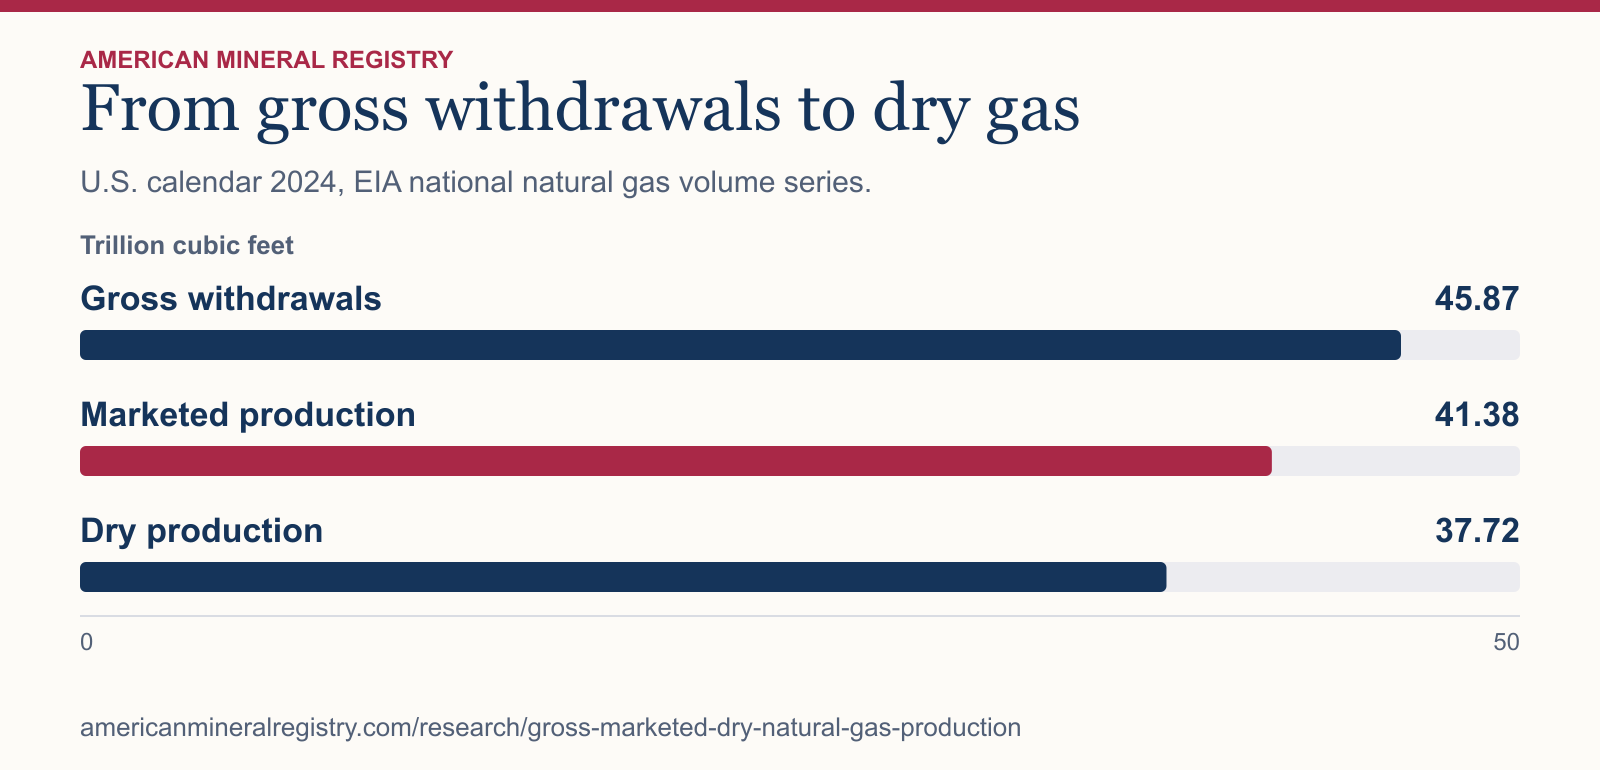
Figure 1 in text
U.S. calendar 2024, EIA national natural gas volume series. Trillion cubic feet.
| Category | Trillion cubic feet |
|---|---|
| Gross withdrawals | 45.87 |
| Marketed production | 41.38 |
| Dry production | 37.72 |
Chart wording and scale
From gross withdrawals to dry gas U.S. calendar 2024, EIA national natural gas volume series.
Trillion cubic feet
Gross withdrawals
45.87
Marketed production
41.38
Dry production
37.72 0 50
Source and data: Download chart source data
Permanent link to this figure’s text and data · Sources and context
Which natural gas production figure should I use?
Use gross withdrawals for the full stream withdrawn at the well, marketed production for the volume after EIA’s nonmarketed deductions, and dry production for the volume after the gas equivalent of extracted liquids has also been subtracted.
Choose the measurement stage before choosing the latest number. A national comparison of sources such as shale or oil wells uses the gross denominator. A comparison of dry gas production uses the dry series. For delivered gas, use a delivery or consumption series covering the same customer group and geography.
| What you want to measure | Series to use | What to record |
|---|---|---|
| Gas withdrawn at the production stage | Gross withdrawals | Geography, period and pressure basis |
| Gas after nonmarketed deductions | Marketed production | Named EIA deductions and reporting vintage |
| Gas after extraction of plant liquids | Dry production | Period, volume unit and extraction basis |
| Gas delivered to a customer group | Deliveries by sector | Customer group, geography and period |
What is still in gross and marketed gas?
Gross withdrawals include plant liquids in the gas stream and nonhydrocarbon gases, with lease condensate excluded. EIA’s marketed figure still includes gas used in field and processing operations. The word marketed in this series therefore describes an accounting stage. Use sales records when your question is how much gas was actually sold.
Repressuring returns gas to a reservoir. Vented gas is released, while flaring burns gas. EIA combines their volumes in this series. Treatment can remove gases such as carbon dioxide and nitrogen. Plant extraction is a later deduction for natural gas liquids. See the EIA production definitions and notes.
How do gross withdrawals become marketed and dry gas?
Gross withdrawals measure the gas stream at the production stage. EIA subtracts gas used for repressuring, vented and flared gas, and nonhydrocarbon gases removed to reach marketed production. It then subtracts extraction loss to calculate dry production.
Use the bridge below to reconcile three commonly quoted U.S. production figures for the same year.
| EIA measure | 2024 trillion cubic feet | Role in the calculation |
|---|---|---|
| Gross withdrawals | 45.868 | Starting volume |
| Repressuring | 3.855 | Removed before marketed production |
| Vented and flared | 0.335 | Removed before marketed production |
| Nonhydrocarbon gases removed | 0.293 | Removed before marketed production |
| Marketed production | 41.384 | After nonmarketed volumes |
| Extraction loss | 3.659 | Plant liquids in gaseous equivalent |
| Dry production | 37.725 | After extraction loss |
Does the gap stay the same from year to year?
The dry share was 78.1% in 2007 and 82.2% in 2024. Across the 18 matched years, the lowest share was 78.1% and the highest was 83.1%.
A fixed conversion factor would miss changes in the annual mix of gas removed before marketing and liquids extracted during processing.
| Year | Gross Tcf | Marketed Tcf | Dry Tcf | Dry share of gross |
|---|---|---|---|---|
| 2007 | 24.664 | 0.930 | 19.266 | 78.1% |
| 2010 | 26.816 | 1.066 | 21.316 | 79.5% |
| 2015 | 32.915 | 1.707 | 27.065 | 82.2% |
| 2020 | 40.730 | 2.710 | 33.811 | 83.0% |
| 2024 | 45.868 | 3.659 | 37.725 | 82.2% |
How much of the gap was venting and flaring?
Venting and flaring represented 0.7% of gross withdrawals in 2024, while the total difference between gross and dry production was 17.8% of gross withdrawals.
The total difference also includes repressuring, removal of nonhydrocarbon gases and processing extraction loss. Use the vented and flared column when writing about that specific activity. For reported state volumes and shares of gross withdrawals, use the venting and flaring comparison.
Which volume should an article cite?
Use gross withdrawals when comparing sources at the production stage, marketed production when the source specifies that stage, and dry production for the post-extraction output. Preserve the source’s label in a chart or a denominator.
The U.S. well-type study uses gross withdrawals so each source category has the same denominator.
How much of the added gross volume appeared as dry gas?
Gross U.S. withdrawals increased by 21.204 Tcf between 2007 and 2024. Dry output increased by 18.459 Tcf. Subtracting those two changes leaves 2.745 Tcf of growth in the gap between gross and dry output.
Comparing the changes answers a different question from dividing total dry output by total gross withdrawals. The first calculation describes the difference between endpoints. The second describes the relationship between the two totals in one year.
| Period | Gross increase, Tcf | Dry increase, Tcf | Dry share of gross increase |
|---|---|---|---|
| 2007 to 2014 | 6.742 | 6.624 | 98.2% |
| 2014 to 2019 | 9.375 | 8.009 | 85.4% |
| 2019 to 2024 | 5.088 | 3.826 | 75.2% |
Which deductions explain the wider gap?
Extraction loss had the largest absolute increase among the four deductions, adding 2.729 Tcf. Nonhydrocarbon removal fell. Repressuring and venting and flaring grew in absolute volume. Their signed changes can be added to bridge the gap.
Extraction loss measures the gaseous equivalent of liquids removed from the gas stream. Treating it as flaring would misattribute the largest change. The rounded published components can differ from the independently reported gap by one million cubic feet in a year.
| Deduction | 2007 Tcf | 2024 Tcf | Change, Tcf |
|---|---|---|---|
| Repressuring | 3.663 | 3.855 | 0.193 |
| Vented and flared | 0.143 | 0.335 | 0.192 |
| Nonhydrocarbon removal | 0.661 | 0.293 | -0.368 |
| Extraction loss | 0.930 | 3.659 | 2.729 |
What would 2024 dry output be at the 2007 ratio?
Multiply 2024 gross withdrawals by the unrounded 2007 ratio of dry production to gross withdrawals. The calculation gives 35.830 Tcf. Observed dry production is 37.725 Tcf. The difference is 1.895 Tcf.
This calculation isolates the arithmetic effect of using a different ratio with the same gross total. Across all 18 years, the median dry-to-gross ratio was 82.18%. To reproduce the counterfactual, divide the original integer volumes before multiplying rather than using the displayed rounded share.
Can a higher flared volume coincide with a lower flaring share?
From 2009 to 2010, vented and flared volume rose from 165,360 to 165,928 MMcf, but its share fell from 0.635% to 0.619% because gross withdrawals grew faster. Across all 18 years, the largest absolute volume was 0.539 Tcf in 2019.
A researcher comparing losses should preserve the gross denominator and the combined vented-and-flared category. This series does not separately quantify venting and flaring in the national total.
| Calendar year | Vented and flared Tcf | Gross withdrawals Tcf | Vented and flared share |
|---|---|---|---|
| 2009 | 0.165 | 26.057 | 0.635% |
| 2010 | 0.166 | 26.816 | 0.619% |
| 2019 | 0.539 | 40.780 | 1.323% |
| 2023 | 0.324 | 45.400 | 0.714% |
| 2024 | 0.335 | 45.868 | 0.731% |
How can the annual difference be checked before citation?
Start with the same country, calendar year and units on both sides. Subtract dry from gross. Then add repressuring, vented and flared gas, nonhydrocarbon removal and extraction loss. Compare the two answers at the source’s precision.
The largest absolute gross-to-dry gap in these 18 annual observations was 8.143 Tcf in 2024. That year had a larger volume gap than 2007 even though dry output made up a higher percentage of gross withdrawals. Report both when the distinction matters.
How do I convert the same volume to a daily rate?
The source uses million cubic feet, abbreviated MMcf. Divide by 1,000 to obtain Bcf, or by 1,000,000 to obtain Tcf. To convert the national 2024 annual dry total of 37,724,931 MMcf to a daily rate, divide it by 1,000 and then by 366. The result is 103.074 Bcf per day.
Use 366 days for calendar 2024 and 365 for 2023. The annual dry total grew by 72,493 MMcf, but the average daily rate fell from 103.157 Bcf per day in 2023. That is why two writers can accurately describe the same series as rising in total and falling per day.
| Same 2024 U.S. dry gas figure | Calculation | Value |
|---|---|---|
| Annual total in source unit | Original published MMcf | 37,724,931 MMcf |
| Annual total in Tcf | MMcf divided by 1,000,000 | 37.724931 Tcf |
| Annual average daily rate | MMcf divided by 366,000 | 103.074 Bcf/day |
Can I convert cubic feet to MMBtu using this table alone?
A cubic foot measures volume and a Btu measures energy. To convert a measured amount, multiply its Mcf by the matching heat content in MMBtu per Mcf. For illustration, 1,000 Mcf at an assumed 1.05 MMBtu per Mcf equals 1,050 MMBtu. That example is a conversion, with no implied heat content for the national data.
Keep the actual heat content and pressure basis with the calculation. EIA’s notes specify a standard pressure and temperature basis for these volume figures. The EIA energy conversion guide links to heat-content series. For a settlement or statement, use the heat content attached to that measurement rather than a generic conversion factor.
What is extraction loss and how does it differ from wasted gas?
The extraction deduction expresses recovered liquids as the gas volume equivalent removed in processing. EIA applies product-specific conversions to reported liquid quantities. Its documentation lists 1.558 Mcf per barrel for ethane and 1.498 for propane. As an illustration using those factors, 1,000 barrels of each would represent 3,056 Mcf combined.
In the 2024 national calculation, 3,658,962 MMcf is the reported extraction loss. The gas equivalent belongs in the subtraction from marketed to dry volume. It should stay separate from venting and flaring. EIA also cautions that extraction loss assigned to a state does not necessarily line up with that state’s production. See the extraction loss calculation notes.
Why can dry production differ from gas supply or consumption?
Dry production measures output from domestic production after extraction. The national gas balance also includes movements across borders, storage activity, other supply items, and measured uses. EIA publishes a balancing item when the reported supply and disposition components do not add up.
Use the Natural Gas Annual supply and disposition tables for a question about apparent consumption or market balance. Use the production bridge above when explaining why the same country reports different gross and dry production figures. Substituting the balancing item into the gross-to-dry bridge would join two different accounting steps.
How do I reproduce the 2024 result and catch a bad comparison?
Filter the data to United States and calendar 2024, keep all fields in MMcf, then subtract 3,855,413, 335,163 and 293,292 from gross withdrawals of 45,867,761. The first result is 41,383,893 MMcf marketed. Subtract the extraction loss of 3,658,962 to obtain 37,724,931 MMcf dry.
For another year or region, check that the source publishes the complete bridge. Read source flags for withheld, unreported and revised values. Preserve a release date when comparing preliminary monthly estimates with revised annual data. A missing component needs its own source before an exact reconciliation can be claimed.
How does the choice of production stage change a state comparison?
EIA’s 2024 annual table reports Alaska at 3.549 Tcf gross, near Louisiana and New Mexico on this selected list. Alaska drops to 0.372 Tcf marketed and 0.351 Tcf dry. Its share of the corresponding national total drops from 7.7% at the gross stage to 0.9% at the marketed stage. Applying the gross share to a story about marketed output would put Alaska in the wrong place.
The table keeps the country, year, and source edition fixed while the production stage changes. It uses state total rows from EIA’s 2024 Natural Gas Annual. It keeps the separately published federal offshore area out of the state rows. The six states are selected examples, so their volumes should be divided by the published national total for a U.S. share.
To report Texas’s contribution to U.S. dry output, divide its 10,054,195 MMcf dry row by the 37,724,931 MMcf U.S. dry row. To describe the share of Texas gross withdrawals represented by dry production, keep the same numerator and use the 12,918,987 MMcf Texas gross row. If a table lists several states, the first ratio can be added across them. The within-state percentages have different denominators and cannot be added.
| State | Gross, Tcf | Marketed, Tcf | Dry, Tcf | Dry as share of gross |
|---|---|---|---|---|
| Alaska | 3.549 | 0.372 | 0.351 | 9.9% |
| Louisiana | 3.617 | 3.614 | 3.598 | 99.5% |
| New Mexico | 3.617 | 3.600 | 3.329 | 92.1% |
| North Dakota | 1.253 | 1.186 | 0.948 | 75.7% |
| Pennsylvania | 7.422 | 7.422 | 7.299 | 98.3% |
| Texas | 12.919 | 12.020 | 10.054 | 77.8% |
Which deductions change the comparison?
In Alaska, the table assigns 3,170,978 MMcf to repressuring, equivalent to 89.3% of its gross row. Louisiana and New Mexico begin within 501 MMcf of one another at the gross stage. Louisiana ends 268,673 MMcf higher at the dry stage. New Mexico’s reported extraction deduction exceeds Louisiana’s by 254,241 MMcf, accounting for most of that dry-output spread in the published arithmetic.
Another comparison starts at marketed gas. The extraction deduction is 20.0% of North Dakota’s marketed production, 16.4% of Texas’s and 1.7% of Pennsylvania’s. These percentages compare what the table allocates to each state. A processing plant can receive gas produced outside its state, so the ratios alone cannot establish the liquids content of wells drilled there.
| State | Marketed, MMcf | Extraction, MMcf | Dry, MMcf | Extraction share of marketed |
|---|---|---|---|---|
| Alaska | 371,876 | 21,043 | 350,833 | 5.66% |
| Louisiana | 3,614,212 | 16,140 | 3,598,072 | 0.45% |
| New Mexico | 3,599,780 | 270,381 | 3,329,399 | 7.51% |
| North Dakota | 1,185,664 | 237,343 | 948,321 | 20.02% |
| Pennsylvania | 7,422,303 | 123,186 | 7,299,117 | 1.66% |
| Texas | 12,019,704 | 1,965,509 | 10,054,195 | 16.35% |
Can I use these state figures for a basin or growth story?
EIA’s separate 2024 regional analysis reported 25.4 Bcf per day of marketed production for the Permian, a region spanning Texas and New Mexico, and 14.6 Bcf per day for the Haynesville, which spans Louisiana and Texas. Those are basin or region estimates at the marketed stage and a daily rate. The state table above gives calendar-year state totals. Even after conversion to the same units, adding two states would include volumes outside the named region.
Quote the stage, geography, period, unit, and source edition together. The extraction table uses three reported fields shared by all six states. The premarket discussion cites individual values where EIA supplies them. Equal gross and marketed totals alone cannot identify the volume of each premarket component. Download the calculations for exact inputs and compute shares before rounding.
How does this compare with other published research?
These sources address related questions using different measures. The table shows how to use them alongside this study.
Publications reviewed for this comparison. U.S. Energy Information Administration. U.S. Energy Information Administration. U.S. Energy Information Administration. Federal Energy Regulatory Commission.
| Publisher | What the publication covers | How AMR extends the comparison |
|---|---|---|
| U.S. Energy Information Administration | State and national gross, marketed and dry volumes and their components, with source flags. | Use the fixed 2024 edition to calculate the Alaska share change and the Louisiana and New Mexico stage spread. |
| U.S. Energy Information Administration | Lists and describes production, processing, storage, movements, and delivery tables. | Identify the matching annual table and keep processing allocations separate from basin origin. |
| U.S. Energy Information Administration | Explains 2024 marketed rates and regional contributions for the Permian, Appalachia and Haynesville. | Add a geography and unit decision for citations using region instead of state boundaries. |
| Federal Energy Regulatory Commission | The 2024 Energy Primer describes the physical separation of liquids and other components from a gas stream. | Pair that explanation with EIA’s named accounting stages and compare exact reported state volumes. |
How did AMR check the calculation?
AMR used the EIA national workbook and selected 18 calendar years with every component published. It reconciled gross to marketed and marketed to dry for every year. The maximum discrepancy was one million cubic feet from source rounding.
The download preserves integer million cubic feet. The article divides by one million to display trillion cubic feet. Calendar 2025 had the top-line volumes but lacked all required components in this edition.
Sources and data
- EIA national gross withdrawals and production workbook, Data 1
- EIA annual U.S. production series and data notes
- EIA production definitions and classification changes
- EIA Natural Gas Annual methods and release context
- EIA Natural Gas Annual, production and supply accounting
- EIA energy conversions and heat content references
- EIA 2024 marketed natural gas production by region
Download the data (CSV) · Read the data dictionary. The AMR analysis and figures are licensed CC BY 4.0. Refer to the original issuers for their materials. Read the calculation data guide.
Calculation data guide
The analysis download gives each calculated measure, evidence period, numeric value, unit, and formula. Follow its source data URL for the input rows and use the period and unit when quoting the result.