Key takeaways
- 2016 was the first year in which EIA’s published shale category exceeded half of U.S. gross natural gas withdrawals in its 2007 to 2024 series. The reported share was 48.1% the previous year and 54.8% in 2016. EIA refined its well classifications in 2018.
- From 2018 through 2024, the EIA’s published U.S. shale gas category grew by 11.132 Tcf while total gross withdrawals grew by 8.542 Tcf. The shale category includes gas from shale and tight oil wells under the refined EIA method. Other categories partly offset its gain.
- U.S. gross withdrawals outside EIA’s published shale category declined by 2.590 Tcf from 2018 to 2024. The calculation subtracts published shale volumes from the national totals in both years.
- The 0.6 Tcf decline in Haynesville/Bossier wet gas offset about 55% of the 1.1 Tcf increase in Wolfcamp and Bone Spring between 2023 and 2024. Both changes are from the same EIA-23L shale-play table. The offset uses the displayed values, each rounded to one decimal place in Tcf.

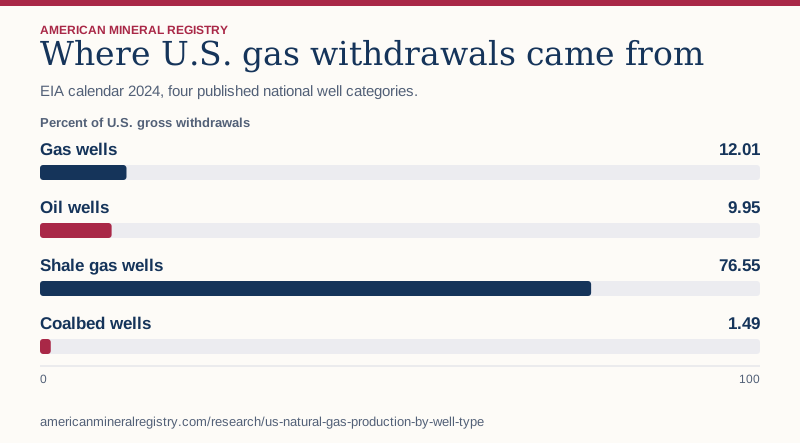
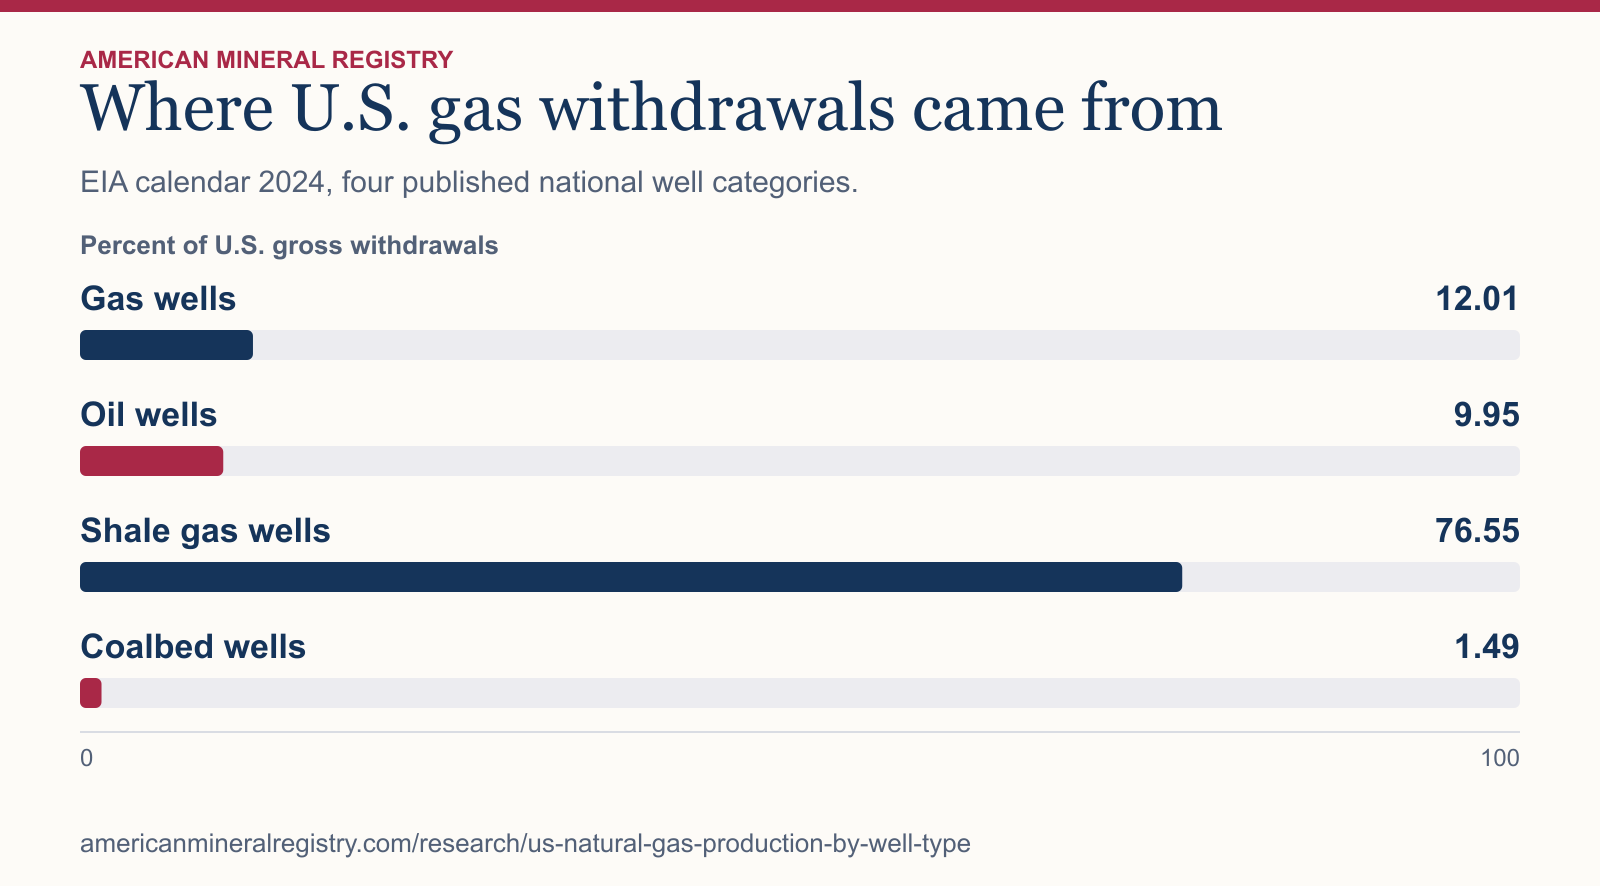
Figure 1 in text
EIA calendar 2024, four published national well categories. Percent of U.S. gross withdrawals.
| Category | Percent of U.S. gross withdrawals |
|---|---|
| Gas wells | 12.01 |
| Oil wells | 9.95 |
| Shale gas wells | 76.55 |
| Coalbed wells | 1.49 |
Chart wording and scale
Where U.S. gas withdrawals came from EIA calendar 2024, four published national well categories.
Percent of U.S. gross withdrawals
Gas wells
12.01
Oil wells
9.95
Shale gas wells
76.55
Coalbed wells
1.49 0 100
Source and data: Download chart source data
Permanent link to this figure’s text and data · Sources and context
What does production by well type tell me?
This study shows what share of gross U.S. natural gas withdrawals EIA assigned to four named well categories. It measures volume. To answer how many wells were operating or how productive a typical well was, use well counts and a production-rate distribution. For electricity generated from gas rather than gas withdrawn at wells, use the state electricity fuel mix comparison.
Start by matching the question to the correct population. A national table is useful for a share of U.S. withdrawals. A basin analysis answers a basin question. A study of wells that primarily produce oil can classify output differently from the national published oil-well row.
| Question | Data to use | Denominator or base |
|---|---|---|
| What share came from the published shale category? | EIA national gross withdrawals by well category | Same-year U.S. gross withdrawals |
| How much gas came from predominantly oil-producing wells? | Associated-gas study with its classification documented | Volume or stated study population |
| How common are low-rate wells? | Well count by production-rate bracket | Included well count |
| How much of the gas became dry production? | Gross-to-dry production bridge | Same-year gross withdrawals |
Are oil versus gas wells and shale versus conventional wells the same distinction?
One distinction describes the balance of gas and oil a well produces. The other describes the formation or well grouping. A well can mainly produce oil and still be associated with a shale or tight formation. EIA’s refined production method accounts for gas from shale and tight oil wells within its published shale category.
Preserve the label that EIA assigns to the data. In the national workbook the column called Gas wells is one component of gross gas withdrawals, alongside the named shale, oil and coalbed components. It should be quoted with that limited meaning. See the EIA category definitions and changes.
What share of U.S. gas came from each well category?
EIA’s national table publishes four separate source categories. The denominator includes all four and uses the published national gross figure.
The oil-well row can answer a question about gas attributed to EIA’s oil-well category. It does not measure what fraction of physical wells produced both commodities.
| EIA category | 2024 trillion cubic feet | Share of national gross |
|---|---|---|
| Gas wells | 5.509 | 12.0% |
| Oil wells | 4.563 | 9.9% |
| Shale gas wells | 35.109 | 76.5% |
| Coalbed wells | 0.686 | 1.5% |
When did shale gas become the majority of withdrawals?
The published shale category crossed 50% in 2016. Its share was 8.1% in 2007. The table shows the published history, which spans changes in how EIA assigns wells to categories.
EIA used state well definitions before 2012, moved to gas-to-oil ratios in 2012, and refined the categories in 2018. From 2018, it includes gas from shale and tight oil wells in the published shale category. The series does not isolate the effect of that classification change from changes in production.
| Year | National gross Tcf | Shale gas share | Oil-well share | Gas-well share |
|---|---|---|---|---|
| 2007 | 24.664 | 8.1% | 23.0% | 60.8% |
| 2010 | 26.816 | 21.7% | 21.8% | 49.4% |
| 2015 | 32.915 | 48.1% | 19.9% | 28.5% |
| 2016 | 32.592 | 54.8% | 19.6% | 22.4% |
| 2020 | 40.730 | 71.0% | 10.7% | 16.3% |
| 2024 | 45.868 | 76.5% | 9.9% | 12.0% |
Can the oil-well series stand in for every estimate of associated gas?
The answer depends on the producer’s definition and denominator. This study reproduces EIA’s named oil-well category. Since 2018, gas from shale and tight oil wells falls under the published shale category. A study counting all gas produced alongside oil can use a different population.
Use the category name with the 2024 percentage. Do not apply the national share to a specific lease or operator.
Why is the denominator gross withdrawals?
The component series measures source volumes at the gross stage. Dividing those volumes by dry production would compare stages and inflate the shares.
The gas production stage study reconciles the difference from gross withdrawals to dry production.
How much did each source contribute to national growth after 2018?
The national total rose by 8.542 Tcf. The published shale category rose by 11.132 Tcf, so its contribution was 130.3% of net national growth. Contributions can exceed 100% when other categories shrink.
The table uses 2018 as the start because it was the first year of the refined classification period described by EIA. These are changes in assigned source volumes, rather than a count of newly drilled wells.
| EIA category | 2018 Tcf | 2024 Tcf | Change, Tcf |
|---|---|---|---|
| Gas wells | 7.864 | 5.509 | -2.355 |
| Oil wells | 4.503 | 4.563 | 0.060 |
| Shale gas wells | 23.977 | 35.109 | 11.132 |
| Coalbed wells | 0.981 | 0.686 | -0.295 |
How much of shale-category growth came from a greater national share?
Apply the 2018 published shale share of 64.24% to 2024 gross withdrawals. The benchmark gives 29.465 Tcf. The observed amount was 35.109 Tcf, with a difference of 5.645 Tcf.
This separates the arithmetic effect of a changing category share from growth in the total volume. It does not attribute the difference to drilling decisions, geology, or any specific basin. Cite it as an AMR calculation using EIA’s published national categories.
Did the oil-well category move the same way in volume and share?
Oil-well gas changed by +1.3% in volume from 2018 through 2024. Its share of national gross withdrawals moved from 12.1% to 9.9%.
The column labeled Oil wells refers to a published classification. A report about gas produced alongside oil may use a broader population because gas from shale and tight oil wells is reported in the shale category.
| Calendar year | Oil-well gas Tcf | Oil-well share | Shale category share |
|---|---|---|---|
| 2018 | 4.503 | 12.1% | 64.24% |
| 2019 | 4.604 | 11.3% | 68.27% |
| 2020 | 4.363 | 10.7% | 70.96% |
| 2022 | 4.524 | 10.4% | 74.32% |
| 2024 | 4.563 | 9.9% | 76.55% |
Which trend comparisons stay within a classification period?
The long table reproduces what EIA published. For changes within a documented method, compare endpoints that stay within the same period. The windows below separate the gas-to-oil-ratio period from the refined categories beginning in 2018.
The historical share crossing 50% is a statement about published observations. A claim about the growth of a physically identical group of wells requires a harmonized well-level dataset.
| EIA method window | Calendar period | Opening shale share | Closing shale share | Change, percentage points |
|---|---|---|---|---|
| Gas-to-oil-ratio method | 2012 to 2017 | 35.65% | 59.86% | +24.20 |
| Refined well categories | 2018 to 2024 | 64.24% | 76.55% | +12.31 |
Why use national gross as the denominator instead of adding the four rows?
EIA publishes the national total separately. The four components can differ from it by one million cubic feet in a year because of rounding. Using the published total keeps every share aligned with the same number that a reader can check in the source.
In 2024, subtracting the published shale category from the national total leaves 10.758 Tcf outside it. That residual groups the other published categories for arithmetic comparison. It is broader than the category labeled Gas wells.
Why can the oil-well row and associated-gas estimates differ?
The published national oil-well row for 2023 is 4,518,632 MMcf, or 12.38 Bcf per day. In a separate analysis of gas from predominantly oil-producing wells, EIA reported 17.1 Bcf per day of associated gas for 2023. Converting both to daily volumes leaves a difference because the reporting categories and methods differ.
Keep the measures separate. The national row is one bin within the four-category workbook, and the other analysis uses Enverus data and its own gas-to-oil classification. The figures do not provide a bridge that would identify the difference by well or formation. See the EIA 2023 associated-gas analysis.
| 2023 evidence | Value | What it measures |
|---|---|---|
| EIA published oil-well row | 12.38 Bcf/day | Published national gross withdrawal category |
| EIA associated-gas analysis | 17.1 Bcf/day | Gas from predominantly oil-producing wells in the separate analysis |
| EIA Permian associated gas estimate | 11.5 Bcf/day | Permian portion in the separate analysis |
How does gas-to-oil ratio classify a well?
In the associated-gas analysis, EIA uses gas volume divided by oil barrels. Its threshold is 6.0 Mcf per barrel. A well at or below that threshold is classified as an oil well in that analysis. Above it, EIA classifies the well as a gas well.
For illustration, 3,000 Mcf divided by 600 barrels is 5 Mcf per barrel. That falls on the oil-well side even though the well produced measurable gas. The worked example applies only the reported ratio rule. The refined national reporting categories also account for the formation. See the EIA Permian method and example.
When can I compare two regions or data releases?
Match the basin boundaries, the period and the volume definition. A basin can cross states. A play can cover only part of a basin. A seven-month average and a full-year average have different windows even if they carry the same year in a chart title.
The EIA Permian study compares the Wolfcamp, Spraberry and Bone Spring plays across a defined observation window. The separate 2023 associated-gas study describes a regional estimate for the full year. Preserve the geography and period of whichever source you cite. For a same-basis comparison, use the values within one release or show a documented bridge.
How do I reproduce a share and spot a denominator error?
Using the 2023 oil-well row, divide 4,518,632 MMcf by 45,399,670 MMcf of national gross withdrawals. Multiply by 100 to get 10.0%. Both figures come from the same calendar year and workbook.
If the result looks high, check whether the denominator was dry gas or a selected basin. If a percentage looks like a count of wells, check the numerator. This study divides a volume by a volume. For a historical comparison, keep the published method changes in view and avoid describing a category trend as the production history of an unchanged set of wells.
What should a complete quote include?
For the example above, write that EIA’s oil-well category represented 10.0% of 2023 U.S. gross natural gas withdrawals. Include the date, country, stage and category. To write about associated gas using the separate EIA analysis, use its own definition and quoted volume.
For a chart, label the denominator directly and keep the footnote about the 2018 refinement with the time series. For a question about the production mix in a specific lease or well, use records for that well and the reporting authority’s applicable definition. A national share is useful context for the category, rather than a measurement of an individual property.
How concentrated is gross withdrawal volume in the published shale category?
The national gross withdrawal table assigns 27.956 Tcf of shale-category gas to the five named states. Dividing by the same table’s 35.109 Tcf national shale-category total gives 79.6%. These volumes quantify a selected group’s contribution to the category. The selection illustrates geographic concentration among states with large reported volumes.
The last two columns answer different questions. A state can have a high share of its own gross withdrawals in the shale category while making a smaller contribution to the country’s shale-category total. A state total also crosses basins and plays. Keep the federal offshore reporting row separate when comparing state figures.
| State | Shale-category gross, Tcf | All state gross, Tcf | Shale share of state gross | State share of U.S. shale category |
|---|---|---|---|---|
| Texas | 11.163 | 12.919 | 86.4% | 31.8% |
| Pennsylvania | 7.194 | 7.422 | 96.9% | 20.5% |
| West Virginia | 3.327 | 3.418 | 97.3% | 9.5% |
| Louisiana | 3.233 | 3.617 | 89.4% | 9.2% |
| New Mexico | 3.039 | 3.617 | 84.0% | 8.7% |
What does the separate shale-play survey show?
The EIA-23L reserves survey estimates wet gas production after lease separation by shale play. Its Marcellus, Wolfcamp and Bone Spring, and Haynesville/Bossier groups sum to 23.7 Tcf, or 72.0% of the survey table’s 2024 national shale-play estimate. The table groups Wolfcamp and Bone Spring and reports the pair in New Mexico and Texas. It does not publish a split between those formations in this row.
Within the survey table, the 0.6 Tcf Haynesville/Bossier decrease offset about 55% of the 1.1 Tcf increase for Wolfcamp and Bone Spring. These are changes in estimated wet production between the reported years. EIA’s production estimates include reported and imputed data, and rounding limits the precision of the offset.
| Selected play or group | 2023 wet gas, Tcf | 2024 wet gas, Tcf | Change, Tcf |
|---|---|---|---|
| Marcellus | 10.5 | 10.6 | +0.1 |
| Wolfcamp and Bone Spring | 7.1 | 8.2 | +1.1 |
| Haynesville/Bossier | 5.5 | 4.9 | -0.6 |
| Eagle Ford | 2.6 | 2.6 | +0.0 |
| Utica/Pt. Pleasant | 2.2 | 2.1 | -0.1 |
| U.S. shale-play estimate | 32.2 | 32.9 | +0.7 |
Why does EIA publish more than one U.S. shale volume?
For 2024, the Natural Gas Annual gross shale category gives 35.109 Tcf. The separate EIA-23L survey gives 32.9 Tcf of wet gas after lease separation from shale plays. The first is the gross withdrawal category within the national production accounts. The second organizes an estimated series by shale play and comes from the reserves reporting program. Its production estimates serve as a trend indicator.
The production accounts also put gas from shale and tight oil wells into the published shale category. A change in that category therefore tracks the volume EIA assigned under its method. The two national values do not supply a conversion from gross to wet gas or a way to identify the same wells in both datasets.
If the question concerns the number of wells or their production rate, use EIA’s Distribution of U.S. Oil and Natural Gas Wells by Production Rate. It bins producing wells by rate and includes an orientation breakdown. A production-volume share can change even if the number of wells in a comparable group moves in the opposite direction. The two tables on this page use volumes throughout.
How does this compare with other published research?
These sources address related questions using different measures. The table shows how to use them alongside this study.
Publications reviewed for this comparison. U.S. Energy Information Administration. U.S. Energy Information Administration. U.S. Energy Information Administration. U.S. Energy Information Administration. U.S. Geological Survey.
| Publisher | What the publication covers | How AMR extends the comparison |
|---|---|---|
| U.S. Energy Information Administration | Gross withdrawals by published well category, state and national total in the same table. | Calculate within-state and national-denominator shares separately for a fixed year. |
| U.S. Energy Information Administration | Year-end 2024 reserves release links to the production and reserves table by shale play. | Inspect Table 4 separately, use its production columns and compute concentration and offset inside that survey. |
| U.S. Energy Information Administration | Estimated wet gas production and proved reserves from named shale plays and the U.S. survey total. | Show both national values with their own unit, stage and source. Keep numeric calculations inside each dataset. |
| U.S. Energy Information Administration | Counts and rate distributions for oil and gas producing wells, including an orientation series. | Route count questions to the rate report without inferring a well count from output shares. |
| U.S. Geological Survey | Estimates undiscovered, technically recoverable gas in the Marcellus and Point Pleasant–Utica formations. | Keep a geology-based resource estimate separate from annual reported EIA well-category or play volumes. |
How did AMR select and validate the series?
AMR kept the full 2007 through 2024 span in which EIA supplied the four named series and the national total in the same workbook. The component sum matched gross withdrawals to within one million cubic feet in every included year. Shares were calculated before rounding.
The workbook includes 2025 national gross withdrawals but omits source-category values for that year in this release. The comparison ends at the last complete year.
Sources and data
- EIA national gross withdrawals and production workbook, Data 1
- EIA annual U.S. production series and data notes
- EIA production definitions and classification changes
- EIA Natural Gas Annual methods and release context
- EIA full-year 2023 associated gas estimate and method
- EIA Permian associated gas and gas-to-oil ratio example
- EIA Natural Gas Annual 2024, Table 3 and Appendix A
- EIA year-end 2024 reserves report, Table 4, wet gas production by shale play
- EIA distribution of U.S. producing wells by production rate
Download the data (CSV) · Read the data dictionary. The AMR analysis and figures are licensed CC BY 4.0. Refer to the original issuers for their materials. Read the calculation data guide.
Calculation data guide
The analysis download gives each calculated measure, evidence period, numeric value, unit, and formula. Follow its source data URL for the input rows and use the period and unit when quoting the result.