Key takeaways
- EIA published a gravity classification for 99.9% of reported Lower 48 crude and lease condensate in calendar 2023, using the complement of its unclassified volume. The above-40 and at-or-below-30 statistics keep the unclassified volume in their common denominator.
- The Lower 48 produced about 208.13 million more barrels above 40 degrees API in 2023 than would be implied by its 2015 gravity mix at the 2023 production total. AMR uses the unrounded day-weighted EIA shares and includes unclassified volume in the denominator.
- The 40.1 to 45.0 degree API band represented 30.1% of all reported Lower 48 crude oil and lease condensate in 2023. The band accounted for 54.0% of the combined volume above 40 degrees API.
- In 2023, 66.69% of U.S. crude oil imports were 30° API or lower, compared with 9.55% of Lower 48 crude oil and lease condensate production. AMR matched the full calendar year and the same three published API bands. The two percentages use their own EIA populations.
- Across four matched calendar years from 2020 through 2023, the Lower 48 production share above 40° API exceeded the U.S. import share by at least 52.6 percentage points each year. In 2023 the two shares were 55.72% and 3.11%, respectively. Production is day weighted and imported shares come from EIA’s annual percentages.

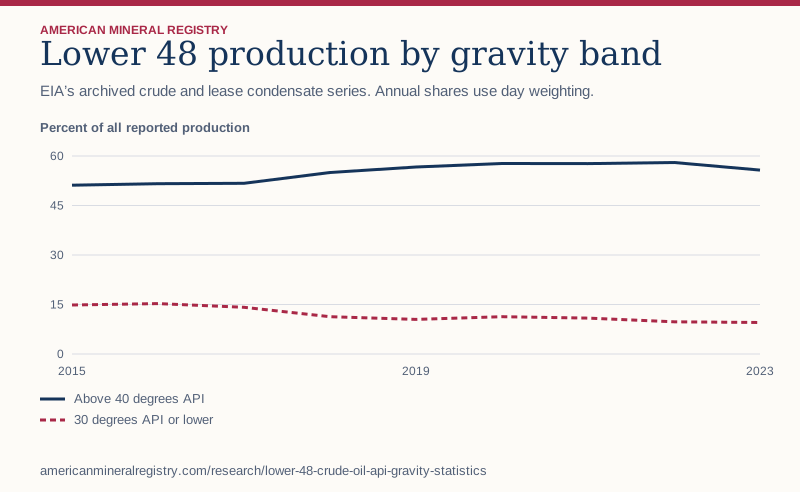
Figure 1 in text
EIA’s archived crude and lease condensate series. Annual shares use day weighting. Percent of all reported production.
| Calendar year | Above 40 degrees API | 30 degrees API or lower |
|---|---|---|
| 2015 | 51.16 | 14.86 |
| 2016 | 51.61 | 15.27 |
| 2017 | 51.74 | 14.14 |
| 2018 | 55.01 | 11.31 |
| 2019 | 56.66 | 10.49 |
| 2020 | 57.71 | 11.31 |
| 2021 | 57.69 | 10.88 |
| 2022 | 58.03 | 9.75 |
| 2023 | 55.72 | 9.55 |
Chart wording and scale
Lower 48 production by gravity band EIA’s archived crude and lease condensate series. Annual shares use day weighting.
Percent of all reported production 0 15 30 45 60 2015 2019 2023 Above 40 degrees API 30 degrees API or lower
Source and data: Download chart source data
Permanent link to this figure’s text and data · Sources and context
Which API gravity measure answers my question?
Use a measured API gravity for the density of a particular crude sample. Use the share of production in named API bands for the mix of a region. An average API gravity can summarize a refinery’s crude inputs, but it cannot tell you how much was above a specific cutoff. This study measures the Lower 48 production mix and includes lease condensate.
Start by identifying the stream. A refinery’s inputs can include domestically produced and imported crude, so an input average and a production distribution describe different populations. EIA’s comparison of domestic production, imports and refinery inputs shows how to keep the three separate.
How do specific gravity, degrees API and sulfur fit together?
Divide 141.5 by specific gravity measured on the 60°F/60°F reference basis, then subtract 131.5. Higher API means lower density. For illustration, a specific gravity of 0.850 gives about 35.0° API and 0.950 gives about 17.4° API. These are hypothetical samples, calculated with the EIA production table formula.
Sweet and sour describe lower and higher sulfur content, respectively. They are a separate measurement from API gravity. A density reading alone cannot establish sulfur content. If a specification uses a sulfur cutoff, keep its stated threshold and unit with the comparison. See EIA’s explanation of density and sulfur in crude grades.
How did the Lower 48 crude gravity mix change?
The share reported above 40 degrees API increased by 4.6 percentage points from 2015 to 2023. The lower-gravity share moved in the opposite direction over the same endpoints.
The two bands do not add to 100% because the middle band and published unclassified volume also contribute to total production.
| Calendar year | At or below 30° API | Above 40° API | Reported unclassified volume share |
|---|---|---|---|
| 2015 | 14.9% | 51.2% | 1.1% |
| 2016 | 15.3% | 51.6% | 0.5% |
| 2017 | 14.1% | 51.7% | 0.2% |
| 2018 | 11.3% | 55.0% | 0.3% |
| 2019 | 10.5% | 56.7% | 0.1% |
| 2020 | 11.3% | 57.7% | 0.1% |
| 2021 | 10.9% | 57.7% | 0.1% |
| 2022 | 9.8% | 58.0% | 0.3% |
| 2023 | 9.6% | 55.7% | 0.1% |
What does a higher API gravity mean?
A higher API gravity indicates a less dense petroleum liquid. The thresholds here are fixed at EIA’s published bin boundaries so the same calculation can be repeated from the workbook.
Density and sulfur content are different characteristics. The data can support a gravity comparison and does not establish the sulfur content, grade price or quality deduction of an individual delivery.
Why weight the monthly rates by days?
EIA reports average daily volumes for each month. AMR multiplies every published rate by that month’s day count to derive a volume, then sums the 12 volumes. This gives February and a 31-day month their appropriate weights.
The monthly rates are already rounded to thousand barrels per day. The workbook’s published total is the denominator, and its rounding can make the sum of bands differ slightly.
How does unclassified production enter the result?
The volume without a published gravity classification was 0.1% of all reported production in 2023. It remains in the denominator and is assigned to neither selected band.
This makes the reported shares directly reproducible without imputing a gravity band. The CSV supplies every band and the coverage column for all 108 months.
Did the highest share and the highest volume occur in the same year?
The above-40-degree share was highest in 2022, at 58.03%. Absolute production in those bands was highest in 2023. A category can gain barrels while losing share if the total grows faster.
Use annual volumes when comparing the amount of crude and condensate. Use percentages when comparing the composition of the stream. Both are calculated from the same month-weighted EIA data.
| Calendar year | All volume, million bbl | Above 40°, million bbl | Above 40° share |
|---|---|---|---|
| 2015 | 3,266.44 | 1,671.26 | 51.16% |
| 2019 | 4,324.64 | 2,450.27 | 56.66% |
| 2021 | 3,967.85 | 2,289.25 | 57.69% |
| 2022 | 4,217.49 | 2,447.24 | 58.03% |
| 2023 | 4,565.16 | 2,543.88 | 55.72% |
Which ranges account for the volume above 40 degrees?
The largest of the four above-40 bands in 2023 was 40.1 to 45.0 degrees API. It accounted for 54.0% of that group. The two bands above 50 degrees together accounted for 14.2%.
A quote about all production above 40 degrees includes the volume in four published ranges. A quote about a single commercial grade should use a source that identifies that grade.
| Gravity band | 2023 million bbl | Share of all reported volume | Share of above 40° volume |
|---|---|---|---|
| 40.1 to 45.0° | 1,374.86 | 30.1% | 54.0% |
| 45.1 to 50.0° | 808.27 | 17.7% | 31.8% |
| 50.1 to 55.0° | 235.12 | 5.2% | 9.2% |
| 55.1° and higher | 125.63 | 2.8% | 4.9% |
How much does the unclassified volume affect the calculated share?
The above-40 share using all reported 2023 output was 55.724%. Dividing by the total less published unclassified volume gives 55.760%. Both start with the same numerator.
The first calculation answers what fraction of all reported volume was in the specified bands. The second describes only the classified portion, calculated as the complement of reported unclassified volume. It leaves the unclassified barrels unassigned.
| 2023 denominator | Volume, million bbl | Above 40° share |
|---|---|---|
| All reported | 4,565.16 | 55.724% |
| Total less unclassified | 4,562.16 | 55.760% |
How much of the 2023 high-gravity volume reflects a different mix?
Apply the 2015 above-40 share to the 2023 total. It gives 2,335.75 million barrels. The observed above-40 bands totaled 2,543.88 million barrels. The difference of 208.13 million barrels measures the arithmetic impact of using the 2023 mix.
The comparison holds total volume constant in 2023. It does not isolate production technology, changing geography, grade prices or refinery demand.
Can the rounded API bands reproduce every barrel of the total?
The reported 2023 middle bands above 30 through 40 degrees API account for 34.7% of the total. The low, middle, high and unclassified groups together may differ slightly from the published total because the source rates are rounded independently.
For reproducible annual shares, multiply each month’s rates by the same calendar day count, then add across the year. Dividing a single month by annual volume would mix reporting periods. Use the published total column rather than forcing a residual into any grade.
Which cutoff should I use when a source says light or heavy crude?
Use the numeric boundary defined in the table or article you are citing. AMR groups reported Lower 48 production at 30° and below and above 40°. EIA’s refinery quality definitions describe light crudes as generally above 38° and heavy crudes as commonly 22° or below. The EIA comparison of U.S. supply in early 2022 used production above 45° for its light example. Each threshold serves a different comparison.
A band from 35.1° through 40.0° straddles 38°. The archived grouped volumes cannot tell you which fraction of that band was above 38°. To reproduce a cutoff that splits a band, use underlying observations with adequate resolution. See the EIA refinery quality definitions and EIA production and import example.
| Source or use | Gravity boundary or metric | Can this archive reproduce it? |
|---|---|---|
| AMR Lower 48 low gravity group | 30.0° and below | Yes, sum three published bands |
| AMR Lower 48 high gravity group | Above 40.0° | Yes, sum four published bands |
| EIA first-half 2022 production example | Above 45.0° | The archive supports the cutoff, but match the period and geography separately |
| EIA refinery quality conventions | Generally above 38° for light and 22° or below for heavy | No, both boundaries split a production band |
| Sulfur classification | Sweet or sour | No, these columns report API gravity |
What does the gravity mix tell a refinery reader?
A domestic production mix and a refinery’s input mix can diverge because refiners buy a blend of grades suited to their facilities and products. For the first half of 2022, EIA reported about 3.1 million barrels per day of Lower 48 production above 45° API, about 28% of its production, and separately reported a 33.0° average for crude inputs at U.S. refineries. Those statistics describe a category share and an input average. See EIA’s first-half 2022 analysis.
Grade pricing and processing also depend on sulfur and refinery configuration. A higher share above 40° describes the production mix, with no implied purchase price, product yield, pipeline specification or lease-level grade. For a particular stream, the relevant evidence is its measured quality and the refinery or pipeline specification. See EIA’s explanation of crude characteristics and processing.
How do I reproduce a month from the published rates?
In December 2023, the four above-40° bands add to 7,305 thousand barrels per day. The published all-gravity rate is 12,874 thousand barrels per day. Over 31 calendar days those correspond to 226,455 thousand barrels and 399,094 thousand barrels. Dividing either pair gives about 56.74% above 40° for the month. The denominator includes 31 thousand barrels per day recorded as unclassified.
For an annual share, repeat the volume calculation by month, sum the numerator volumes and denominator volumes separately, then divide. The same-month day count cancels in a monthly share, but day counts and total production vary across months, so an average of monthly shares answers a different question. Use December 2023 in the EIA monthly production table for the inputs.
Where do I find the fields and check rounding?
Open the archived monthly Lower 48 table or its spreadsheet, then match the calendar month and read the all-gravities total and band headings. The study CSV preserves the published rates and names the two calculated band sums. The table notes explain the published rate unit and that zero can represent a rate below 0.5 thousand barrels per day.
Keep a raw sample’s precision when applying a grade specification. A sample at 40.04° is above 40° before rounding, but displays as 40.0° when rounded to one decimal. For the historical dataset, use the published bins as provided and leave any gap from independently rounded rates visible. The public table has no individual gravity observations to reclassify.
| Lookup | Published EIA input or calendar field | Study CSV or operation |
|---|---|---|
| Month and day count | Monthly observation and calendar | calendar_month, days_in_month |
| All production | Lower 48, all API gravities | all_gravities_kbd |
| 30° and below | 20.0 or less, 20.1 to 25.0, 25.1 to 30.0 | Sum the three rates into api_30_or_below_kbd |
| Above 40° | 40.1 to 45.0, 45.1 to 50.0, 50.1 to 55.0, 55.1 and above | Sum the four rates into api_above_40_kbd |
| Unclassified | Lower 48, unclassified | api_unclassified_kbd, retained in the published all-gravity denominator |
| Annual share | All 12 monthly rates and calendar day counts | Sum each rate × days, then divide group volume by total volume |
How much larger was the low-gravity share of imports?
Between 2020 and 2023, the share at or below 30° API was at least 53.5 percentage points higher among U.S. crude imports than in Lower 48 crude oil and lease condensate production. This is a comparison of the composition of two streams over the same calendar years. Their geographic and commodity populations still differ. The import denominator covers U.S. imports. The production denominator covers the Lower 48 and includes lease condensate.
Both EIA tables publish separate bands for 20.0° or below, 20.1° to 25.0° and 25.1° to 30.0°. Sum them on each side. EIA has already calculated the percentages in the annual imported-crude table. For the Lower 48 production archive, multiply each monthly rate by its calendar days, sum annual barrel volumes and divide the low-gravity sum by all production.
The difference between the streams can stay similar even when both mixes change. The low-gravity import share went from 69.14% in 2020 to 66.69% in 2023, while the production share went from 11.31% to 9.55%. Within 2023 imports, the 20.1° to 25.0° band alone represented 46.24% of all crude imports, or 69.3% of the import group at or below 30°. That narrower measure helps distinguish an overall low-gravity share from its internal mix.
| Calendar year | Imports ≤30° | Production ≤30° | Import minus production, points |
|---|---|---|---|
| 2020 | 69.14% | 11.31% | 57.83 |
| 2021 | 64.42% | 10.88% | 53.54 |
| 2022 | 66.86% | 9.75% | 57.11 |
| 2023 | 66.69% | 9.55% | 57.14 |
What does the same comparison show above 40° API?
The direction reverses at the other end of the published mix. In 2023, production above 40° made up 55.72% of the Lower 48 total, while those grades made up 3.11% of U.S. imports. The two tables split the highest readings differently, but the grouped cutoff is compatible. Add the import bands 40.1° to 45.0° and 45.1° and above. On the production side, add the four published groups beginning at 40.1°.
EIA’s first-half 2022 analysis used a mix of specific density cutoffs and a shorter period to explain how crude imports and domestic production differed. The full-year matched comparison here allows a reader to see whether the gap persisted across the four years without treating a first-half percentage as a calendar-year result.
| Calendar year | Production >40° | Imports >40° | Production minus imports, points |
|---|---|---|---|
| 2020 | 57.71% | 2.79% | 54.92 |
| 2021 | 57.69% | 2.61% | 55.08 |
| 2022 | 58.03% | 2.84% | 55.19 |
| 2023 | 55.72% | 3.11% | 52.61 |
What can a refinery or supply analyst conclude from the gap?
The matched bands show the contrast in density mix. A refinery receives selected grades from both streams, so neither share is the share of refinery input. The EIA explanation of crude quality describes how sulfur and density both affect processing. Evaluating a refinery’s feedstock requires measured refinery receipts or inputs. Estimating what portion of U.S. processing could use domestic supply would also require shipment, grade and facility information.
Use the import percentages as published. The import survey notes identify EIA-856 as their source. Keep the all-gravities production denominator, which includes unclassified production, and never allocate rounded residuals to a density band. The data compare shares, so a 50-point gap is an absolute difference between shares. It cannot be multiplied by total refinery runs to estimate a volume of crude needing replacement.
How does this compare with other published research?
These sources address related questions using different measures. The table shows how to use them alongside this study.
Publications reviewed for this comparison. EIA. EIA. EIA. Dallas Fed Economics.
| Publisher | What the publication covers | How AMR extends the comparison |
|---|---|---|
| EIA | Annual import shares by API band. | Use common thresholds and align complete calendar years. |
| EIA | First-half 2022 density mix and refinery context. | Keep the article as context and calculate annual shares independently. |
| EIA | Two quality dimensions, market grades and refining implications. | Keep density separate from sulfur and prices. |
| Dallas Fed Economics | The authors use refinery configuration and the lighter export and heavier import mix to discuss a crude export ban. | Match the API cutoffs in published production and import series for four calendar years, with separate denominators. |
Which years and liquids are comparable?
The comparison uses nine full calendar years in EIA’s archived workbook and keeps January and February 2024 outside the annual series. Use the dates when citing the shares.
This federal series combines crude oil and lease condensate. The Texas production comparison shows how a regulator that reports those liquids separately answers a different question.
Sources and data
- EIA crude oil and lease condensate by API gravity, workbook Data 1
- EIA archived table and headings
- EIA API gravity and production definitions
- EIA refinery crude quality definitions and indicative gravity thresholds
- EIA explanation of crude density, sulfur and processing
- EIA first-half 2022 comparison of production, imports and refinery inputs
- EIA annual imported crude oil percentages by API gravity
- EIA imported crude percentages definitions and EIA-856 source
Download the data (CSV) · Read the data dictionary. The AMR analysis and figures are licensed CC BY 4.0. Refer to the original issuers for their materials. Read the calculation data guide.
Calculation data guide
The analysis download gives each calculated measure, evidence period, numeric value, unit, and formula. Follow its source data URL for the input rows and use the period and unit when quoting the result.