Key takeaways
- Three counties ranked in both the crude oil and condensate top tens in each of the two preliminary July Texas releases. The overlapping counties were Karnes, Loving and Reeves in both July 2025 and July 2026. Each ranking covers 254 counties.
- The July 2026 preliminary Texas county tables sum to 121,422,846 barrels of crude oil and 25,942,866 barrels of condensate. AMR summed each of the two separate RRC columns across all 254 county rows.
- Culberson County reported 3,044,066 barrels of condensate and 30,003 barrels of crude oil in the preliminary July 2026 Texas tables. Culberson ranked third for condensate. The two numbers refer to separate products.

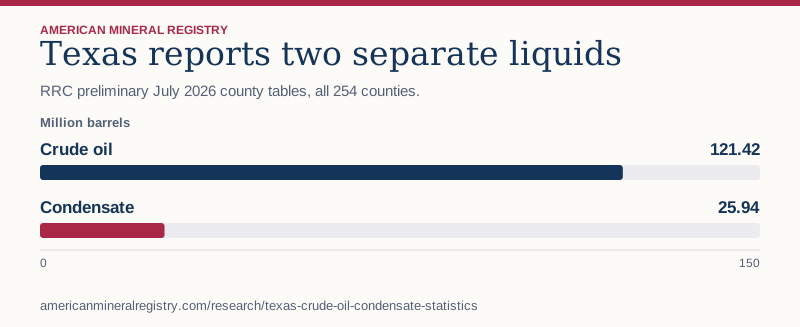
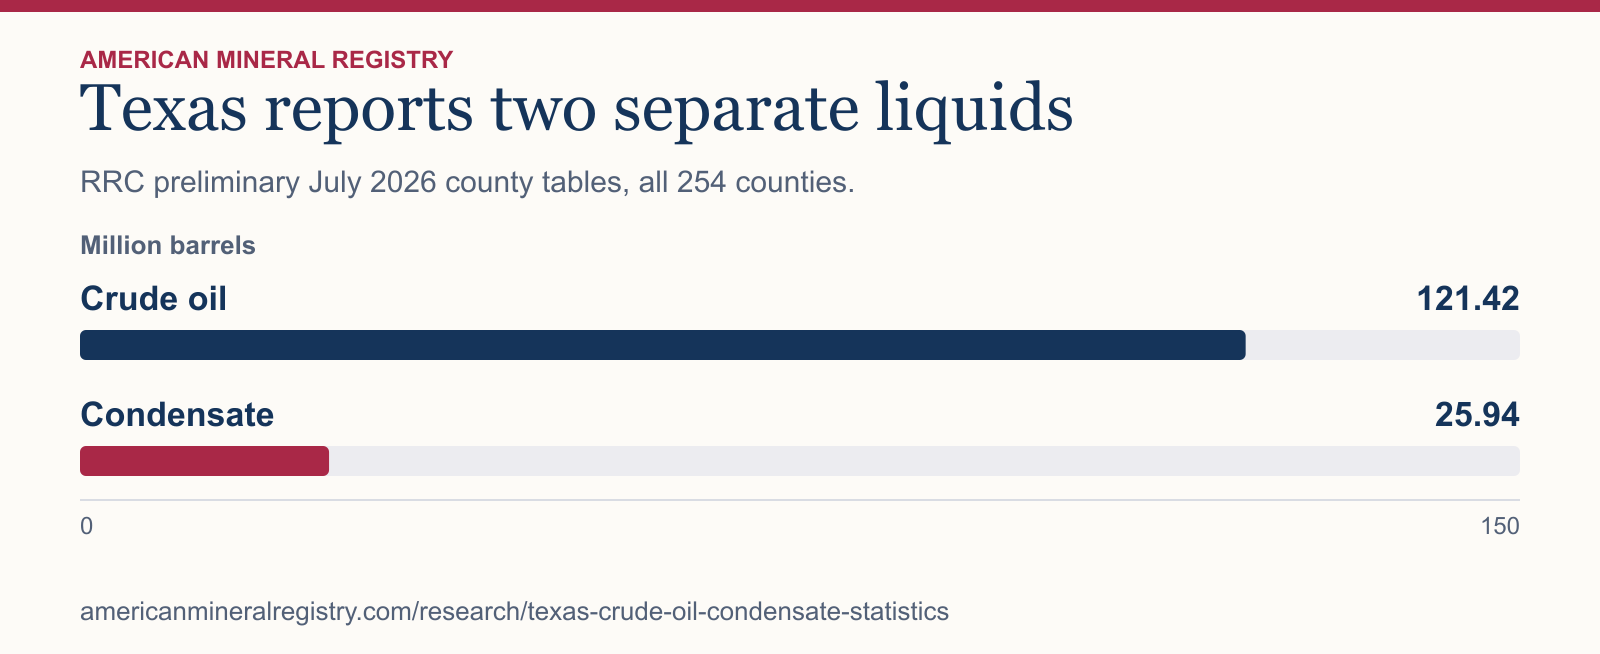
Figure 1 in text
RRC preliminary July 2026 county tables, all 254 counties. Million barrels.
| Category | Million barrels |
|---|---|
| Crude oil | 121.42 |
| Condensate | 25.94 |
Chart wording and scale
Texas reports two separate liquids RRC preliminary July 2026 county tables, all 254 counties.
Million barrels
Crude oil
121.42
Condensate
25.94 0 150
Source and data: Download chart source data
Permanent link to this figure’s text and data · Sources and context
How do the two statewide production columns compare?
The Railroad Commission of Texas reports both products in barrels in its preliminary July tables. AMR summed and ranked them separately.
| Preliminary month | Crude oil barrels | Condensate barrels | Counties in both top tens |
|---|---|---|---|
| July 2025 | 126,697,500 | 23,665,826 | 3 |
| July 2026 | 121,422,846 | 25,942,866 | 3 |
Which counties led Texas condensate production?
Reeves, Loving and Culberson led both preliminary July condensate rankings. Their order differs from the crude oil ranking.
| County | July 2025 condensate barrels | July 2026 condensate barrels | July 2026 crude barrels |
|---|---|---|---|
| Reeves | 6,677,141 | 7,775,588 | 5,346,978 |
| Loving | 4,797,196 | 5,020,907 | 8,079,760 |
| Culberson | 3,460,252 | 3,044,066 | 30,003 |
Why does the product label matter?
The RRC's headline crude oil series covers production from oil leases and reports condensate separately. A county's crude rank can therefore answer a different question from its condensate rank. Preserve the product label when quoting either number or comparing it with another agency's series.
How did AMR verify both columns?
AMR compared the oil-ranked and gas-ranked versions of both RRC county tables. Each month contains 254 matching rows. The crude totals match the corresponding RRC releases, and the condensate leaders match the separate condensate rankings. These are preliminary releases subject to revision.
Sources and data
- RRC July 2025 oil-ranked county table
- RRC July 2025 gas-ranked county table
- RRC July 2025 production release
- RRC July 2026 oil-ranked county table
- RRC July 2026 gas-ranked county table
- RRC July 2026 production release
Download the data (CSV) · Read the data dictionary. The AMR analysis and figures are licensed CC BY 4.0. Refer to the original issuers for their materials.