Key takeaways
- Wyoming and North Dakota were the next two source states for federal onshore oil and gas royalty collections in FY 2026. The two states are ranked by their ONRR receipts within the same federal, onshore, oil and gas, royalties-only filter.
- New Mexico’s share of the same federal onshore royalty series was 75.7% in FY 2024 and 78.0% in FY 2025. The state share divides New Mexico receipts by that fiscal year’s all-state federal onshore royalty total.

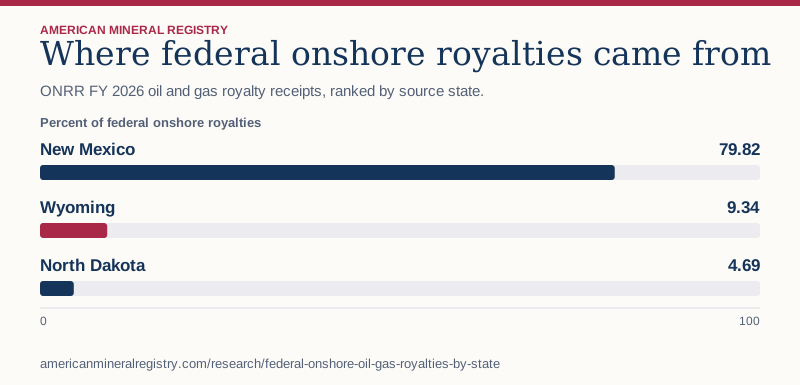
Figure 1 in text
ONRR FY 2026 oil and gas royalty receipts, ranked by source state. Percent of federal onshore royalties.
| Category | Percent of federal onshore royalties |
|---|---|
| New Mexico | 79.82 |
| Wyoming | 9.34 |
| North Dakota | 4.69 |
Chart wording and scale
Where federal onshore royalties came from ONRR FY 2026 oil and gas royalty receipts, ranked by source state.
Percent of federal onshore royalties
New Mexico
79.82
Wyoming
9.34
North Dakota
4.69 0 100
Source and data: Download chart source data
Permanent link to this figure’s text and data · Sources and context
Which states account for federal onshore oil and gas receipts?
The table follows the five highest-receipt source states in FY 2026 across all three fiscal years. All other source states are grouped separately.
| Source location | FY 2024 | FY 2025 | FY 2026 |
|---|---|---|---|
| New Mexico | $5,558.07 million | $5,637.26 million | $6,449.17 million |
| Wyoming | $781.40 million | $751.37 million | $754.26 million |
| North Dakota | $452.50 million | $331.44 million | $379.04 million |
| Colorado | $183.01 million | $185.57 million | $164.98 million |
| Utah | $138.54 million | $119.43 million | $132.53 million |
| Other source states | $224.52 million | $200.63 million | $199.35 million |
How concentrated are federal onshore receipts?
New Mexico is the leading source state in the three periods shown. Its percentage uses each year's own federal onshore royalty total. The dataset lists every named state with reported receipts in each selected year. A state without a source row is outside that year's table.
Does the state receive the amount collected in its borders?
This study measures collection by source state. The federal disbursement study measures payments by recipient fund. The source-state figure alone cannot establish how much money a state government received.
How did AMR reconcile the state figures?
AMR grouped signed ONRR revenue entries by state using the Federal, Onshore, Oil & Gas and Royalties classifications. All selected input rows had a named state. The state totals reconcile to the published federal onshore series for each selected year. Private, state-owned, tribal, and offshore production are outside the comparison.
Sources and data
Download the data (CSV) · Read the data dictionary. The AMR analysis and figures are licensed CC BY 4.0. Refer to the original issuers for their materials.