This reference follows the survey from its national definition through income, tenure, geography, housing conditions and uncertainty. It supplies complete calculations for 49 selected national and subgroup rows, all six hardship measures in those rows, original source cells, relative standard errors and reusable downloads. The observations belong to the 2024 survey edition, published as preliminary household characteristics in March 2026, rather than a measurement of current winter bills.
Key Takeaways
- 43.56 million U.S. households reported at least one measured energy insecurity issue in RECS 2024. (EIA, RECS 2024 Table HC 11.1, Mar 2026).
- 32.87% is AMR’s calculated national rate from the published rounded household counts. (EIA, RECS 2024 Table HC 11.1, Mar 2026).
- 32.89 million households reduced or forwent food or medicine to pay energy costs. (EIA, RECS 2024 Table HC 11.1, Mar 2026).
- 17.55 million households reported leaving their home at an unhealthy temperature. (EIA, RECS 2024 Table HC 11.1, Mar 2026).
- 16.19 million households received a disconnect or delivery stop notice. (EIA, RECS 2024 Table HC 11.1, Mar 2026).
- 6.83 million households could not use main heating equipment for a measured affordability related reason. (EIA, RECS 2024 Table HC 11.1, Mar 2026).
- 8.16 million households could not use air conditioning for a measured affordability related reason. (EIA, RECS 2024 Table HC 11.1, Mar 2026).
- 63.72% of households below $10,000 income reported a measured insecurity issue. (EIA, RECS 2024 Table HC 11.1, Mar 2026).
- 7.47% of households at $200,000 or above reported a measured insecurity issue. (EIA, RECS 2024 Table HC 11.1, Mar 2026).
- Renters’ estimated insecurity rate was 47.79%, compared with 25.70% for owners. (EIA, RECS 2024 Table HC 11.1, Mar 2026).
- The South contained 18.25 million of the nationally estimated 43.56 million insecure households. (EIA, RECS 2024 Table HC 11.1, Mar 2026).
- Mobile home households had a 51.36% estimated energy insecurity rate. (EIA, RECS 2024 Table HC 11.1, Mar 2026).
- The national insecurity count has a published relative standard error of 1.35%. (EIA, RECS 2024 Table HC 11.1, Mar 2026).
- Hardship measures overlap, and a disconnect notice is not a count of completed disconnections. (EIA, RECS 2024 Table HC 11.1, Mar 2026).
What does household energy insecurity measure?
Energy insecurity is a set of reported household experiences. It does not mean that every affected household lost service, paid the same bill, or exceeded an energy cost threshold. RECS gives both a combined indicator and separate, overlapping measures.

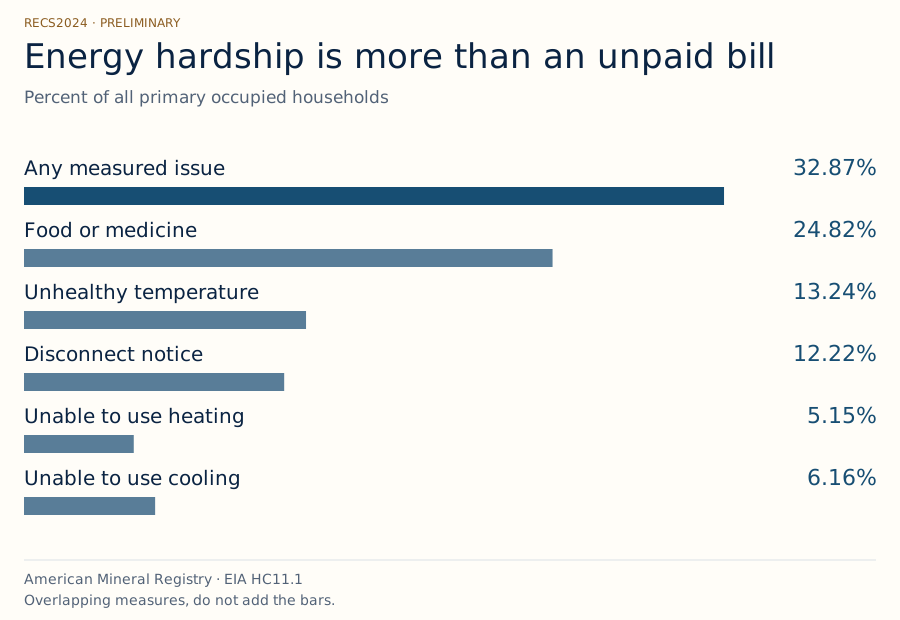
Figure 1 in text
RECS2024 · PRELIMINARY Energy hardship is more than an unpaid bill Percent of all primary occupied households Any measured issue 32.87% Food or medicine 24.82% Unhealthy temperature 13.24% Disconnect notice 12.22% Unable to use heating 5.15% Unable to use cooling 6.16% American Mineral Registry · EIA HC11.1 Overlapping measures, do not add the bars.
Source and data: EIA, RECS 2024 Table HC 11.1
Permanent link to this figure’s text and data · Sources and context
How many households experienced at least one measured hardship?
The combined measure is the appropriate starting point for a national prevalence claim. Its numerator is households reporting one or more of the issues EIA includes, and its denominator is the table’s complete population of primary occupied homes.
- The published combined estimate is 43.56 million households out of 132.54 million primary occupied homes. (EIA, RECS 2024 Table HC 11.1, Mar 2026).
- AMR divides 43.56 by 132.54 and multiplies by 100 to obtain 32.865550%, presented as 32.87%. (EIA, RECS 2024 Table HC 11.1, Mar 2026).
- The source excludes vacant homes, seasonal units, second homes, military housing and group quarters. (EIA, RECS 2024 Table HC 11.1, Mar 2026).
A housing unit in this survey is a household observation, not a person. Multiplying the count by an assumed family size would create a population estimate that the table does not supply. Nor is the denominator the number of residential electric accounts in the annual utility sales statistics. One survey describes occupied homes; the other describes customer accounts, including accounts outside this survey population. Keep the unit in any headline or quoted sentence. (EIA, RECS 2024 Table HC 11.1, Mar 2026).
Which reported experiences are most common?
Reducing essential consumption to afford energy was the largest individual measure in the national table. The other measures identify different consequences, and their thresholds and wording matter as much as their counts.
- Food or medicine tradeoffs affected 32.89 million households,24.82% of the national denominator. (EIA, RECS 2024 Table HC 11.1, Mar 2026).
- Leaving the home at an unhealthy temperature affected 17.55 million households,13.24% of the denominator. (EIA, RECS 2024 Table HC 11.1, Mar 2026).
- A disconnect or delivery stop notice affected 16.19 million households,12.22% of the denominator. (EIA, RECS 2024 Table HC 11.1, Mar 2026).
These are reports of household experience, not a utility billing census or a clinical diagnosis of unsafe temperature. The survey does not establish how long the unhealthy condition lasted, how much food was reduced, or whether a delivery notice led to an interruption. Quote the measure as recorded. Calling all three categories unpaid utility bills would erase part of the experience the survey was designed to capture. (EIA, RECS 2024 Table HC 11.1, Mar 2026).
Why can the separate hardship counts not be added?
A household can report more than one issue. EIA expressly warns that the marginal categories overlap. The combined indicator is the deduplicated measure available in this table, while the individual columns explain the kinds of hardship reported.
- The source estimates 6.83 million households unable to use main heating equipment for included affordability related reasons. (EIA, RECS 2024 Table HC 11.1, Mar 2026).
- It estimates 8.16 million households unable to use air conditioning for included affordability related reasons. (EIA, RECS 2024 Table HC 11.1, Mar 2026).
- Equipment inability includes a broken system the household could not afford to repair, as well as specified nonpayment related fuel or service disruptions. (EIA, RECS 2024 Table HC 11.1, Mar 2026).
A Venn diagram would require the joint intersections between categories. Those intersections are not published in HC 11.1, so this reference does not invent them. The difference between the sum of marginal counts and the combined count is not a count of households with two problems. Some households can report several. Likewise, the equipment columns do not isolate shutoffs from unaffordable repairs. Use the exact combined or individual measure that matches the sentence being supported. (EIA, RECS 2024 Table HC 11.1, Mar 2026).
How does energy insecurity vary by household income?
Households in lower income bands reported higher energy insecurity point estimates. The table supports a complete seven-band comparison, with the same measure, survey edition and denominator definition throughout. These observations describe association, not the effect of changing a household’s income.

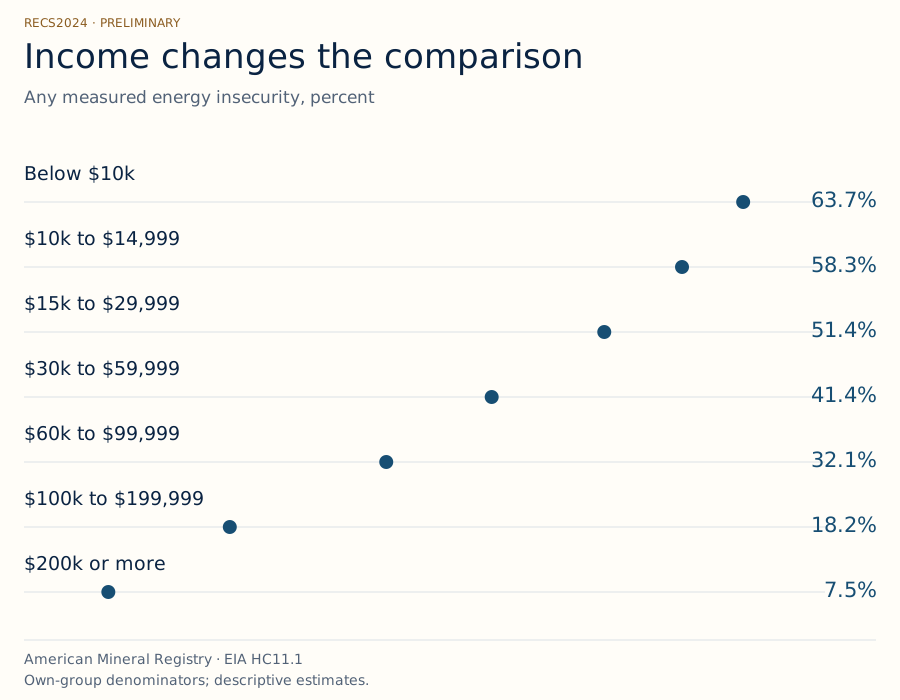
Figure 2 in text
RECS2024 · PRELIMINARY Income changes the comparison Any measured energy insecurity, percent Below $10k 63.7% $10k to $14,999 58.3% $15k to $29,999 51.4% $30k to $59,999 41.4% $60k to $99,999 32.1% $100k to $199,999 18.2% $200k or more 7.5% American Mineral Registry · EIA HC11.1 Own-group denominators; descriptive estimates.
Source and data: EIA, RECS 2024 Table HC 11.1
Permanent link to this figure’s text and data · Sources and context
Which income bands have the highest estimated rates?
Within each income band, divide households reporting any insecurity by all households in that band. This avoids confusing the share of an income group experiencing hardship with the share of all insecure households belonging to that group.
- Below $10,000 income: 3.97 million of 6.23 million households, or 63.72% reported an issue. (EIA, RECS 2024 Table HC 11.1, Mar 2026).
- At $10,000 to $14,999 income: 3.44 million of 5.90 million households, or 58.31% reported an issue. (EIA, RECS 2024 Table HC 11.1, Mar 2026).
- At $15,000 to $29,999 income: 6.90 million of 13.42 million households, or 51.42% reported an issue. (EIA, RECS 2024 Table HC 11.1, Mar 2026).
These are annual household income categories rather than income per person or a local cost adjusted poverty measure. They should not be relabeled low income according to an unrelated assistance program’s eligibility rules. The band boundaries also differ from percentages of area median income used in the DOE LEAD tool. An article comparing the two systems should first explain their different populations and definitions instead of placing their rates in a single unexplained ranking. (EIA, RECS 2024 Table HC 11.1, Mar 2026).
Does hardship disappear at middle and higher incomes?
The table reports insecurity throughout the income distribution. A smaller rate at a higher income does not imply an absence of hardship, and the grouped data cannot explain any particular household’s circumstances.
- At $30,000 to $59,999 income: 12.83 million of 30.96 million households, or 41.44% reported an issue. (EIA, RECS 2024 Table HC 11.1, Mar 2026).
- At $60,000 to $99,999 income: 9.44 million of 29.41 million households, or 32.10% reported an issue. (EIA, RECS 2024 Table HC 11.1, Mar 2026).
- At $100,000 to $199,999 income: 5.89 million of 32.30 million households, or 18.24% reported an issue. (EIA, RECS 2024 Table HC 11.1, Mar 2026).
- At $200,000 or more: 1.07 million of 14.32 million households, or 7.47% reported an issue. (EIA, RECS 2024 Table HC 11.1, Mar 2026).
The same annual income can support different household sizes, housing conditions and climates. HC 11.1 provides separate tables by these characteristics, but they are marginal comparisons rather than a model controlling for all the characteristics simultaneously. Do not combine the separate rows into a fabricated profile such as an exact rate for low income renters in mobile homes. That intersection requires an additional source or a correctly weighted analysis of survey microdata. (EIA, RECS 2024 Table HC 11.1, Mar 2026).
How large is the difference between the income extremes?
AMR’s descriptive comparison expresses the gap in both percentage points and a rate ratio. They are two descriptions of the same point estimates, not interchangeable units and not a statistical significance test.
- The below $10,000 rate exceeds the $200,000 or morerate by 56.251850 percentage points in the published-count calculation. (EIA, RECS 2024 Table HC 11.1, Mar 2026).
- The ratio of those two point estimates is 8.528285, or about 8.53 times. (EIA, RECS 2024 Table HC 11.1, Mar 2026).
- The combined insecurity count for the $200,000 or moreband is 1.07 million households. (EIA, RECS 2024 Table HC 11.1, Mar 2026).
A percentage point difference subtracts two percentages. A rate ratio divides them. Saying the difference is 56.25 percent would leave the reader unsure which operation was performed. Keep both the calculation and the reference group in a reusable citation. The extreme-band ratio also has sampling and rounding uncertainty. It should not be framed as the exact likelihood for any one household or as proof that income alone caused the observed gap. (EIA, RECS 2024 Table HC 11.1, Mar 2026).
Are renters and homeowners affected differently?
The tenure comparison changes depending on whether the question concerns a household’s group rate or the national count. Owned homes are the larger population. Renters are the smaller population but have the higher combined insecurity point estimate.

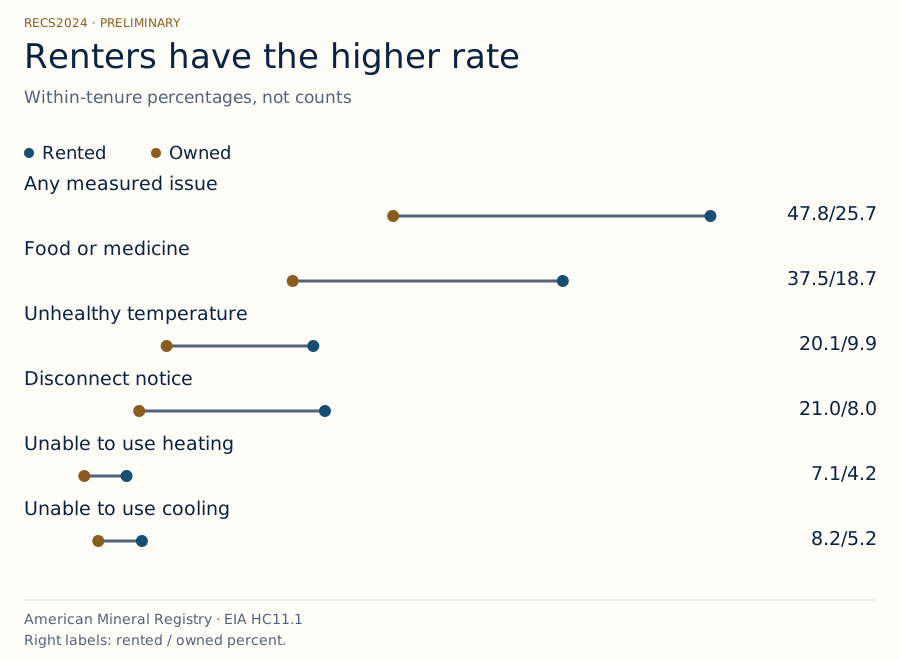
Figure 3 in text
RECS2024 · PRELIMINARY Renters have the higher rate Within-tenure percentages, not counts Rented Owned Any measured issue 47.8/25.7 Food or medicine 37.5/18.7 Unhealthy temperature 20.1/9.9 Disconnect notice 21.0/8.0 Unable to use heating 7.1/4.2 Unable to use cooling 8.2/5.2 American Mineral Registry · EIA HC11.1 Right labels: rented / owned percent.
Source and data: EIA, RECS 2024 Table HC 11.1
Permanent link to this figure’s text and data · Sources and context
What is the renter versus owner rate?
The source’s rented category includes households occupying their primary housing unit without paying rent. The comparison therefore follows EIA’s housing tenure definition rather than a count restricted to households with a conventional rent payment.
- Rented homes: 20.55 million of 43.00 million households, or 47.79% reported any measured issue. (EIA, RECS 2024 Table HC 11.1, Mar 2026).
- Owned homes: 23.01 million of 89.54 million households, or 25.70% reported any measured issue. (EIA, RECS 2024 Table HC 11.1, Mar 2026).
- The AMR point-estimate gap is 22.092686 percentage points, and the renter to owner rate ratio is 1.859704. (EIA, RECS 2024 Table HC 11.1, Mar 2026).
It would be wrong to describe this as the savings from buying a home. Household income, building characteristics, location and other differences may all relate to the result. The comparison contains no before-and-after ownership experiment. It is useful for describing the measured distribution of hardship and for identifying the kinds of questions a more detailed housing study would need to answer. (EIA, RECS 2024 Table HC 11.1, Mar 2026).
Which tenure group contains more affected households?
Counts help describe the scale of each population. Rates help describe prevalence within a group. The two measures legitimately point in different directions because the owner population is considerably larger.
- The table estimates 23.01 million owned households with any measured insecurity. (EIA, RECS 2024 Table HC 11.1, Mar 2026).
- It estimates 20.55 million rented households with any measured insecurity. (EIA, RECS 2024 Table HC 11.1, Mar 2026).
- The respective population denominators are 89.54 million owned and 43.00 million rented households. (EIA, RECS 2024 Table HC 11.1, Mar 2026).
A program serving a large number of affected owners and an article highlighting higher renter prevalence could both be consistent with this evidence. Neither should suppress the other unit. In a chart, identify whether the axis is millions of households or percent of households within tenure. A count-only graphic cannot answer who is more likely to report hardship, and a rate-only graphic cannot determine the total number of homes needing assistance. (EIA, RECS 2024 Table HC 11.1, Mar 2026).
Are all hardship types more common among renters?
The downloadable tenure profiles retain the separate numerators and denominators for every measured issue. This lets a writer support a precise claim about notices, essential consumption tradeoffs or equipment access without using the combined measure as a substitute.
- Renters reducing food or medicine: 16.13 million of 43.00 million households, or 37.51%. (EIA, RECS 2024 Table HC 11.1, Mar 2026).
- Owners reducing food or medicine: 16.75 million of 89.54 million households, or 18.71%. (EIA, RECS 2024 Table HC 11.1, Mar 2026).
- Renters receiving a disconnect or delivery notice: 9.01 million of 43.00 million households, or 20.95%. (EIA, RECS 2024 Table HC 11.1, Mar 2026).
- Owners receiving a disconnect or delivery notice: 7.18 million of 89.54 million households, or 8.02%. (EIA, RECS 2024 Table HC 11.1, Mar 2026).
A notice still does not establish a completed service interruption. An equipment access problem may reflect an unaffordable repair rather than a disconnect. State utility protections, landlord billing arrangements and public assistance are not measured as explanations in this marginal tenure table. If the article concerns one of those mechanisms, use this reference for the population comparison and a separate primary source for the mechanism. (EIA, RECS 2024 Table HC 11.1, Mar 2026).
Where are energy insecurity counts and rates highest?
Geography needs an explicit population boundary. Census regions, climate zones and urban classifications answer different questions. The reference keeps these systems separate, with source labels and matching household denominators beside the calculated percentages.

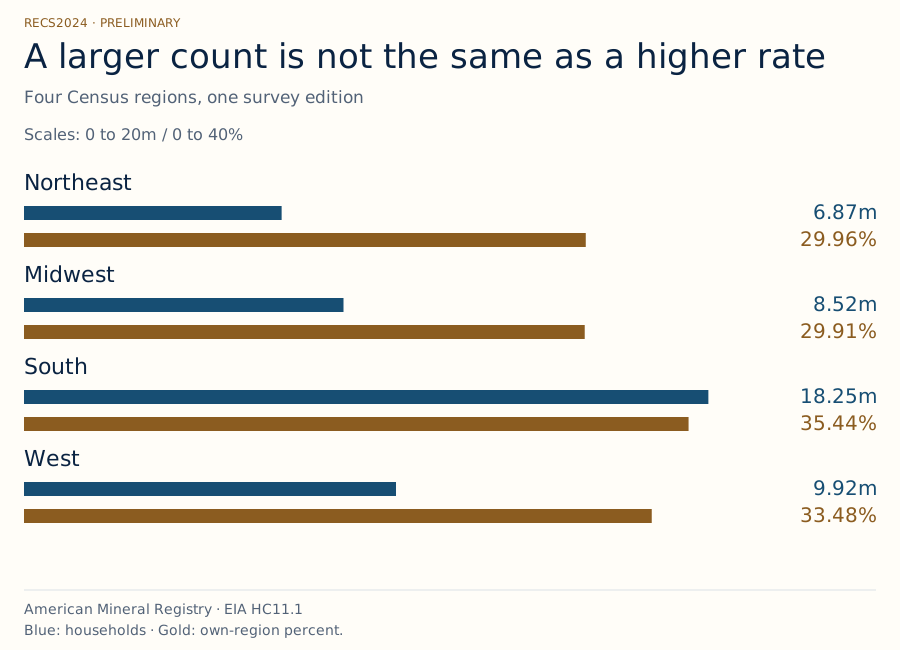
Figure 4 in text
RECS2024 · PRELIMINARY A larger count is not the same as a higher rate Four Census regions, one survey edition Scales: 0 to 20m / 0 to 40% Northeast 6.87m 29.96% Midwest 8.52m 29.91% South 18.25m 35.44% West 9.92m 33.48% American Mineral Registry · EIA HC11.1 Blue: households · Gold: own-region percent.
Source and data: EIA, RECS 2024 Table HC 11.1
Permanent link to this figure’s text and data · Sources and context
How do the four Census regions compare?
These four region rows partition the national geography. Their published rounded estimates can differ slightly from the national total when summed, so the national source row remains authoritative rather than being silently replaced by a calculated sum.
- Northeast: 6.87 million of 22.93 million households, or 29.96% reported any issue. (EIA, RECS 2024 Table HC 11.1, Mar 2026).
- Midwest: 8.52 million of 28.49 million households, or 29.91% reported any issue. (EIA, RECS 2024 Table HC 11.1, Mar 2026).
- South: 18.25 million of 51.49 million households, or 35.44% reported any issue. (EIA, RECS 2024 Table HC 11.1, Mar 2026).
- West: 9.92 million of 29.63 million households, or 33.48% reported any issue. (EIA, RECS 2024 Table HC 11.1, Mar 2026).
A regional point-estimate ranking does not provide a state ranking. It also does not establish that every county in one region has a higher rate than counties in another. The national sampling design and the relative standard errors must be considered before asserting a precise difference between neighboring estimates. This article reports the descriptive figures and their underlying uncertainty fields rather than manufacturing a significance test from rounded marginal counts. (EIA, RECS 2024 Table HC 11.1, Mar 2026).
Is this mainly an urban or rural problem?
Both settings contain households reporting hardship. The count is much larger in urban areas because the urban household population is much larger; the within-group percentages are closer than the absolute counts might suggest.
- Urban areas: 35.45 million of 106.30 million households, or 33.35% reported any issue. (EIA, RECS 2024 Table HC 11.1, Mar 2026).
- Rural areas: 8.11 million of 26.23 million households, or 30.92% reported any issue. (EIA, RECS 2024 Table HC 11.1, Mar 2026).
- The descriptive urban minus rural rate difference is 2.430217 percentage points. (EIA, RECS 2024 Table HC 11.1, Mar 2026).
EIA’s classification follows the Census Bureau’s 2020 urban and rural definitions. It should not be substituted for a metropolitan versus nonmetropolitan definition or for a state’s program eligibility boundary. An urban household is not necessarily an apartment household, and a rural household is not necessarily a detached home using a particular fuel. Those are separate variables, so combining them without a joint dataset creates an unsupported claim. (EIA, RECS 2024 Table HC 11.1, Mar 2026).
Can climate rows explain why one region has more hardship?
Climate rows describe another grouping of the same survey population. They can support a description of reported experience in each zone, but they cannot isolate the effects of weather, energy prices or building quality.
- Very cold/Cold climate group: 11.90 million of 42.10 million households, or 28.27% reported any issue. (EIA, RECS 2024 Table HC 11.1, Mar 2026).
- Hot-humid climate group: 8.96 million of 25.15 million households, or 35.63% reported any issue. (EIA, RECS 2024 Table HC 11.1, Mar 2026).
- Marine climate group: 1.78 million of 6.98 million households, or 25.50% reported any issue. (EIA, RECS 2024 Table HC 11.1, Mar 2026).
The source uses Building America climate regions, with the Subarctic region included in Very cold/Cold for publication. These boundaries differ from the four Census regions. Keep the full label when lifting a figure into an article. To explain a particular winter, use an actual weather series and a matching expenditure or price series, such as the separate winter household energy cost reference, rather than attributing survey differences to an unmeasured recent temperature event. (EIA, RECS 2024 Table HC 11.1, Mar 2026).
How do housing conditions relate to reported hardship?
The housing and insulation comparisons are useful starting points for stories about building conditions. They are not performance tests of particular construction materials, a retrofit benefit estimate, or evidence that one housing characteristic independently caused the difference.

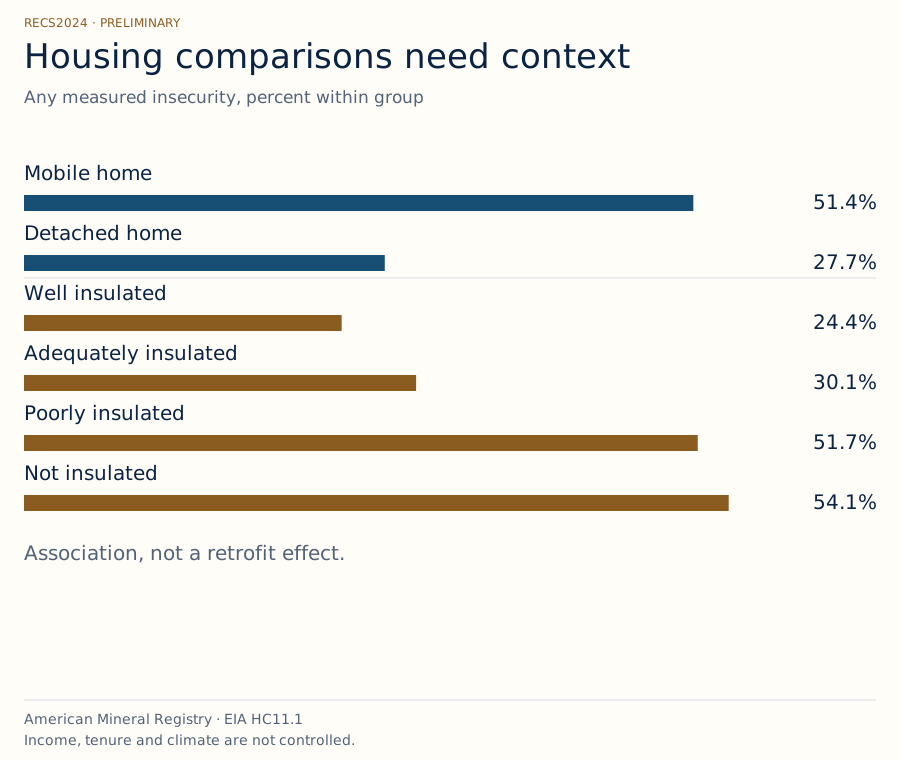
Figure 5 in text
RECS2024 · PRELIMINARY Housing comparisons need context Any measured insecurity, percent within group Mobile home 51.4% Detached home 27.7% Well insulated 24.4% Adequately insulated 30.1% Poorly insulated 51.7% Not insulated 54.1% Association, not a retrofit effect. American Mineral Registry · EIA HC11.1 Income, tenure and climate are not controlled.
Source and data: EIA, RECS 2024 Table HC 11.1
Permanent link to this figure’s text and data · Sources and context
How do mobile and detached homes compare?
The comparison uses all households in each housing type as its denominator. A rate can be higher in a smaller housing category even when another category contains more affected households in total.
- Mobile homes: 3.41 million of 6.64 million households, or 51.36% reported any issue. (EIA, RECS 2024 Table HC 11.1, Mar 2026).
- Single-family detached homes: 22.84 million of 82.51 million households, or 27.68% reported any issue. (EIA, RECS 2024 Table HC 11.1, Mar 2026).
- The mobile minus detached descriptive difference is 23.673929 percentage points. (EIA, RECS 2024 Table HC 11.1, Mar 2026).
The full download also includes attached homes and apartment categories. It does not group all apartments into one fabricated estimate. To combine categories, a writer would need to add their counts and denominators before calculating a new rate, while retaining the limits imposed by source rounding. Averaging their percentages directly would give equal weight to populations of different sizes and answer a different question. (EIA, RECS 2024 Table HC 11.1, Mar 2026).
What does the insulation comparison show?
The source categories describe household reports of insulation adequacy. AMR calculates the fraction in each category also reporting at least one measured energy insecurity issue, without inferring an independent building efficiency effect.
- Well insulated homes: 9.34 million of 38.32 million households, or 24.37% reported any issue. (EIA, RECS 2024 Table HC 11.1, Mar 2026).
- Poorly insulated homes: 12.06 million of 23.33 million households, or 51.69% reported any issue. (EIA, RECS 2024 Table HC 11.1, Mar 2026).
- Homes reported as not insulated: 1.86 million of 3.44 million households, or 54.07% reported any issue. (EIA, RECS 2024 Table HC 11.1, Mar 2026).
Housing condition, income, tenure and local climate can be related. A comparison holding none of them constant cannot quantify the outcome of adding insulation to a home. The table also contains no engineering measurement of air leakage, insulation thickness or a particular product’s thermal resistance. Describe the recorded categories and the observed relationship. Use a separate evaluated intervention study for claims about the benefits of a specific energy efficiency measure. (EIA, RECS 2024 Table HC 11.1, Mar 2026).
What other household comparisons are available?
The complete working tables extend beyond the headline comparisons to construction period, household size and the presence of older adults or children. Every row preserves the same six outcome definitions and its own population denominator.
- Households with children under 18: 14.96 million of 35.34 million households, or 42.33% reported any issue. (EIA, RECS 2024 Table HC 11.1, Mar 2026).
- Households without children under 18: 28.60 million of 97.20 million households, or 29.42% reported any issue. (EIA, RECS 2024 Table HC 11.1, Mar 2026).
- The descriptive difference between those children-present and children-absent point estimates is 12.907768 percentage points. (EIA, RECS 2024 Table HC 11.1, Mar 2026).
These comparisons remain separate rather than being merged into a supposed risk score. A household can belong to one row in several different classification systems. Summing those row counts would count many households repeatedly. For a school, university or local newspaper, the value of the full table is that the correct source-backed comparison can be selected for the actual question, with the denominator and qualification already visible. (EIA, RECS 2024 Table HC 11.1, Mar 2026).
How should these statistics be checked and cited?
Use the source edition, population and measure together. These are preliminary survey estimates of the 2024 edition, with household data collected across late 2024 and early 2025. They are not administrative counts of 2026 disconnections or observations of the current winter’s energy spending.

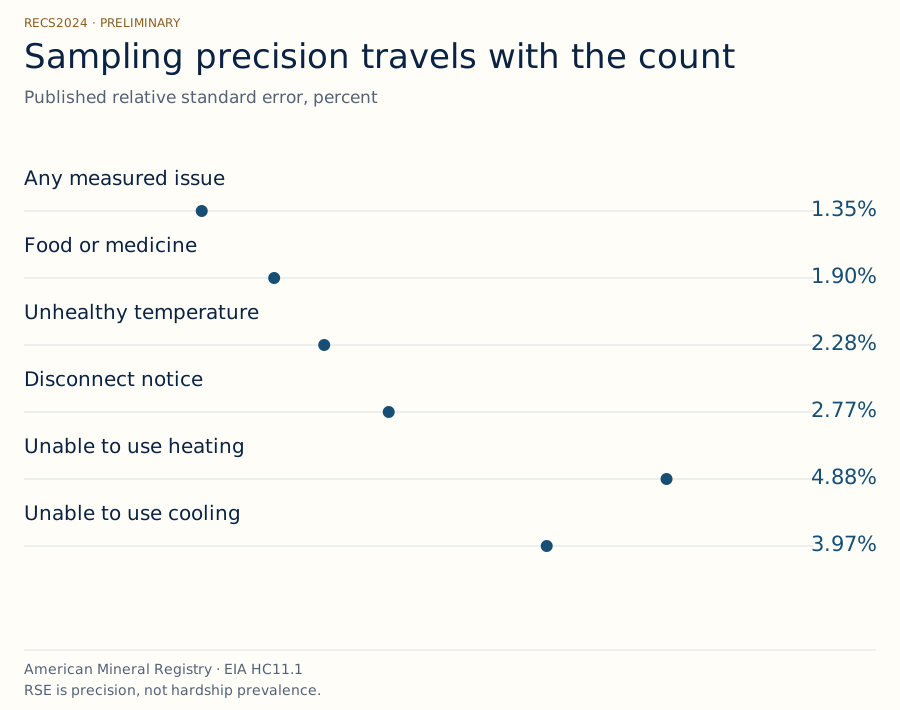
Figure 6 in text
RECS2024 · PRELIMINARY Sampling precision travels with the count Published relative standard error, percent Any measured issue 1.35% Food or medicine 1.90% Unhealthy temperature 2.28% Disconnect notice 2.77% Unable to use heating 4.88% Unable to use cooling 3.97% American Mineral Registry · EIA HC11.1 RSE is precision, not hardship prevalence.
Source and data: EIA, RECS 2024 Table HC 11.1
Permanent link to this figure’s text and data · Sources and context
How reliable are the estimates?
HC 11.1 includes a second worksheet containing relative standard errors. The uncertainty field for a count should travel with that count. The relative standard error of a numerator is not automatically the relative standard error of a calculated subgroup percentage.
- The national combined insecurity count has a published RSE of 1.35%. (EIA, RECS 2024 Table HC 11.1, Mar 2026).
- The food or medicine tradeoff count has an RSE of 1.90%, and the unhealthy temperature count has an RSE of 2.28%. (EIA, RECS 2024 Table HC 11.1, Mar 2026).
- The disconnect notice count has an RSE of 2.77%; heating and cooling inability counts have RSE sof 4.88% and 3.97%. (EIA, RECS 2024 Table HC 11.1, Mar 2026).
For example, a count’s standard error can be calculated as that count multiplied by its RSE and divided by 100. This reference includes that arithmetic in the precision register. However, the confidence interval of a ratio can also depend on numerator and denominator covariance. The published marginal table does not supply that joint information. The package therefore does not invent ratio confidence intervals, declare small gaps significant, or imply that extra displayed decimal places remove sampling uncertainty. (EIA, RECS 2024 Table HC 11.1, Mar 2026).
What do source rounding and suppression markers mean?
Published household counts are rounded to 0.01 million. Calculating a percentage with more decimals makes the arithmetic reproducible, but does not turn the rounded estimate into a precisely counted household population.
- P identifies an estimate equal to a control total used in poststratification, based on 2024 American Community Survey estimates. (EIA, RECS 2024 Table HC 11.1, Mar 2026).
- Q identifies withheld data where the RSE exceeds 50% or fewer than 10 sample households support the estimate. (EIA, RECS 2024 Table HC 11.1, Mar 2026).
- EIA warns that source-rounded categories may not sum to totals. (EIA, RECS 2024 Table HC 11.1, Mar 2026).
The public comparison uses 49 selected rows with numeric values for all essential measures. It leaves the source’s suppressed bill-payment category out of the analytical comparison rather than replacing a withheld estimate with zero. The full producer workbook remains available from EIA. Within the selected comparisons, the partition audit retains every small rounding difference and never redistributes it across groups. The source-cell ledger makes the choice inspectable. (EIA, RECS 2024 Table HC 11.1, Mar 2026).
Which exact sentence and download should a writer use?
Choose a specific finding whose population and period match the intended sentence. The cards below pair a permanent supporting fragment with a matching CSVand plain or HTMLattribution, while crediting EIA for the measurements and AMR for the calculation.
- The national rate citation uses 43.56 million as numerator and 132.54 million as denominator, both from the same source row. (EIA, RECS 2024 Table HC 11.1, Mar 2026).
- The tenure comparison uses each group’s own denominator,43.00 million rented and 89.54 million owned households. (EIA, RECS 2024 Table HC 11.1, Mar 2026).
- The regional comparison uses four Census regions, without claiming state or county estimates. (EIA, RECS 2024 Table HC 11.1, Mar 2026).
A useful citation names the survey edition, preliminary status, measure, group and unit. A writer can shorten explanatory prose but should retain those facts. For electricity spending rather than hardship, the separate residential electricity bill reference uses utility account revenue and sales. For fuel supply context, the electricity generation mix reference measures in-state generation. Neither should be treated as a substitute for this household survey. (EIA, RECS 2024 Table HC 11.1, Mar 2026).
Methodology and Sources
AMR read EIA’s preliminary 2024 RECS HC 11.1 data and RSE worksheets and its household characteristics methods. The selected 49 source rows each contain all seven essential population and hardship counts. Counts retain the source’s 0.01 million precision. Each rate is 100 times the outcome count divided by the same row’s household denominator. Comparisons subtract or divide those point estimates. All six outcomes remain separate, with overlap explicitly preserved. No suppressed value becomes zero. The source-row ledger, calculation program, precision register and rounding audit reproduce the results offline. Marginal tables do not establish causality, joint intersections or ratio confidence intervals. EIA’s methodology identifies 16,676 eligible completed household cases and collection from October 2024 to April 2025. (EIA,2024 RECS methodology, Mar 2026).
Glossary
- Energy insecurity: One or more of the household issues measured in the source table, not an energy cost to income threshold. (EIA, RECS 2024 Table HC 11.1, Mar 2026).
- Primary occupied home: The main residence represented by the survey, with the source exclusions retained. (EIA, RECS 2024 Table HC 11.1, Mar 2026).
- Point estimate: A survey’s estimated value, distinct from its sampling uncertainty. (EIA terminology, Mar 2026).
- Denominator: The complete population against which an affected group is compared. (EIA, RECS 2024 Table HC 11.1, Mar 2026).
- Percentage point: The difference between two percentages, rather than their ratio. (EIA, RECS 2024 Table HC 11.1, Mar 2026).
- Rate ratio: One group’s calculated percentage divided by another group’s percentage. (EIA, RECS 2024 Table HC 11.1, Mar 2026).
- Relative standard error: A count estimate’s standard error as a percentage of the estimate. (EIA terminology, Mar 2026).
- Overlapping measures: Outcomes that the same household can report, so their separate counts cannot be summed as distinct homes. (EIA, RECS 2024 Table HC 11.1, Mar 2026).
- Preliminary: The release status EIA assigns to these 2024 household characteristics estimates. (EIA, RECS 2024 Table HC 11.1, Mar 2026).
- Control total: An external population estimate used in poststratification, markedPin the uncertainty worksheet. (EIA, RECS 2024 Table HC 11.1, Mar 2026).