Key takeaways
- At the end of FY 2025, BLM reported 21,394,971 federal onshore oil and gas acres in effect and 12,346,001 acres covered by producing leases. The producing-acreage ratio was 57.7%, versus 30.1% in FY 2001. AMR divides BLM Table 6 producing acres by BLM Table 2 acres in effect.
- Between FY 2001 and FY 2025, BLM’s federal onshore oil and gas acres in effect changed by -43.7%, while acreage covered by producing leases changed by +8.1%. Both endpoints use federal fiscal year-end inventories, with Indian leases excluded in the source.
- BLM producing acreage equaled 92.4% of New Mexico acres in effect and 57.2% of Wyoming acres in effect at FY 2025 year-end. New Mexico and Wyoming had the two largest acreage-in-effect figures in the federal workbook.
- Of the 27.6 percentage-point increase in BLM’s national federal onshore producing-acreage ratio from FY 2001 to FY 2025, 23.3 points came from replacing the acreage denominator first. AMR held the FY 2001 producing acreage fixed while substituting the FY 2025 acreage in effect. Updating the numerator then added 4.3 points. The order defines the result.
- Wyoming and New Mexico together accounted for 50.4% of federal onshore oil and gas acreage in effect and 61.7% of acreage covered by producing leases at FY 2025 year-end. The two-state figures use the corresponding national denominator from each BLM table.
- BLM’s highest federal onshore oil and gas acreage in effect occurred in FY 2008, while acreage covered by producing leases peaked in FY 2008, within the FY 2001 to FY 2025 series. The respective peaks were 47,242,495 and 14,543,425 acres. They represent different inventories.
- ONRR’s reported federal onshore oil volume divided by BLM acreage covered by producing leases rose from 14.40 barrels per acre in FY 2015 to 50.54 in FY 2025. AMR compares national fiscal-year aggregates. The BLM acreage fell by 414,699 acres between the two endpoints. The calculation does not match specific wells to leases.
- The BLM producing-lease share by count exceeded its producing share by acreage in all 25 fiscal years from FY 2001 through FY 2025. The widest gap was 18.16 percentage points in FY 2007. The two shares use the same edition of BLM Tables 1, 2, 5 and 6, which cover the federal onshore lease inventory.
- AMR compared 204 FY 2024 acreage and lease-count cells in BLM’s FY 2024 and FY 2025 workbooks. All 204 matched. The check covers the 50 geographic-state rows and national total in Tables 1, 2, 5 and 6. Other columns and tables may differ.

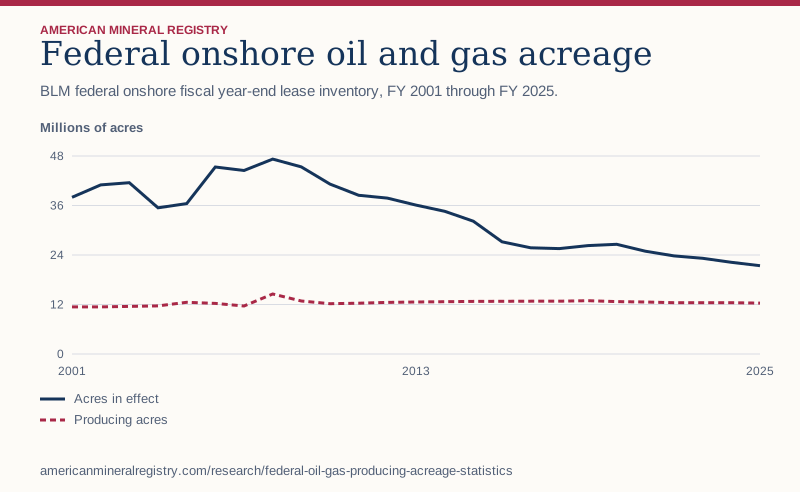
Figure 1 in text
BLM federal onshore fiscal year-end lease inventory, FY 2001 through FY 2025. Millions of acres.
| Fiscal year | Acres in effect | Producing acres |
|---|---|---|
| 2001 | 37.99 | 11.42 |
| 2002 | 40.99 | 11.41 |
| 2003 | 41.53 | 11.54 |
| 2004 | 35.45 | 11.67 |
| 2005 | 36.45 | 12.53 |
| 2006 | 45.34 | 12.27 |
| 2007 | 44.48 | 11.63 |
| 2008 | 47.24 | 14.54 |
| 2009 | 45.36 | 12.84 |
| 2010 | 41.19 | 12.21 |
| 2011 | 38.46 | 12.32 |
| 2012 | 37.79 | 12.51 |
| 2013 | 36.09 | 12.62 |
| 2014 | 34.59 | 12.69 |
| 2015 | 32.19 | 12.76 |
| 2016 | 27.21 | 12.77 |
| 2017 | 25.74 | 12.79 |
| 2018 | 25.55 | 12.79 |
| 2019 | 26.29 | 12.92 |
| 2020 | 26.60 | 12.71 |
| 2021 | 24.93 | 12.61 |
| 2022 | 23.77 | 12.43 |
| 2023 | 23.20 | 12.45 |
| 2024 | 22.22 | 12.43 |
| 2025 | 21.39 | 12.35 |
Chart wording and scale
Federal onshore oil and gas acreage BLM federal onshore fiscal year-end lease inventory, FY 2001 through FY 2025.
Millions of acres 0 12 24 36 48 2001 2013 2025 Acres in effect Producing acres
Source and data: Download chart source data
Permanent link to this figure’s text and data · Sources and context
Which federal acreage figure answers my question?
Use acreage in effect to measure the area covered by leases BLM considers in effect at fiscal year-end. Use producing acreage for the area covered by leases BLM classifies as producing at that date. Choose acres in new leases issued when measuring activity during the year.
The workbook reports all three. They describe different stages and time bases. A number announced for a lease sale could refer to acreage offered. For a claim about the federal onshore inventory, start from the BLM statistics and table definitions.
| If the question is about | Use | Timing |
|---|---|---|
| Acres in leases in effect | Table 2 | Fiscal year-end inventory |
| Acres covered by producing leases | Table 6 | Fiscal year-end inventory |
| Acres in new leases issued | Table 4 | Activity during the fiscal year |
| Acres offered at competitive auctions | Table 11 | Offer and sale records |
| Status of one lease | MLRS case and serial register | Record date for the named case |
How do offering, leasing and production fit together?
A parcel can be nominated and reviewed before an offer. The BLM leasing process describes that review and links to lease sales. The statistics workbook reports acres in new leases issued in a separate table from acres offered at auction. Sale and issuance may fall in different reporting years.
The figures here concern BLM’s federal onshore oil and gas program. The federal mineral estate includes other acreage, and a tract’s surface ownership can differ from its mineral ownership. The acreage inventory does not establish how many individual parcels, wells, or mineral owners it includes.
How have federal lease acres and producing acres changed?
The national share rose as the acreage-in-effect denominator contracted and the producing-acreage numerator increased between the study endpoints. A change in the share can reflect a change in either column.
The share compares two year-end inventories. Newly issued acres during a year are a separate flow.
| Fiscal year | Federal acres in effect | Producing acres | Producing share |
|---|---|---|---|
| 2001 | 37,990,113 | 11,421,865 | 30.1% |
| 2005 | 36,452,327 | 12,529,618 | 34.4% |
| 2010 | 41,186,158 | 12,205,416 | 29.6% |
| 2019 | 26,287,326 | 12,915,006 | 49.1% |
| 2024 | 22,218,215 | 12,425,869 | 55.9% |
| 2025 | 21,394,971 | 12,346,001 | 57.7% |
How different are the largest federal lease footprints?
Wyoming had the largest area in effect and New Mexico ranked second. Their producing shares differed materially. Alaska had the third-largest area in effect and a much lower producing share in this workbook.
The comparison ranks by acreage in effect. It does not rank all states by output or royalty revenue.
| Geographic state | FY 2025 acres in effect | FY 2025 producing acres | Producing share |
|---|---|---|---|
| Wyoming | 6,675,419 | 3,819,309 | 57.2% |
| New Mexico | 4,114,557 | 3,801,500 | 92.4% |
| Alaska | 2,576,982 | 53,157 | 2.1% |
| Colorado | 2,014,042 | 1,471,947 | 73.1% |
| Utah | 2,014,003 | 1,037,713 | 51.5% |
Does producing acreage measure how much land is physically disturbed?
BLM’s producing acreage measures the land covered by producing leases. For a physical footprint study, use mapped pads, roads and pipelines. Well counts and output per acre require separate data.
The federal leasing activity study reports the separate lease, permit and well measures.
Why does one state’s published ratio exceed 100%?
For Pennsylvania in FY 2025, BLM Table 2 lists 4,477 acres in effect and Table 6 lists 4,478 producing acres. The two published amounts differ by one acre. AMR retains both and leaves the computed ratio uncapped.
The ratio compares published inventory totals. It cannot verify which specific parcels overlap between the tables.
Is acreage in effect the same as all federal mineral acreage?
Acres in effect cover BLM’s federal oil and gas lease inventory. The much larger federal mineral estate covers a different population, including acres without an oil and gas lease in effect. Use the lease inventory as the denominator for this study.
The federal split-estate study measures the broader mineral estate on its own source basis.
How much of the ratio increase comes from the smaller denominator?
Hold the FY 2001 producing acreage fixed and divide it by the FY 2025 acreage in effect. The ratio rises from 30.07% to 53.39%. Then substitute the actual FY 2025 producing acreage to reach 57.71%.
The bridge allocates the measured change to denominator first, numerator second. Reversing the order assigns a different portion to each step. Both orderings arrive at the same observed endpoint. The bridge explains the arithmetic rather than policy causes.
| Calculation | Numerator acres | Denominator acres | Ratio |
|---|---|---|---|
| Observed FY 2001 | 11,421,865 | 37,990,113 | 30.07% |
| Update denominator first | 11,421,865 | 21,394,971 | 53.39% |
| Observed FY 2025 | 12,346,001 | 21,394,971 | 57.71% |
Did acreage in effect, producing acreage and the ratio peak together?
The maximum lease acreage in effect was 47,242,495 acres in FY 2008. The maximum acreage covered by producing leases was 14,543,425 acres in FY 2008. The highest producing-acreage ratio was 57.71% in FY 2025.
Each maximum answers a distinct question. A higher ratio can come from a smaller denominator even when producing acreage is below its own peak. Cite the inventory label and the fiscal year with the number.
| Metric | Peak fiscal year | Peak value |
|---|---|---|
| Acres in effect | 2008 | 47,242,495 acres |
| Acreage covered by producing leases | 2008 | 14,543,425 acres |
| Producing-acreage ratio | 2025 | 57.71% |
How much of the national inventory is in the two largest states?
Wyoming and New Mexico held 10,789,976 acres in effect and 7,620,809 acres covered by producing leases in FY 2025. Their share of the national producing-acreage figure was higher than their share of acreage in effect.
Use the matching national figure in each calculation. The remaining state rows are grouped below, so the national totals can be reconstructed directly. A share of acreage cannot establish the same share of output or receipts.
| FY 2025 grouping | Acres in effect | Producing acres | Share of national producing acres |
|---|---|---|---|
| Wyoming and New Mexico | 10,789,976 | 7,620,809 | 61.7% |
| All other reported states | 10,604,995 | 4,725,192 | 38.3% |
| United States | 21,394,971 | 12,346,001 | 100.0% |
Which states contribute the most to the difference between the two totals?
The national difference was 9,048,970 acres in FY 2025. The table ranks the five largest state differences in acres, rather than ranking the lowest state percentages. A state with a large lease inventory can contribute more even with a higher ratio.
Each difference subtracts Table 6 acreage from Table 2 acreage. It cannot identify unused parcels. Pennsylvania’s one-acre negative difference is included when reconciling the national total.
| Geographic state | Difference, acres | Share of national difference |
|---|---|---|
| Wyoming | 2,856,110 | 31.6% |
| Alaska | 2,523,825 | 27.9% |
| Utah | 976,290 | 10.8% |
| Montana | 740,529 | 8.2% |
| Colorado | 542,095 | 6.0% |
Is the national ratio the typical state ratio?
The national ratio was 57.71%. The median among the 31 states with positive acreage in effect was 72.18%. The national ratio weights each state by its acreage in effect. The median treats each state as one observation.
Report the national ratio for a question about the combined acreage inventory. Report the state median for a question about the middle reported state. Including a state with zero acreage in effect as if its ratio were zero would change the sample without a defined denominator.
Can the leased inventory fall when BLM issues new leases?
Yes. BLM reported 183 new federal onshore leases covering 132,047 acres during FY 2025. Yet the acreage in effect fell from 22,218,215 at FY 2024 year-end to 21,394,971 at FY 2025 year-end, a net decline of 823,244 acres.
The newly issued acreage is an annual flow and acreage in effect is a stock. These summary numbers do not separately show the acreage associated with each expiration, correction, or other movement. To attribute changes, track the underlying actions and case records rather than assuming the stock change equals the number issued.
| BLM figure | Period | Value |
|---|---|---|
| Acreage in effect | FY 2024 year-end | 22,218,215 acres |
| Acreage in new leases issued | During FY 2025 | 132,047 acres |
| Acreage in effect | FY 2025 year-end | 21,394,971 acres |
| Net change in acreage in effect | FY 2024 to FY 2025 | -823,244 acres |
Why is the share of producing leases different from the share of acreage?
BLM reported 23,647 producing leases out of 31,833 leases in effect at FY 2025 year-end. Dividing counts gives 74.3%. Dividing the acreage covered by producing leases, 12,346,001, by 21,394,971 acres in effect gives 57.7%.
Lease counts give each lease one vote. Acreage weights leases by their size. The two national aggregate quotients imply about 522 acres per producing lease and 672 acres per lease in effect. They are group averages and cannot show the size of the median lease or any particular lease.
How would I check an individual federal lease?
Start with the BLM serial number if available. The agency’s Mineral & Land Records System guidance says both legacy serial numbers and standardized MLRS serial numbers are searchable. Its research map can locate areas by name or legal land description. Use the MLRS reports page to identify the relevant report.
Record the case identifier, the geographic state, the area or legal description and the report date. A map result is a way to find a case and associated records. A state inventory total cannot establish an individual lease’s status, its ownership chain, or whether it contains a particular well.
How can I reproduce the ratio for New Mexico?
Open the FY 2025 national totals workbook. Use the geographic-state row for New Mexico in Table 2 and Table 6. Match the FY 2025 column in both. The two inputs are 4,114,557 acres in effect and 3,801,500 acres covered by producing leases. Divide the second by the first to obtain 92.4%.
Keep the geographic-state label. Reports grouped by BLM administrative office answer a different geographic question. For a national calculation, divide the two national totals. Averaging state percentages would give every state equal weight, including states with very different acreages.
What needs to stay with an acreage figure when I cite it?
Name the agency, identify the federal onshore oil and gas program, state the fiscal year and give the table number. If quoting a percentage, attach both the numerator and denominator. Use the same workbook vintage for both columns and keep any source discrepancy visible.
A complete citation of the national percentage states that BLM Table 6 acreage covered by producing leases was divided by BLM Table 2 acreage in effect, both for FY 2025. To answer how much land infrastructure physically disturbed or what the leases produced, use footprint or production evidence for that separate question.
How much reported production corresponds to an acre of producing lease inventory?
Pair each fiscal year’s ONRR Federal, Onshore Oil (bbl) and Gas (mcf) totals with BLM Table 6 acreage for the same fiscal year. The oil ratio increased by 250.9% from FY 2015 to FY 2025. The gas ratio rose by 29.8%. Those changes can move differently even though the two ratios share the same acreage denominator.
The calculation uses the two published national totals, so it is useful for comparing the direction of the program-level figures. It does not observe production on individual acres or measure a lease’s expected yield. The fiscal-year volume covers the full year and the acreage is a year-end snapshot. See the ONRR fiscal-year production metadata.
| Fiscal year | Producing acres at year-end | ONRR oil, barrels | ONRR gas, Mcf | Oil barrels per producing acre | Gas Mcf per producing acre |
|---|---|---|---|---|---|
| FY 2015 | 12,760,700 | 183,803,695 | 3,466,103,815 | 14.40 | 271.62 |
| FY 2020 | 12,711,111 | 311,819,275 | 3,296,904,648 | 24.53 | 259.37 |
| FY 2023 | 12,446,907 | 539,473,495 | 3,958,019,294 | 43.34 | 317.99 |
| FY 2024 | 12,425,869 | 610,849,523 | 4,214,640,603 | 49.16 | 339.18 |
| FY 2025 | 12,346,001 | 624,009,486 | 4,353,328,641 | 50.54 | 352.61 |
Was the gap between producing lease counts and acres persistent?
Yes. A count weights every lease equally. An acreage share weights leases by their area. The count share exceeded the acreage share in every observed year. The gap was 11.44 points in FY 2001, reached 18.16 points in FY 2007, and was 16.58 points in FY 2025.
The gap shows what changes when readers switch from counting leases to counting acres. It cannot identify why leases have different sizes or why a specific lease is classified as producing. For that, use case records rather than inferring a cause from the aggregate shares.
| Fiscal year | Producing share by lease count | Producing share by acreage | Gap, percentage points |
|---|---|---|---|
| FY 2001 | 41.5% | 30.1% | 11.44 |
| FY 2007 | 44.3% | 26.1% | 18.16 |
| FY 2015 | 53.8% | 39.6% | 14.12 |
| FY 2020 | 63.7% | 47.8% | 15.90 |
| FY 2024 | 72.2% | 55.9% | 16.28 |
| FY 2025 | 74.3% | 57.7% | 16.58 |
How much of the oil ratio change reflects the smaller area?
Hold acreage fixed at its FY 2015 level and substitute the FY 2025 ONRR oil volume. The ratio reaches 48.90 barrels per acre. Substituting actual FY 2025 producing acreage then adds 1.64 barrels per acre. Most of the measured change remains even with the earlier acreage denominator.
This comparison substitutes the numerator first, then the denominator. Reversing the sequence changes how the difference is allocated. Both methods arrive at the same observed ratio and neither assigns a cause to the change in reported volumes.
Did the next BLM edition revise the FY 2024 acreage and lease counts?
AMR tested all 50 geographic-state rows plus the national total across four inventory tables. Every selected value was unchanged, including the two national acreage figures. The check compared the original FY 2024 workbook with the FY 2025 workbook’s column labeled FY 2024.
That agreement is useful when citing FY 2024 values from either edition. It does not imply that any other table or year is unchanged. A reproducible trend should name the workbook edition and the fiscal-year column because the agency can revise historical records.
| FY 2024 national item | FY 2024 workbook | FY 2025 workbook |
|---|---|---|
| Leases in effect | 32,758 | 32,758 |
| Acres in effect | 22,218,215 | 22,218,215 |
| Producing leases | 23,654 | 23,654 |
| Producing acres | 12,425,869 | 12,425,869 |
Why do other federal leasing statistics look different?
The Congressional Research Service review compares production and lease inventories across FY 2015 and FY 2024 and uses an index to show relative production changes. An index describes growth from a baseline. The ratios above keep the underlying oil and gas units visible and pair them with BLM’s producing acres for each year.
The Interior leasing program review gives a dated snapshot of acreage that was producing or nonproducing. Auction coverage counts acreage offered or leased at sales. Those figures answer different questions from the year-end acres in effect. Read the event, geography and time basis before quoting a number.
How does this compare with other published research?
These sources address related questions using different measures. The table shows how to use them alongside this study.
Publications reviewed for this comparison. Bureau of Land Management. Congressional Research Service. Department of the Interior. Taxpayers for Common Sense.
| Publisher | What the publication covers | How AMR extends the comparison |
|---|---|---|
| Bureau of Land Management | Year-end lease count and acreage inventories in separate tables. | Reconcile both ratios annually over 25 fiscal years and compare 204 cells between workbook editions. |
| Congressional Research Service | Reports lease and acreage snapshots and indexes federal and nonfederal oil and gas volume trends. | Pair same-year ONRR volumes with BLM producing acres and display the original volume units and ratios. |
| Department of the Interior | Places a dated onshore producing and nonproducing acreage snapshot in program context. | Keep federal onshore inventories in one time series with their exact numerator and denominator. |
| Taxpayers for Common Sense | Summarizes acres offered and leased at BLM onshore lease sales during 2024. | Show how offered acreage, lease issuance, and producing acreage answer different questions. |
How did AMR reconcile the workbook?
AMR joined Tables 2 and 6 by geographic state and fiscal year. All 25 national values matched the corresponding workbook summary values. FY 2025 state acreage sums matched both national totals exactly.
The state download includes every state with positive acreage in effect in FY 2025. States with published zero leased and producing acres add zero to both national counts and have no defined producing share. The source covers BLM’s federal onshore program and excludes Indian leases.
Sources and data
- BLM FY 2025 national and geographic-state workbook, Tables 2 and 6
- Bureau of Land Management oil and gas statistics series
- BLM leasing process and sales stages
- BLM lease case and land records guidance
- BLM Mineral & Land Records System reports
- BLM FY 2024 archived workbook for vintage comparison
- ONRR reported fiscal-year production CSV
- ONRR production metadata and scope
- CRS federal onshore lease and production context
- Interior federal leasing program report
Download the data (CSV) · Read the data dictionary. The AMR analysis and figures are licensed CC BY 4.0. Refer to the original issuers for their materials. Read the calculation data guide.
Calculation data guide
The analysis download gives each calculated measure, evidence period, numeric value, unit, and formula. Follow its source data URL for the input rows and use the period and unit when quoting the result.