AMR reconciles the complete mine-country panel, nested industrial and photovoltaic demand, annual supply components and balance definitions. The calculations retain each producer’s original estimate, unit and source vintage. A market deficit is an annual flow comparison; it does not specify how much silver remains above ground or establish an exhaustion date.
Key Takeaways
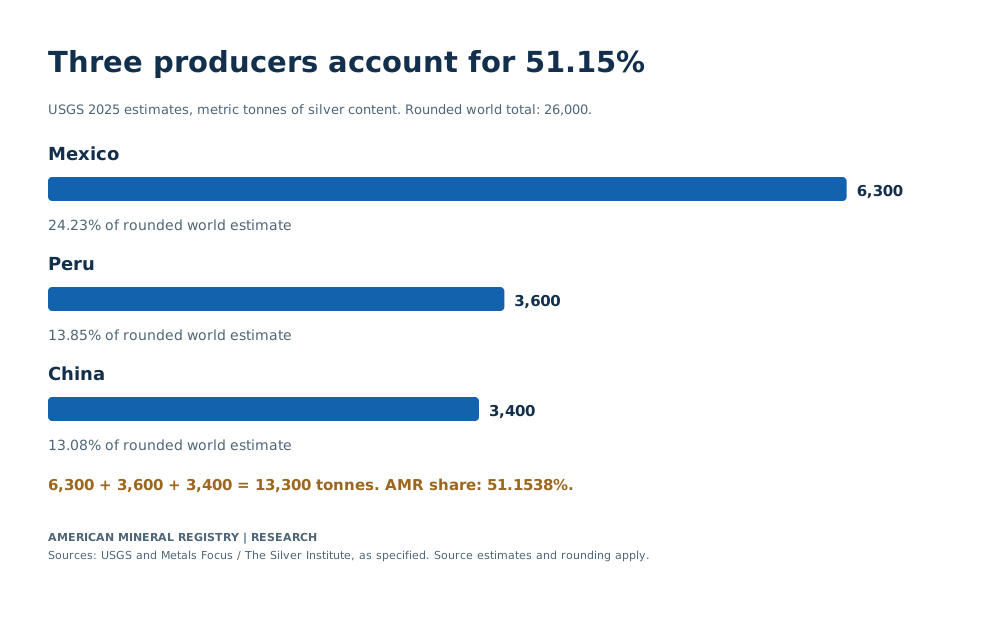
- Mexico, Peru and China account for 51.1538% of USGS’s rounded 2025 world mine estimate, using 6,300 + 3,600 + 3,400 tonnes over 26,000 tonnes.
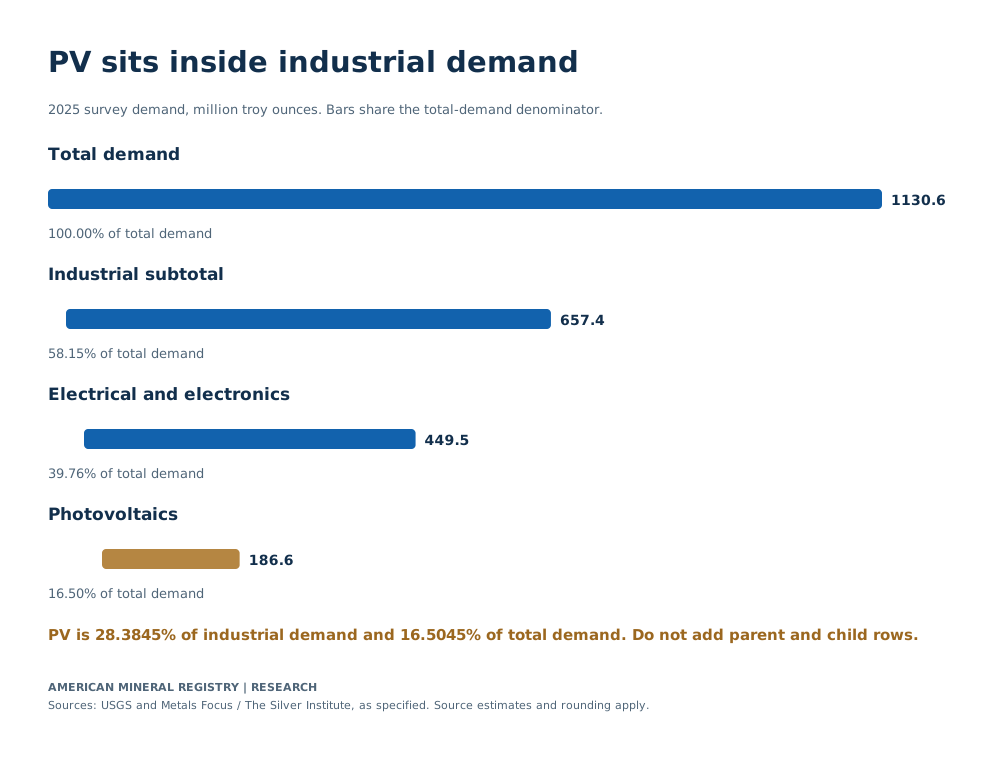
- Industrial demand represents 58.1461% of the Survey’s reported 2025 total demand, by AMR calculation.
- Photovoltaics represents 16.5045% of total demand, or 28.3845% of industrial demand. PV is already inside the industrial subtotal.
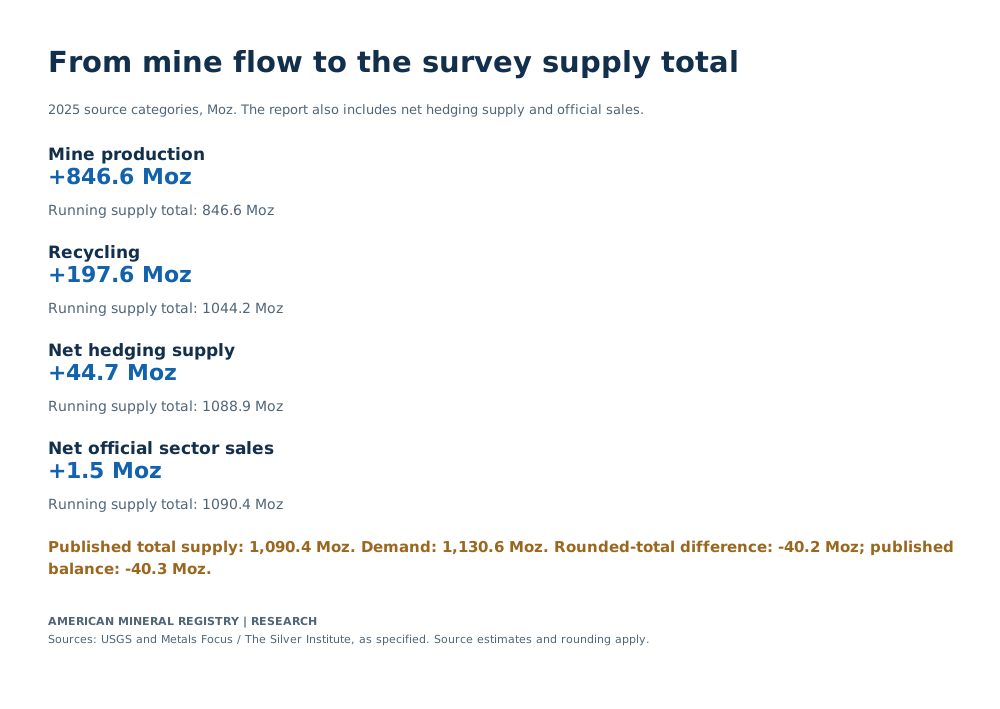
- Recycling was 197.6 Moz, compared with 846.6 Moz of mine supply. The source excludes manufacturing/process scrap from its recycling definition.
- Total supply includes additional categories, including net hedging supply and net official sector sales.
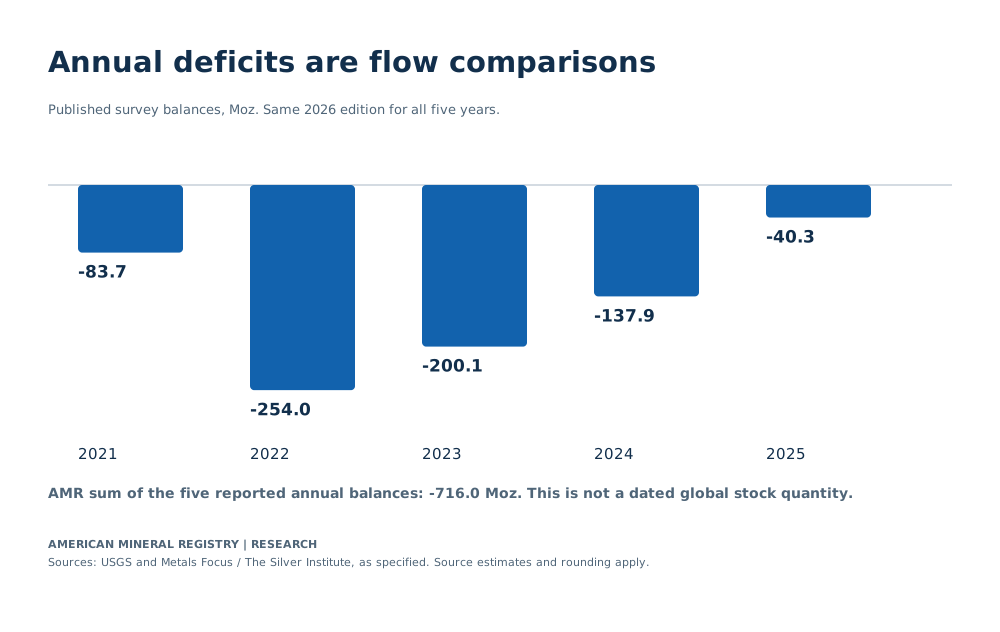
- The published balance is −40.3 Moz. Subtracting the independently rounded displayed totals gives −40.2 Moz; both are retained explicitly.
- The separate balance less ETPs is −318.4 Moz, using the report’s adjusted convention. It is not the same measure as the core deficit.
- Source years remain visible. The 2026 publication date does not make its 2025 estimates into measured 2026 outcomes.
How concentrated is world silver mine production?
USGS estimates Mexico at 6,300 tonnes, Peru at 3,600 and China at 3,400 in 2025. AMR sums them to 13,300 tonnes and divides by the rounded world estimate of 26,000 tonnes, producing a 51.1538% share. The quantities measure silver content, rather than total ore moved. USGS MCS 2026, silver, world mine table.

View chart data
USGS 2025 estimates, metric tonnes of silver content. Rounded world total: 26,000.
| Producer | Mine estimate (metric tonnes) | AMR world share (%) |
|---|---|---|
| Mexico | 6300 | 24.2308 |
| Peru | 3600 | 13.8462 |
| China | 3400 | 13.0769 |
Original AMR presentation of source facts, with estimates and independent rounding retained.
Values also appear in article HTML; no source chart is copied.
USGS, Mineral Commodity Summaries 2026, silver, page 2 USGS MCS 2026 silver
| USGS producer group | Mine output 2024 (metric tonnes silver content) | Mine output 2025 estimate (metric tonnes silver content) | AMR share of rounded 26000-tonne world total (%) | Status |
|---|---|---|---|---|
| United States | 1050 | 1100 | 4.2308 | Reported 2024; 2025 estimated |
| Argentina | 774 | 800 | 3.0769 | Reported 2024; 2025 estimated |
| Australia | 1050 | 1000 | 3.8462 | Reported 2024; 2025 estimated |
| Bolivia | 1490 | 1500 | 5.7692 | Reported 2024; 2025 estimated |
| Canada | 366 | 400 | 1.5385 | 2024 and 2025 estimated |
| Chile | 1200 | 1400 | 5.3846 | 2024 and 2025 estimated |
| China | 3430 | 3400 | 13.0769 | Reported 2024; 2025 estimated |
| India | 700 | 800 | 3.0769 | Reported 2024; 2025 estimated |
| Kazakhstan | 850 | 630 | 2.4231 | 2024 and 2025 estimated |
| Mexico | 5780 | 6300 | 24.2308 | Reported 2024; 2025 estimated |
| Peru | 3510 | 3600 | 13.8462 | Reported 2024; 2025 estimated |
| Poland | 1320 | 1300 | 5.0000 | Reported 2024; 2025 estimated |
| Russia | 1280 | 1200 | 4.6154 | Reported 2024; 2025 estimated |
| Sweden | 432 | 400 | 1.5385 | Reported 2024; 2025 estimated |
| Other countries | 2110 | 2100 | 8.0769 | Reported 2024; 2025 estimated |
| World total (rounded) | 25300 | 26000 | 100.0000 | Rounded world totals; 2025 estimated |
The source marks its 2025 production values as estimates. The table also retains the estimate flags on the named 2024 rows where USGS supplies them. A regional share calculated from these values is a source-derived estimate, rather than a new measurement by AMR.
The world denominator matters. USGS labels the total rounded, and individual country quantities are independently rounded. Their displayed sum need not equal the rounded world row exactly. AMR preserves the source denominator rather than changing a country value or inventing an additional country category to close that gap.
This is a mine-production comparison. It excludes the separate contribution of recycled material to market supply and does not rank refining capacity, trade flows or industrial silver use by country. A producer’s mine share therefore cannot automatically become its share of every stage in the silver market.
USGS also notes that much silver is obtained as a byproduct of lead-zinc, copper and gold mining. The production panel measures the silver content recovered through those operations as well as primary silver mines. It should not be interpreted as output only from mines whose principal product is silver. USGS MCS 2026, silver, World Resources discussion.
How much silver demand is industrial or photovoltaic?
The Survey reports 657.4 Moz of industrial demand within 1,130.6 Moz of total 2025 demand. AMR calculates a 58.1461% industrial share. Photovoltaics accounts for 186.6 Moz, equal to 16.5045% of total demand or 28.3845% of industrial demand. These denominators answer different questions. World Silver Survey 2026, page 9.

View chart data
2025 survey demand, million troy ounces. Bars share the total-demand denominator.
| Measure | Demand (Moz) | AMR share of total demand (%) |
|---|---|---|
| Total demand | 1130.6 | 100.0000 |
| Industrial subtotal | 657.4 | 58.1461 |
| Electrical and electronics | 449.5 | 39.7577 |
| Photovoltaics | 186.6 | 16.5045 |
Original AMR presentation of source facts, with estimates and independent rounding retained.
Values also appear in article HTML; no source chart is copied.
Metals Focus, World Silver Survey 2026, industrial rows on page 9 Metals Focus, World Silver Survey 2026, The Silver Institute
| Demand category | 2025 demand (Moz) | AMR share of published total demand (%) | Row role |
|---|---|---|---|
| Industrial (total) | 657.4 | 58.1461 | Top-level demand |
| Photography | 24.2 | 2.1405 | Top-level demand |
| Jewelry | 189.3 | 16.7433 | Top-level demand |
| Silverware | 42.1 | 3.7237 | Top-level demand |
| Coin and net bar demand | 217.7 | 19.2553 | Top-level demand |
| Net hedging demand | 0.0 | 0.0000 | Top-level demand |
| Total demand | 1130.6 | 100.0000 | Published total, not an extra category |
The complete top-level group includes industrial demand, photography, jewelry, silverware, coin and net bar demand, and net hedging demand. The reported total is therefore broader than industrial fabrication alone. Adding the total row again to the component rows would double count the market.
Within industry, electrical and electronics includes photovoltaics. Brazing alloys and solders and other industrial demand are additional industrial branches. The hierarchy table makes those relationships explicit, so a writer can quote PV’s share without adding it to the industrial subtotal a second time.
| Category | Parent category | 2025 demand (Moz) | AMR share of industrial demand (%) | AMR share of total demand (%) | Hierarchy role |
|---|---|---|---|---|---|
| Industrial (total) | Total demand | 657.4 | 100.0000 | 58.1461 | Parent subtotal |
| Electrical and electronics | Industrial (total) | 449.5 | 68.3754 | 39.7577 | Child category |
| Photovoltaics | Electrical and electronics | 186.6 | 28.3845 | 16.5045 | Nested child, already included above |
| Brazing alloys and solders | Industrial (total) | 50.5 | 7.6818 | 4.4667 | Child category |
| Other industrial | Industrial (total) | 157.4 | 23.9428 | 13.9218 | Child category |
The Survey locates fabrication where silver first becomes semifinished or finished products. That is a production-stage convention, rather than a count of every final product sold or currently operating. A regional installation statistic therefore needs compatible geography and timing before it can be joined to this material-demand measure. Survey definitions, page 88.
The 186.6 Moz quantity describes silver demand under the Survey’s PV category. It does not supply grams per solar panel, silver per watt of a particular cell technology or the quantity in installed panels still operating. Those calculations require compatible product and deployment evidence. A global fabrication quantity cannot be converted into a universal panel recipe.
The producer attributes weaker 2025 PV demand to thrifting and substitution by manufacturers, while other industrial applications continued to provide demand. That is the report’s interpretation of the annual change, rather than an AMR estimate of how much each technical change contributed. Silver Institute, April 2026 survey release.
How do mine production and recycling contribute to supply?
The Survey estimates 846.6 Moz of mine production and 197.6 Moz of recycling in 2025. Their combined 1,044.2 Moz is supplemented in its market accounting by 44.7 Moz of net hedging supply and 1.5 Moz of net official sector sales, yielding the reported 1,090.4 Moz total supply. World Silver Survey 2026, page 9.

View chart data
2025 source categories, Moz. The report also includes net hedging supply and official sales.
| Supply category | 2025 value (Moz) |
|---|---|
| Mine production | 846.6 |
| Recycling | 197.6 |
| Net hedging supply | 44.7 |
| Net official sector sales | 1.5 |
Original AMR presentation of source facts, with estimates and independent rounding retained.
Values also appear in article HTML; no source chart is copied.
Metals Focus, World Silver Survey 2026, supply rows on page 9 Metals Focus, World Silver Survey 2026, The Silver Institute
| Year | Mine production (Moz) | Recycling (Moz) | Net hedging supply (Moz) | Net official sector sales (Moz) | Published total supply (Moz) |
|---|---|---|---|---|---|
| 2021 | 825.4 | 191.8 | 0.0 | 1.5 | 1018.7 |
| 2022 | 833.7 | 194.6 | 0.0 | 1.7 | 1030.1 |
| 2023 | 810.7 | 184.6 | 0.0 | 1.6 | 997.0 |
| 2024 | 823.6 | 194.5 | 0.0 | 1.5 | 1019.6 |
| 2025 | 846.6 | 197.6 | 44.7 | 1.5 | 1090.4 |
Recycling’s share depends on the denominator. AMR calculates 197.6 / (846.6 + 197.6) × 100 = 18.9236% of the two named mine-plus-recycling flows. This is a contribution to that supply grouping. It does not measure the percentage of end-of-life silver products collected or the recovery efficiency of a recycling plant.
The source’s definition is more specific than all scrap returned to a factory. Survey recycling covers silver recovered from fabricated products, including unused trade stocks, and excludes production or process scrap generated during manufacturing. It normally records recycling where scrap arises rather than where it is refined, with a stated exception for ethylene oxide recovery. World Silver Survey 2026, Notes & Definitions, page 88.
That boundary prevents an overstated recycling total. Adding a separate manufacturing-scrap figure to the Survey’s recycling series would create a new measure requiring its own compatible definition. It should not silently be presented as the published recycling series.
The supply bridge also distinguishes a market-accounting category from new mine output. Net hedging supply is separately recorded by the Survey; it is not another mining country or additional ore extraction. The complete source convention should be retained when discussing its total supply and market balance.
What does the reported silver market deficit measure?
The Survey’s reported 2025 balance is −40.3 Moz, comparing its annual supply and demand framework. Subtracting the displayed total supply of 1,090.4 Moz from total demand of 1,130.6 Moz gives a 40.2 Moz shortfall. AMR retains that rounded-input calculation separately from the published balance. World Silver Survey 2026, page 9.

View chart data
Published survey balances, Moz. Same 2026 edition for all five years.
| Year | Published balance (Moz) | AMR rounded-total difference (Moz) |
|---|---|---|
| 2021 | -83.7 | -83.7 |
| 2022 | -254.0 | -254.0 |
| 2023 | -200.1 | -200.0 |
| 2024 | -137.9 | -137.8 |
| 2025 | -40.3 | -40.2 |
Original AMR presentation of source facts, with estimates and independent rounding retained.
Values also appear in article HTML; no source chart is copied.
Metals Focus, World Silver Survey 2026, market balance row on page 9 Metals Focus, World Silver Survey 2026, The Silver Institute
| Year | Mine production (Moz) | Recycling (Moz) | Published total supply (Moz) | Published total demand (Moz) | Published market balance (Moz) | AMR difference of rounded totals (Moz) | Published balance minus AMR difference (Moz) |
|---|---|---|---|---|---|---|---|
| 2021 | 825.4 | 191.8 | 1018.7 | 1102.4 | -83.7 | -83.7 | 0.0 |
| 2022 | 833.7 | 194.6 | 1030.1 | 1284.1 | -254.0 | -254.0 | 0.0 |
| 2023 | 810.7 | 184.6 | 997.0 | 1197.0 | -200.1 | -200.0 | -0.1 |
| 2024 | 823.6 | 194.5 | 1019.6 | 1157.4 | -137.9 | -137.8 | -0.1 |
| 2025 | 846.6 | 197.6 | 1090.4 | 1130.6 | -40.3 | -40.2 | -0.1 |
The source explicitly says totals may not add because of independent rounding. AMR does not insert a fictitious balancing supply item or modify a demand category to make the published −40.3 exactly match the subtraction of rounded totals. Both quantities remain reproducible on their stated bases.
For scale, the magnitude of the reported deficit equals 4.7602% of the same Survey’s 846.6 Moz mine-production estimate. That is an annual flow comparison. It does not mean 4.7602% of all silver above ground was used up, because mine flow and above-ground stock are different denominators.
AMR also sums the five published 2021 to 2025 balances to −716.0 Moz. The operation aggregates annual reported balances over that period. It does not measure all global inventory changes, identify where metal was held or state the quantity still available at the end of 2025.
A global annual balance is also distinct from the availability of a particular product, location or delivery date. It cannot establish that every buyer experienced a shortage, that every warehouse was depleted or that price must follow a fixed path. Those conclusions require additional evidence beyond the annual totals.
Why do USGS and the Survey show different mine totals?
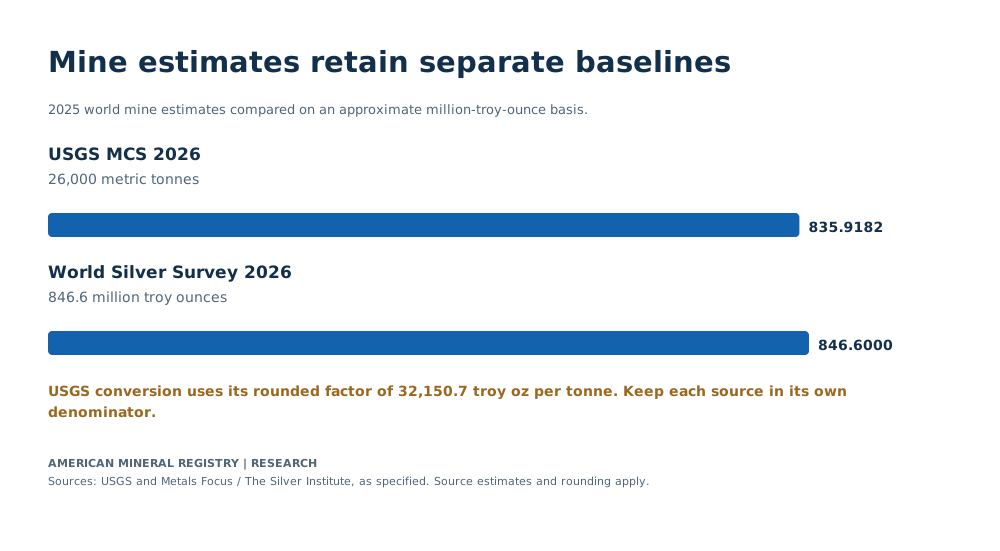
USGS’s rounded 2025 world estimate is 26,000 metric tonnes, while the Survey reports 846.6 Moz. Using USGS’s own rounded conversion factor gives approximately 835.9182 Moz for its tonne estimate. Converting units makes the comparison legible; it does not make the two source estimates identical. USGS MCS 2026, page 2 and note 1, World Silver Survey 2026, page 9.

View chart data
2025 world mine estimates compared on an approximate million-troy-ounce basis.
| Source | Original value and unit | AMR comparison basis (Moz) |
|---|---|---|
| USGS MCS 2026 | 26,000 metric tonnes | 835.9182 |
| World Silver Survey 2026 | 846.6 million troy ounces | 846.6000 |
Original AMR presentation of source facts, with estimates and independent rounding retained.
Values also appear in article HTML; no source chart is copied.
USGS silver summary and World Silver Survey 2026 USGS MCS 2026 silver Metals Focus, World Silver Survey 2026, The Silver Institute
| Source edition | Observation year | Original published value | Original unit | AMR comparison basis (Moz) | Source boundary |
|---|---|---|---|---|---|
| USGS MCS 2025 | 2024 | 25000 | Metric tonnes silver content | 803.7675 | 2024 estimate in January 2025 edition |
| USGS MCS 2026 | 2024 | 25300 | Metric tonnes silver content | 813.4127 | Same 2024 observation year in February 2026 edition |
| USGS MCS 2026 | 2025 | 26000 | Metric tonnes silver content | 835.9182 | 2025 estimate; rounded world total |
| World Silver Survey 2026 | 2024 | 823.6 | Million troy ounces | 823.6000 | 2024 estimate in the 2026 survey |
| World Silver Survey 2026 | 2025 | 846.6 | Million troy ounces | 846.6000 | 2025 estimate in the 2026 survey |
Primary source · Primary source · Primary source · Download matching CSV
The publications have different source vintages and rounded estimates. The comparison does not establish that one difference is entirely a unit error or entirely a measured change in production. AMR preserves both estimates and their original scope rather than manufacturing a single supposedly exact global observation.
The conversion itself also has a precision boundary. USGS supplies 32,150.7 troy ounces per metric tonne. The Survey’s units note gives a more detailed rounded factor and defines its ounce as a troy ounce. Additional conversion decimals trace arithmetic from those factors; they do not improve the precision of a rounded 26,000-tonne mine estimate. World Silver Survey 2026, page 88.
Source revisions create another distinct comparison. USGS MCS 2025 estimated world 2024 mine production at 25,000 tonnes. MCS 2026 gives 25,300 tonnes for that same 2024 year, a 1.2% increase between editions by AMR calculation. That is a revision to a historical observation, rather than growth from 2024 to 2025. USGS MCS 2025, silver, page 2.
A practical rule follows: use one source’s matched components for a balance, and one edition for a historical trend. Substituting the converted USGS mine estimate into the Survey’s other supply and demand rows would create a hybrid calculation that neither producer published.
Does a deficit identify how much silver remains above ground?
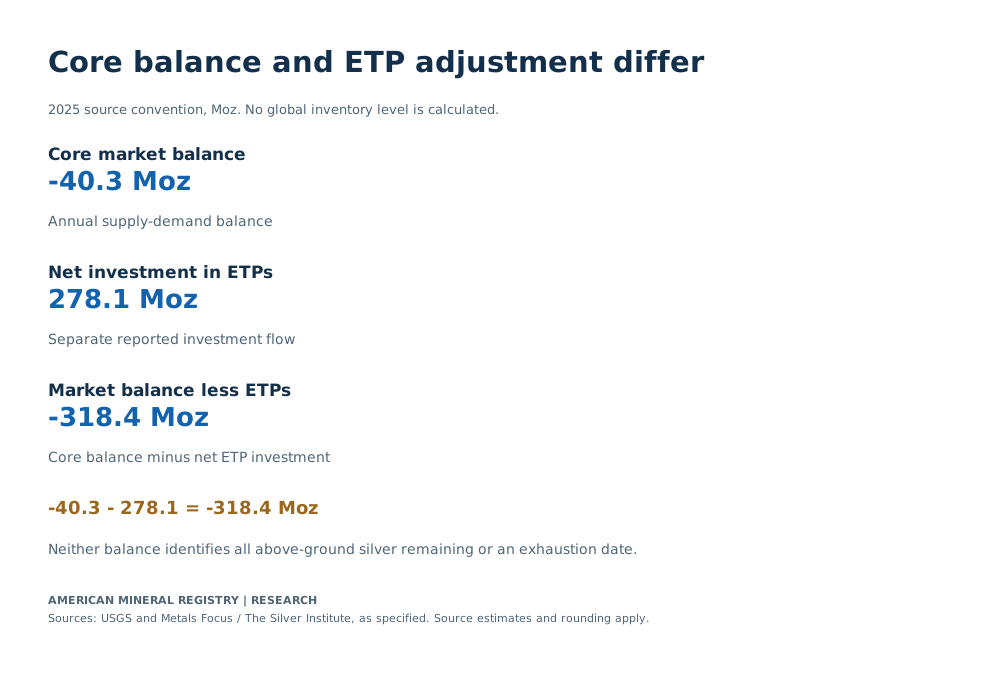
An annual deficit does not identify a dated global stock. The Survey separately reports 2025 net investment in exchange-traded products at 278.1 Moz and a market balance less ETPs of −318.4 Moz. Its core balance, ETP flow and adjusted balance are different measures. World Silver Survey 2026, page 9.

View chart data
2025 source convention, Moz. No global inventory level is calculated.
| Measure | 2025 value (Moz) | Meaning |
|---|---|---|
| Core market balance | -40.3 | Annual supply-demand balance |
| Net investment in ETPs | 278.1 | Separate reported investment flow |
| Market balance less ETPs | -318.4 | Core balance minus net ETP investment |
Original AMR presentation of source facts, with estimates and independent rounding retained.
Values also appear in article HTML; no source chart is copied.
Metals Focus, World Silver Survey 2026, balance and ETP rows on page 9 Metals Focus, World Silver Survey 2026, The Silver Institute
A flow covers an interval; a stock is defined at a date. To calculate a stock from flows, an analyst also needs an appropriate opening stock and a complete, compatible accounting framework. An annual supply-demand difference supplies neither of those conditions by itself.
The ETP-adjusted figure illustrates why the definition must travel with the number. Calling both −40.3 and −318.4 the same market deficit would erase the adjustment. Adding both figures together would also combine a core measure with another measure that already incorporates it.
Inventory coverage matters independently of arithmetic. A dated quantity held under one defined reporting scope cannot automatically be relabeled all silver above ground or all metal immediately available for sale. This reference makes no exhaustion-date calculation from an annual balance or selected inventory category.
| Measure | Meaning | Population or denominator | Reuse boundary |
|---|---|---|---|
| Mine production | Annual silver-content flow | USGS estimates in metric tonnes or Survey estimates in Moz | Keep source and vintage; not ore mass or total market supply |
| Survey recycling | Silver recovered from fabricated products, including unused trade stocks | Annual flow; source excludes manufacturing/process scrap | Not a collection rate or the share of every metal product recycled |
| Industrial demand | Survey industrial subtotal | Includes electrical/electronics, brazing/solders and other industrial | PV is already within electrical/electronics and industrial |
| Net hedging supply | Source market-accounting supply category | Part of Survey Total Supply | Not additional mine production |
| Market balance | Reported annual supply-demand balance | Survey convention before separate ETP adjustment | A deficit is not a dated global inventory quantity |
| Net ETP investment | Net annual exchange-traded-product investment flow | Reported separately from the core demand/balance panel | Do not describe it as the same measure as the core deficit |
| Market balance less ETPs | Reported balance minus net ETP investment | Source adjusted annual measure | Not an estimate of all silver above ground |
| Above-ground stock | Quantity held at a specified date under a defined coverage | A stock measure, requiring its own starting level and flows | Annual balances alone do not identify total stock or an exhaustion date |
| Troy ounces and metric tonnes | Distinct reporting units for silver content | Survey notes: 1 troy oz = 31.10348 g; USGS note 1:1 tonne = 32,150.7 troy oz | Rounded source conversion factors do not create extra measurement precision |
| AMR comparison | Input A | Input B or operation | AMR result | Unit and denominator | Limit |
|---|---|---|---|---|---|
| Top-three USGS mine share | 6300 + 3600 + 3400 | 26000 | 51.1538 | Percent of rounded 2025 world mine estimate | Mexico, Peru, China; no survey denominator substituted |
| Industrial share of total demand | 657.4 | 1130.6 | 58.1461 | Percent of 2025 total demand | Industrial subtotal, not all fabrication categories |
| PV share of total demand | 186.6 | 1130.6 | 16.5045 | Percent of 2025 total demand | PV is nested within industrial demand |
| PV share of industrial demand | 186.6 | 657.4 | 28.3845 | Percent of 2025 industrial demand | Different denominator from total demand |
| Recycling share of mine plus recycling | 197.6 | 846.6 + 197.6 | 18.9236 | Percent of the two named 2025 supply flows | Not an end-of-life recycling efficiency |
| Reported deficit equivalent to mine flow | 40.3 | 846.6 | 4.7602 | Percent of 2025 survey mine production | A scale comparison of annual flows, not stocks |
| Sum of reported 2021 to 2025 balances | -83.7 - 254.0 - 200.1 - 137.9 - 40.3 | Sum | -716.0 | Moz across the five annual balances | Not a dated inventory level or measured global stock decline |
| 2025 balance less ETPs | -40.3 | - 278.1 | -318.4 | Moz, source adjusted-balance convention | Net ETP investment is a separate reported flow |
| Same 2024 USGS world revision | 25000 | 25300 | 1.2000 | Percent revision across source editions | Not growth from 2024 to 2025 |
Primary source · Primary source · Primary source · Download matching CSV
How should these statistics be quoted?
Credit USGS for its estimated silver-content production and Metals Focus/The Silver Institute for the Survey estimates. Attribute the stated shares, conversions and comparisons to AMR. Keep the year, source edition, unit, numerator and denominator together. For demand, preserve PV’s nesting; for balances, preserve the annual flow and ETP conventions.
Frequently asked questions
Is PV demand additional to industrial demand?
PV is included within electrical and electronics, which is included within industrial demand. Adding PV to the industrial subtotal would count the same source quantity twice.
Does recycled supply measure a plant recovery rate?
It is a global flow under the Survey’s recycling definition. A process recovery rate needs material entering and leaving a defined process; those inputs are not the denominator used here.
Can the five annual deficits be treated as current inventory?
Their sum is an aggregation of reported annual balances. It does not provide a starting stock, complete inventory coverage or a dated current quantity.
Are the report’s 2026 forecasts observed 2026 data?
The Survey labels its forecast column 2026F. This reference’s demand and balance comparisons use the historical 2025 and 2021 to 2025 columns instead.
Does mine production mean all the ore extracted?
USGS reports metric tonnes of silver content in this table. Ore mass, mining waste, reserves, resources and recycled supply require separate quantities and definitions.
Methodology and Sources
AMR inspected the original public USGS silver summaries for MCS 2026 and MCS 2025 and the producer’s original World Silver Survey 2026. The mine panel includes all named producer groups, other countries and the rounded world total. Only production fields are used; unavailable reserve fields are not converted into zeros.
Survey demand hierarchies and supply/balance groups follow the annual table on printed page 9, PDF page 11. Definitions and units follow printed page 88. The dataset selects complete groups needed for this question, preserves independently rounded inputs and excludes forecasts from historical comparisons. Original source archives and precise review receipts were retained.
AMR calculates ratios with the appropriate published denominator, changes between matched source values, approximate unit conversions and the explicit annual balance/ETP arithmetic. Four decimal places make calculations reproducible, rather than implying more accurate original measurements. The source-cell ledger identifies the original page, row, column, unit and qualification for every table cell. The supplied Python program reads the matching CSVs and tests the calculations without needing private source files.
Glossary
- Moz. Million troy ounces, the Survey’s market-table quantity unit.
- Silver content. The quantity of silver in a reported production flow, distinct from ore mass.
- Industrial subtotal. The parent demand category containing electrical/electronics, brazing/solders and other industrial uses.
- PV. Photovoltaics, nested within the electrical/electronics demand category.
- Recycling. The Survey’s recovery flow from fabricated products and unused trade stocks, excluding manufacturing/process scrap.
- Market balance. The source’s annual supply-demand comparison under its stated convention.
- ETP. Exchange-traded product; net investment is separately identified in the Survey’s balance panel.
- Source vintage. The report edition supplying an estimate, including any historical revisions.
Sources
- USGS MCS 2026, silver, USGS MCS 2025, silver. World mine tables and units, page 2.
- Metals Focus, World Silver Survey 2026, The Silver Institute. Supply, demand and balance table, printed page 9; Notes & Definitions, page 88.
- Silver Institute, April 15, 2026 producer release. Public corroboration and attributed interpretation of the reported annual changes.