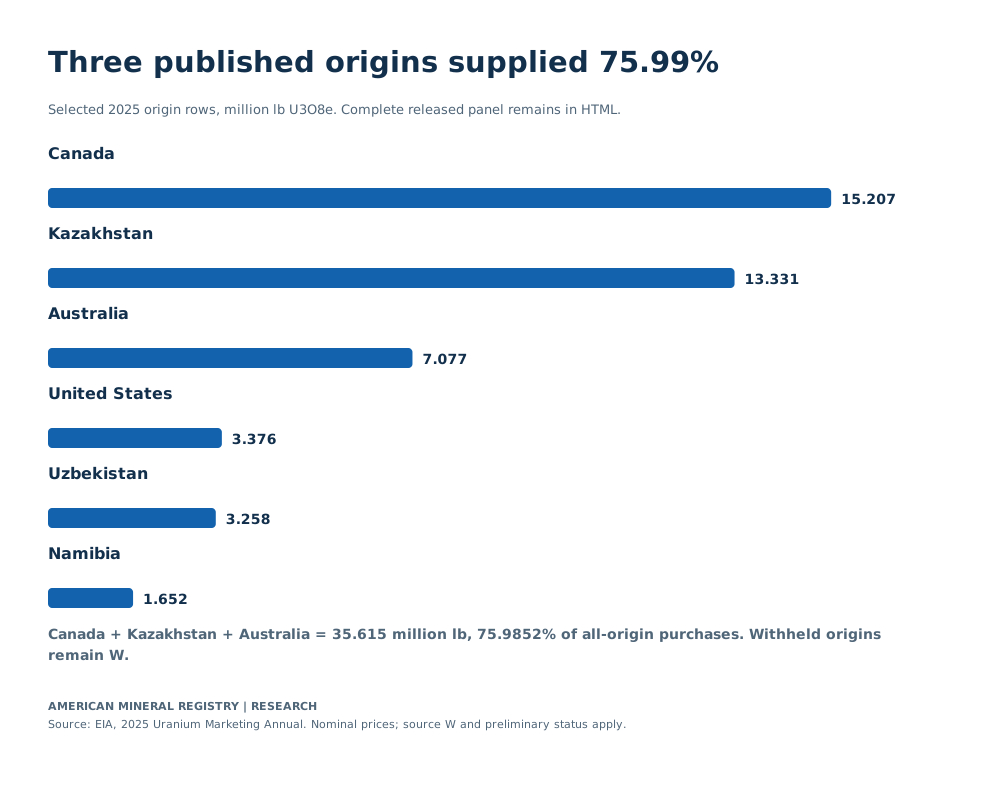
Foreign-origin uranium accounted for 43.495 million pounds of the 2025 total, or 92.7973% by AMR calculation. Canada, Kazakhstan and Australia together supplied 35.615 million pounds, about 75.99% of all-origin delivered purchases. Origin, supplier location, enrichment services and fuel loading remain separate classifications. A country’s share of purchased enrichment work cannot be substituted for its share of uranium-origin volume. EIA, Tables 2 and 3, country-origin table.
AMR’s contribution is a complete comparison of the released origin groups and country panel, matched contract-price rows, and fuel-stage denominators, with reproducible shares and changes. The evidence is EIA’s 2025 report, released in 2026 and revised on August 13. The page date records this compilation; each table retains its observation year and confidentiality or preliminary status.
Key Takeaways
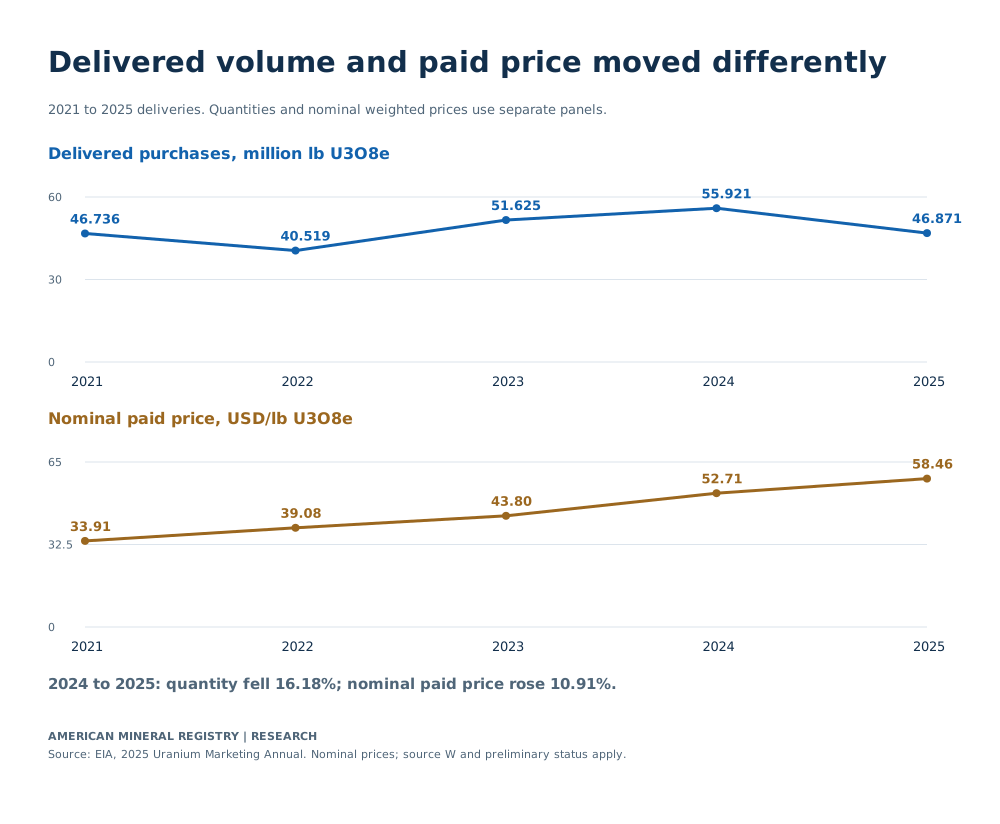
- Delivered purchases fell 16.1835% from 2024 to 2025, while the nominal weighted-average paid price rose 10.9087%, by AMR calculation.
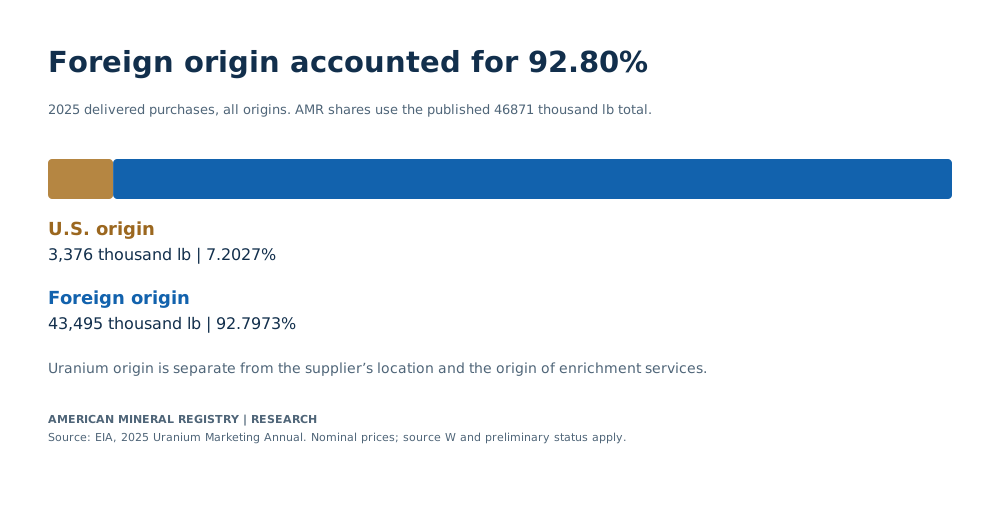
- 92.7973% of 2025 purchases were foreign-origin, calculated from the published origin aggregate and all-origin total.
- Canada, Kazakhstan and Australia together supplied 75.9852% of delivered purchases, using their public country rows.
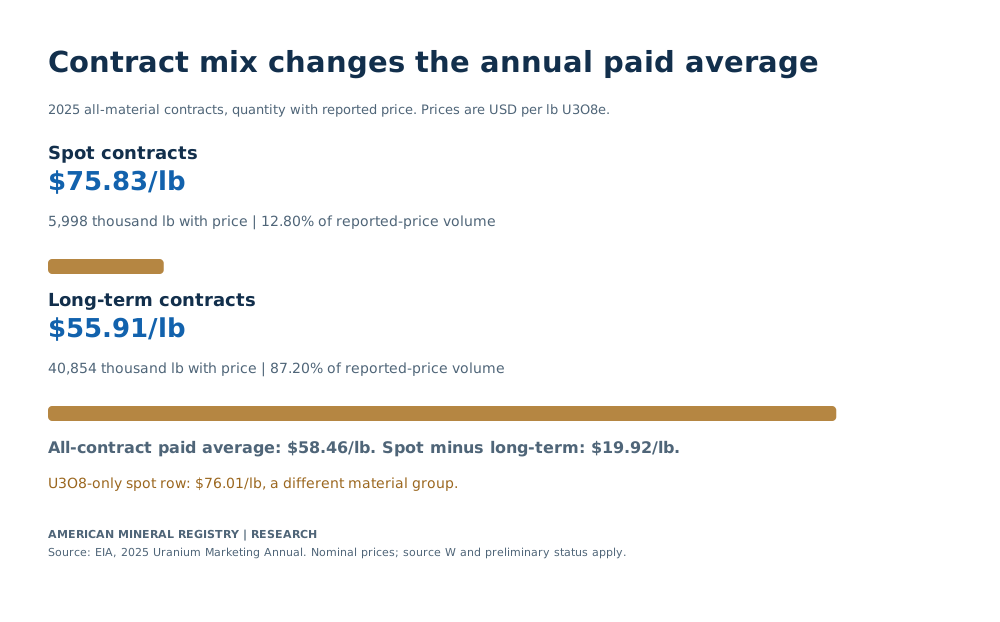
- All-material spot contracts averaged $75.83/lb in 2025, compared with $55.91 for long-term contracts in the same table. The $76.01 spot figure belongs to the U3O8-only material row.
- The matched contract-price difference was $19.92/lb, a 35.6287% premium to the long-term paid price, by AMR calculation.
- Natural feed, purchased enrichment work and new fuel loading use different measures. Pounds U3O8 equivalent and separative work units are not interchangeable.
- W remains withheld. No country or material quantity is reconstructed from a residual, and source zeros remain distinct from W.
- 2025 new fuel loading is preliminary. The source identifies 2024 loading as final in this edition.
How did delivered uranium purchases and paid prices change?
EIA reports 46.871 million pounds U3O8 equivalent of purchases for 2025 delivery, down from 55.921 million in 2024, while the nominal weighted-average price rose from $52.71 to $58.46/lb. AMR calculates a 16.1835% volume decrease and a 10.9087% price increase from those same-edition annual values. EIA, Table 1, total purchases and weighted-average price.

View chart data
2021 to 2025 deliveries. Quantities and nominal weighted prices use separate panels.
| Delivery year | Purchases (million lb U3O8e) | Paid price (USD/lb U3O8e) |
|---|---|---|
| 2021 | 46.736 | 33.91 |
| 2022 | 40.519 | 39.08 |
| 2023 | 51.625 | 43.80 |
| 2024 | 55.921 | 52.71 |
| 2025 | 46.871 | 58.46 |
Source quantities are independently rounded. AMR arithmetic does not recover original precision.
Delivery, feed, service and loading measures retain their distinct units and populations.
EIA, 2025 Uranium Marketing Annual, Table 1 EIA 2025 Uranium Marketing Annual, Table 1
| Delivery year | Purchases (thousand lb U3O8e) | Weighted-average paid price (USD per lb U3O8e) | Scope |
|---|---|---|---|
| 2021 | 46736 | 33.91 | Delivery-year purchases; nominal weighted-average uranium price |
| 2022 | 40519 | 39.08 | Delivery-year purchases; nominal weighted-average uranium price |
| 2023 | 51625 | 43.80 | Delivery-year purchases; nominal weighted-average uranium price |
| 2024 | 55921 | 52.71 | Delivery-year purchases; nominal weighted-average uranium price |
| 2025 | 46871 | 58.46 | Delivery-year purchases; nominal weighted-average uranium price |
The reporting year is a delivery year. Uranium delivered in 2025 may have been purchased under agreements signed earlier. A purchase-contract signing count, future contracted delivery schedule and completed delivery quantity therefore answer different questions. This table follows EIA’s delivered-purchase series throughout, with the same civilian reactor owner/operator population and equivalent-unit basis.
The price is weighted by reported uranium quantities. It describes what the reporting buyers paid across the relevant annual mix. Differences across years can reflect different contracts, material forms, suppliers and delivery quantities. The increase should not be described as the price change on an unchanged basket of identical contracts. Nor does a price reported for delivery during 2025 specify the quotation available to a buyer today.
EIA explicitly states that these prices are not adjusted for inflation. The five-year series is consequently a nominal comparison. It is useful for describing the paid dollar amounts reported in each year, while a real purchasing-power comparison would require an additional inflation method and reference year. AMR does not silently mix nominal and inflation-adjusted prices.
The same source edition supplies all five years. This avoids turning differences between successive report vintages into an apparent annual market change. EIA’s August 2026 revision notice also identifies corrections, including updated Table 2 values in the full report. AMR uses the currently offered tables and records their source files and cells. EIA, revision notice.
For reuse, preserve the full phrase “uranium purchased for delivery to owners and operators of U.S. civilian nuclear power reactors”. Shortening that to U.S. mine production, national uranium consumption or fuel loaded would change the population or stage. The annual volume and paid-price comparison is complete within its purchasing boundary.
How much purchased uranium was domestic or foreign-origin?
In 2025, EIA reports 3.376 million pounds of U.S.-origin uranium and 43.495 million pounds of foreign-origin uranium within the 46.871 million-pound total. AMR calculates shares of 7.2027% and 92.7973% respectively. These are reported material-origin categories, rather than supplier-location categories. EIA, Table 2.

View chart data
2025 delivered purchases, all origins. AMR shares use the published 46871 thousand lb total.
| Uranium origin | Purchases (thousand lb U3O8e) | AMR share (%) |
|---|---|---|
| U.S. origin | 3376 | 7.2027 |
| Foreign origin | 43495 | 92.7973 |
Source quantities are independently rounded. AMR arithmetic does not recover original precision.
Delivery, feed, service and loading measures retain their distinct units and populations.
EIA, 2025 Uranium Marketing Annual, Table 2 EIA 2025 Uranium Marketing Annual, Table 2
| Delivery year | Origin group | Purchases (thousand lb U3O8e) | Weighted-average paid price (USD per lb U3O8e) | AMR share of published all-origin purchases (%) |
|---|---|---|---|---|
| 2021 | U.S. origin | 2474 | 43.04 | 5.2936 |
| 2021 | Foreign origin | 44263 | 33.40 | 94.7086 |
| 2021 | Total | 46736 | 33.91 | 100.0000 |
| 2022 | U.S. origin | W | W | W |
| 2022 | Foreign origin | W | W | W |
| 2022 | Total | 40519 | 39.08 | 100.0000 |
| 2023 | U.S. origin | 2386 | 40.63 | 4.6218 |
| 2023 | Foreign origin | 49239 | 43.95 | 95.3782 |
| 2023 | Total | 51625 | 43.80 | 100.0000 |
| 2024 | U.S. origin | 4331 | 42.17 | 7.7449 |
| 2024 | Foreign origin | 51590 | 53.60 | 92.2551 |
| 2024 | Total | 55921 | 52.71 | 100.0000 |
| 2025 | U.S. origin | 3376 | 44.97 | 7.2027 |
| 2025 | Foreign origin | 43495 | 59.51 | 92.7973 |
| 2025 | Total | 46871 | 58.46 | 100.0000 |
The historical group preserves the release exactly where it withholds a field. Table 2 marks its 2022 domestic and foreign quantities and prices W. AMR retains those cells and their derived-share flags as W. A blank, a zero and a withheld value have different meanings; none should be substituted for another to draw a continuous line or calculate a missing share.
Source quantities are also independently rounded. Their displayed components need not reproduce every published total exactly. AMR uses the reported all-origin total as the share denominator and preserves the original components. It does not change a source row to make a selected sum balance or use a total to solve a suppressed component.
Supplier location provides a separate comparison. Table 1 reports 45.092 million pounds purchased from foreign suppliers for 2025 delivery, while Table 2 reports 43.495 million pounds of foreign-origin material. The labels differ because a seller’s location or category and the uranium’s reported origin are different classifications. A U.S. supplier can sell foreign-origin uranium. EIA, Table 1, Table 2.
| Delivery year | Purchases from foreign suppliers (thousand lb U3O8e) | Foreign-origin purchases (thousand lb U3O8e) | Classification |
|---|---|---|---|
| 2021 | 41583 | 44263 | Supplier location and uranium origin are different classifications |
| 2022 | 38009 | W | Supplier location and uranium origin are different classifications |
| 2023 | 49622 | 49239 | Supplier location and uranium origin are different classifications |
| 2024 | 54551 | 51590 | Supplier location and uranium origin are different classifications |
| 2025 | 45092 | 43495 | Supplier location and uranium origin are different classifications |
Primary source · Primary source · Primary source · Primary source · Download matching CSV
These two annual quantities do not provide the complete cross-tabulation of material origin by seller. Their difference cannot identify the exact domestic-origin material purchased from a particular supplier class. A claim about that intersection would require the corresponding joint data, rather than subtraction between two differently classified summaries.
The origin share likewise does not measure the fraction of current U.S. reactor fuel requirements met by mines operating during the same year. Deliveries can draw on material acquired or processed earlier. A mine-output comparison would need its own timing, product basis and denominator. This reference describes the origin of delivered purchases under EIA’s survey definitions.
Which reported origins supplied uranium for 2025 delivery?
Canada, Kazakhstan and Australia supplied 15.207, 13.331 and 7.077 million pounds U3O8 equivalent respectively in EIA’s 2025 origin panel. AMR sums those public rows to 35.615 million pounds, or 75.9852% of all-origin purchases. The full released panel below preserves every origin label, confidentiality flag and published subtotal. EIA, Table 3.

View chart data
Selected 2025 origin rows, million lb U3O8e. Complete released panel remains in HTML.
| Published origin | Quantity (million lb U3O8e) |
|---|---|
| Canada | 15.207 |
| Kazakhstan | 13.331 |
| Australia | 7.077 |
| United States | 3.376 |
| Uzbekistan | 3.258 |
| Namibia | 1.652 |
Source quantities are independently rounded. AMR arithmetic does not recover original precision.
Delivery, feed, service and loading measures retain their distinct units and populations.
EIA, 2025 Uranium Marketing Annual, Table 3 EIA 2025 Uranium Marketing Annual, Table 3
| Reported origin label | Row role | 2025 purchases (thousand lb U3O8e) | Weighted-average paid price (USD per lb U3O8e) | AMR share of all-origin purchases (%) |
|---|---|---|---|---|
| Australia | Origin label | 7077 | 64.24 | 15.0989 |
| Austria | Origin label | 0 | 0.00 | 0.0000 |
| Canada | Origin label | 15207 | 56.95 | 32.4444 |
| China | Origin label | 0 | 0.00 | 0.0000 |
| Czech Republic | Origin label | 0 | 0.00 | 0.0000 |
| European Union | Origin label | 0 | 0.00 | 0.0000 |
| France | Origin label | 0 | 0.00 | 0.0000 |
| Gambia | Origin label | 0 | 0.00 | 0.0000 |
| Germany | Origin label | 0 | 0.00 | 0.0000 |
| Japan | Origin label | W | W | W |
| Kazakhstan | Origin label | 13331 | 57.92 | 28.4419 |
| Malawi | Origin label | 73 | 88.32 | 0.1557 |
| Namibia | Origin label | 1652 | 64.39 | 3.5246 |
| Niger | Origin label | 213 | 40.37 | 0.4544 |
| Nigeria | Origin label | W | W | W |
| Russia | Origin label | W | W | W |
| Saudi Arabia | Origin label | 0 | 0.00 | 0.0000 |
| South Africa | Origin label | W | W | W |
| Ukraine | Origin label | 1056 | 55.34 | 2.2530 |
| United Kingdom | Origin label | W | W | W |
| Uzbekistan | Origin label | 3258 | 61.44 | 6.9510 |
| unknown | Origin label | W | W | W |
| Total Foreign | Foreign aggregate | 43495 | 59.51 | 92.7973 |
| United States | Origin label | 3376 | 44.97 | 7.2027 |
| Total Purchases | All-origin total | 46871 | 58.46 | 100.0000 |
The combined share uses only three public numerator cells and the public all-origin denominator. It does not depend on assigning any quantity to a withheld country. This makes the calculation reproducible while respecting the source’s disclosure boundary. The extra decimal places express arithmetic from displayed quantities; they do not increase the precision of the original survey estimates.
Several released origin labels contain W. Those entries remain in the table so that a reader can distinguish an unreported quantity from a published zero. AMR does not rank a W entry as absent, group it into an invented numeric residual or infer its value from the known total. A chart of selected public origins should therefore remain labeled as a selected comparison.
The source also includes regional or unspecified labels alongside countries. AMR retains those original labels rather than assigning them to a guessed country. The row-role column distinguishes individual origin labels from the foreign aggregate and all-origin total. Adding every displayed row together would double count the published subtotals.
The price column requires the same care. It reports weighted-average paid uranium prices for the corresponding origin row. A displayed $0.00 on a source-zero purchase row is not a paid price observation. It does not establish that a positive quantity of uranium traded at zero price. A W price is withheld, not zero. These conventions matter when importing the table into another calculation.
Finally, this country panel describes delivered purchases within the reported buyer population. It does not rank all global uranium production, identify the location of every intermediate processing step or establish the origin of purchased enrichment work. Each of those questions would need the appropriate source table and denominator. EIA’s uranium-origin and service-origin panels remain separate below.
How do spot and long-term paid contract prices compare?
For the all-material total in Table 7, EIA reports 2025 weighted-average paid prices of $75.83/lb U3O8 equivalent under spot contracts and $55.91 under long-term contracts. AMR calculates a $19.92/lb difference and a 35.6287% premium to the long-term paid price. The comparison uses the same material total and delivery year. EIA, Table 7.

View chart data
2025 all-material contracts, quantity with reported price. Prices are USD per lb U3O8e.
| Contract group | Price-reported quantity (thousand lb U3O8e) | Paid price (USD/lb U3O8e) | AMR quantity share (%) |
|---|---|---|---|
| Spot | 5998 | 75.83 | 12.8020 |
| Long-term | 40854 | 55.91 | 87.1980 |
| All contracts | 46852 | 58.46 | 100.0000 |
Source quantities are independently rounded. AMR arithmetic does not recover original precision.
Delivery, feed, service and loading measures retain their distinct units and populations.
EIA, 2025 Uranium Marketing Annual, Table 7, Total material row EIA 2025 Uranium Marketing Annual, Table 7
| Contract group | Quantity with reported price (thousand lb U3O8e) | Weighted-average paid price (USD per lb U3O8e) | AMR share of price-reported quantity (%) | Coverage |
|---|---|---|---|---|
| Spot | 5998 | 75.83 | 12.8020 | All material types; quantity with reported price only |
| Long-term | 40854 | 55.91 | 87.1980 | All material types; quantity with reported price only |
| All contracts | 46852 | 58.46 | 100.0000 | All material types; quantity with reported price only |
The denominator is quantity with reported price. The displayed all-material contract quantities are 5.998 million pounds for spot and 40.854 million for long-term, within a 46.852 million-pound reported-price total. AMR calculates the spot share at 12.8020% using those displayed quantities. The coverage should remain attached rather than assuming this table’s quantity field is identical to every total-purchase field elsewhere in the report.
The distinction between material rows resolves another common quotation problem. Table 7 reports $76.01/lb for spot purchases in the U3O8-only row, compared with $75.83 in the all-material total. Both are source values, with different material coverage. A matched contract comparison either keeps both prices within the U3O8 row or keeps both within the all-material total. AMR uses the latter for its principal finding.
| Material type | Spot quantity with price (thousand lb U3O8e) | Spot paid price (USD per lb U3O8e) | Long-term quantity with price (thousand lb U3O8e) | Long-term paid price (USD per lb U3O8e) | All-contract quantity with price (thousand lb U3O8e) | All-contract paid price (USD per lb U3O8e) |
|---|---|---|---|---|---|---|
| U3O8 | 5680 | 76.01 | 29939 | 54.98 | 35619 | 58.33 |
| Natural UF6 | W | W | W | W | W | W |
| Enriched Uranium | W | W | W | W | W | W |
| Total | 5998 | 75.83 | 40854 | 55.91 | 46852 | 58.46 |
EIA defines spot contracts as usually involving a one-time delivery within one year of contract execution. Long-term contracts involve one or more deliveries after a year following execution. These are the source’s contract classifications; the annual paid averages are not the same metric as a live commodity quotation. Earlier execution dates and different delivery arrangements can contribute to the mix reported in a particular year.
The all-contract paid average is $58.46/lb in this table. Because most price-reported quantity falls in the long-term group, an unweighted average of the two contract prices would not reproduce the annual paid average. AMR’s reproduction checks the quantity-weighted calculation using the displayed rounded inputs, without claiming to recover unrounded transaction data.
Material form also changes the scope of a price. The source says the natural and enriched UF6 quantities and prices represent their U3O8-equivalent uranium component and exclude conversion and enrichment service components. The quoted dollars per pound therefore do not establish the full price of a finished fuel assembly or the total cost of generating electricity. Separate service prices use their own units.
What do purchases, natural feed and fuel loading measure?
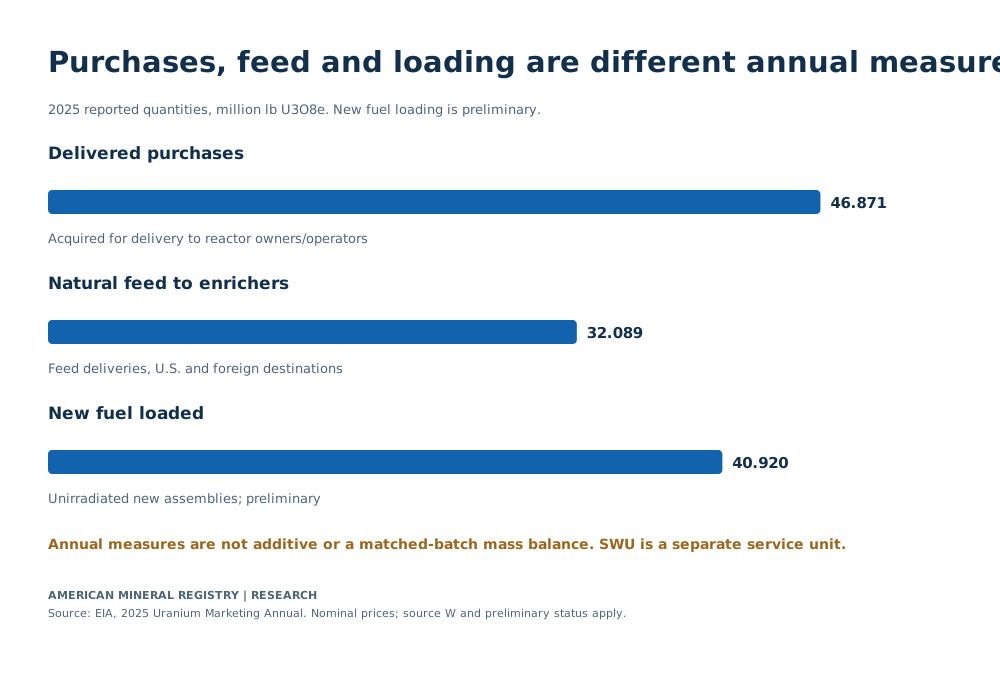
In 2025, EIA reports 46.871 million pounds of delivered purchases, 32.089 million pounds of natural uranium feed delivered for enrichment, and 40.920 million pounds in new fuel assemblies loaded. All three use U3O8-equivalent reporting, but they describe different annual activities. The 2025 fuel-loading value is preliminary. EIA, Table 1, Table 13, Table 18.

View chart data
2025 reported quantities, million lb U3O8e. New fuel loading is preliminary.
| Annual measure | Quantity (million lb U3O8e) | Boundary |
|---|---|---|
| Delivered purchases | 46.871 | Acquired for delivery to reactor owners/operators |
| Natural feed to enrichers | 32.089 | Feed deliveries, U.S. and foreign destinations |
| New fuel loaded | 40.920 | Unirradiated new assemblies; preliminary |
Source quantities are independently rounded. AMR arithmetic does not recover original precision.
Delivery, feed, service and loading measures retain their distinct units and populations.
EIA, 2025 Uranium Marketing Annual, Tables 1, 13 and 18 EIA 2025 Uranium Marketing Annual, Table 1 EIA 2025 Uranium Marketing Annual, Table 13 EIA 2025 Uranium Marketing Annual, Table 18
| Year | Delivered purchases (thousand lb U3O8e) | Natural uranium feed delivered for enrichment (thousand lb U3O8e) | New fuel loaded (thousand lb U3O8e) | Fuel-loading status |
|---|---|---|---|---|
| 2023 | 51625 | 33500 | 46112 | Reported historical values |
| 2024 | 55921 | 42299 | 48140 | 2024 fuel loading final in this edition |
| 2025 | 46871 | 32089 | 40920 | Preliminary fuel loading |
Primary source · Primary source · Primary source · Download matching CSV
U3O8 equivalent is a common reporting basis for the uranium component of different material forms. It allows the survey to express several transaction and fuel quantities consistently. It should not be interpreted as ore tonnage, the gross mass of a finished assembly or the mass of every chemical component used along the fuel cycle. EIA, report quantity footnote.
Common units do not guarantee that the same material cohort appears in every annual field. Purchases, feed deliveries and loading occur on different schedules and can involve previously owned material. EIA separately describes commercial inventories at different fuel-cycle stages and locations. Subtracting one of these annual measures from another would not, by itself, measure a process loss, enrichment yield or inventory change.
The feed table classifies where uranium was delivered for enrichment. Its public domestic and foreign destination aggregates are complete below. They should remain separate from the uranium-origin columns inside the original table, some of which are withheld. AMR uses only the released destination totals and does not derive their suppressed internal origin components. EIA, Table 13.
| Delivery year | Feed to U.S. enrichers (thousand lb U3O8e) | Feed to foreign enrichers (thousand lb U3O8e) | Total feed (thousand lb U3O8e) | AMR U.S. destination share (%) |
|---|---|---|---|---|
| 2023 | 12957 | 20543 | 33500 | 38.6776 |
| 2024 | 12003 | 30295 | 42299 | 28.3766 |
| 2025 | 11832 | 20257 | 32089 | 36.8724 |
Fuel loading has a further boundary. Table 18 includes unirradiated uranium in new assemblies loaded during the year and excludes uranium removed from reactors that will subsequently be reloaded. It is a new-loading measure, rather than a measure of every assembly movement or the quantity that underwent fission during the year. Its origin breakdown is retained with the source’s disclosure and status flags.
| Loading year | Uranium origin | New fuel loaded (thousand lb U3O8e) | Status |
|---|---|---|---|
| 2021 | Domestic origin | 3289 | Reported historical |
| 2021 | Foreign origin | 41111 | Reported historical |
| 2021 | Total | 44400 | Reported historical |
| 2022 | Domestic origin | 1507 | Reported historical |
| 2022 | Foreign origin | 42904 | Reported historical |
| 2022 | Total | 44411 | Reported historical |
| 2023 | Domestic origin | W | Reported historical |
| 2023 | Foreign origin | W | Reported historical |
| 2023 | Total | 46112 | Reported historical |
| 2024 | Domestic origin | 2925 | 2024 final in this edition |
| 2024 | Foreign origin | 45215 | 2024 final in this edition |
| 2024 | Total | 48140 | 2024 final in this edition |
| 2025 | Domestic origin | 3318 | Preliminary |
| 2025 | Foreign origin | 37602 | Preliminary |
| 2025 | Total | 40920 | Preliminary |
The source marks 2025 loading preliminary and says final 2024 loading was reported in the 2025 survey. These labels should survive reuse alongside the values. A later edition may change an earlier estimate. A historical trend should be checked for such revisions before treating a difference between report editions as a new annual change.
Where do purchased enrichment services come from?
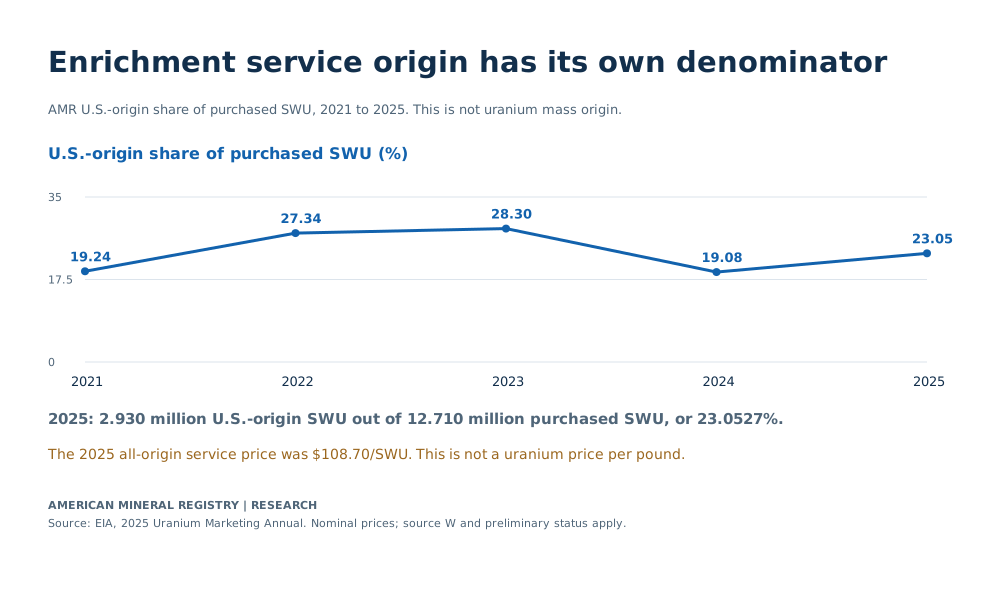
EIA reports 12.710 million separative work units purchased in 2025, including 2.930 million U.S.-origin SWU and 9.780 million foreign-origin SWU. AMR calculates the U.S.-origin service share at 23.0527%. The nominal weighted-average service price was $108.70 per SWU, a different unit and purchasing measure from uranium pounds. EIA, Table 16.

View chart data
AMR U.S.-origin share of purchased SWU, 2021 to 2025. This is not uranium mass origin.
| Year | U.S.-origin enrichment (thousand SWU) | Total purchased (thousand SWU) | AMR U.S.-origin SWU share (%) |
|---|---|---|---|
| 2021 | 2736 | 14217 | 19.2446 |
| 2022 | 3876 | 14176 | 27.3420 |
| 2023 | 4313 | 15240 | 28.3005 |
| 2024 | 2892 | 15159 | 19.0778 |
| 2025 | 2930 | 12710 | 23.0527 |
Source quantities are independently rounded. AMR arithmetic does not recover original precision.
Delivery, feed, service and loading measures retain their distinct units and populations.
EIA, 2025 Uranium Marketing Annual, Table 16 EIA 2025 Uranium Marketing Annual, Table 16
| Year | U.S.-origin enrichment (thousand SWU) | Foreign-origin enrichment (thousand SWU) | Total enrichment purchased (thousand SWU) | Nominal weighted-average price (USD per SWU) | AMR U.S.-origin share of total SWU (%) |
|---|---|---|---|---|---|
| 2021 | 2736 | 11481 | 14217 | 99.54 | 19.2446 |
| 2022 | 3876 | 10301 | 14176 | 101.03 | 27.3420 |
| 2023 | 4313 | 10926 | 15240 | 106.97 | 28.3005 |
| 2024 | 2892 | 12267 | 15159 | 97.66 | 19.0778 |
| 2025 | 2930 | 9780 | 12710 | 108.70 | 23.0527 |
SWU is EIA’s standard unit for enrichment services. It measures a service quantity, rather than pounds of material. A dollars-per-SWU price therefore cannot be relabeled a uranium price per pound. Adding the two quoted unit prices without matched quantities and an explicit cost model would also fail to produce a defined total fuel cost.
The service-origin country panel below preserves its own labels and confidentiality flags. For example, Table 16 publishes 3.284 million SWU of Russian-origin enrichment services in 2025, while the 2025 Russian uranium-origin quantity in Table 3 is W. The released service quantity does not reveal the withheld uranium-origin quantity. This is precisely why the two classifications must remain distinct. EIA, Table 16, Table 3.
| Enrichment service origin | Row role | Services purchased (thousand SWU) | AMR share of total SWU (%) |
|---|---|---|---|
| China | Service-origin label | W | W |
| France | Service-origin label | 2234 | 17.5767 |
| Germany | Service-origin label | W | W |
| Netherlands | Service-origin label | 1056 | 8.3084 |
| Russia | Service-origin label | 3284 | 25.8379 |
| United Kingdom | Service-origin label | 1828 | 14.3824 |
| Europe a | Service-origin label | W | W |
| Other b | Service-origin label | W | W |
| Foreign total | Foreign aggregate | 9780 | 76.9473 |
| United States | Service-origin label | 2930 | 23.0527 |
| Total | All-origin total | 12710 | 100.0000 |
Feed destination provides another independent denominator. Table 13 reports 11.832 million pounds U3O8 equivalent of feed sent to U.S. enrichment suppliers out of 32.089 million pounds total in 2025, a 36.8724% share by AMR calculation. That input-mass share and the 23.0527% U.S.-origin SWU share describe different measures. Their difference does not establish a processing-efficiency result or the destination of a specific purchased uranium batch.
The metric dictionary summarizes the boundary choices for reuse. A reliable sentence identifies the activity, unit, population, reporting year and any source flag. This allows a writer to describe dependence on foreign-origin uranium, foreign suppliers or foreign enrichment work with the appropriate statistic, rather than treating them as interchangeable measures of supply.
| Measure | Unit or definition | Population or boundary | EIA source | Limit |
|---|---|---|---|---|
| Delivered uranium purchases | Thousand lb U3O8 equivalent | Civilian reactor owners/operators, delivery year | Table 1 | Not the contract signing year or reactor consumption |
| Uranium origin | Reported origin of material | Domestic/foreign or Table 3 origin label | Tables 2 and 3 | Different from supplier location and enrichment-service country |
| Supplier location | Location/classification of seller | U.S. or foreign supplier | Table 1 | A U.S. supplier can sell foreign-origin uranium |
| Contract price | Nominal weighted-average USD/lb U3O8e | Quantity with reported price, material and contract group specified | Table 7 | Uranium component only; conversion/enrichment service components excluded |
| Spot contract | Usually one-time delivery within one year of execution | EIA contract classification | Table 7 footnote a | Annual paid delivery price, not a current commodity quotation |
| Long-term contract | One or more deliveries after a year following execution | EIA contract classification | Table 7 footnote b | May include short/medium arrangements under source definition |
| Natural feed | Thousand lb U3O8e | Delivered to enrichment suppliers by destination | Table 13 | Not a separative-work quantity or finished fuel mass |
| Enrichment service | Thousand separative work units | Purchased services by origin and year | Table 16 | SWU is a service unit, not pounds of uranium |
| New fuel loading | Thousand lb U3O8e | Unirradiated uranium in new assemblies loaded during year | Table 18 | Excludes removed uranium subsequently reloaded;2025 preliminary |
| W | Data withheld | Source cell confidentiality flag | Source table notes | Never replace with zero or infer by subtraction |
| Zero | Published numeric zero | Exact source row/cell | Source table cells | Distinct from W and from an unknown value |
| U3O8e | Uranium-equivalent reporting basis | Several uranium material forms | EIA main report footnote a | Not ore tonnage or the gross physical mass of a finished assembly |
Primary source · Primary source · Primary source · Primary source · Primary source · Download matching CSV
| AMR comparison | Input A | Input B | AMR result | Unit and boundary |
|---|---|---|---|---|
| 2024 to 2025 delivered-purchase change | 55921 | 46871 | -16.1835 | Percent, same-edition annual deliveries |
| 2024 to 2025 nominal paid-price change | 52.71 | 58.46 | 10.9087 | Percent, weighted-average nominal USD/lb U3O8e |
| Canada plus Kazakhstan plus Australia | 35615 | 46871 | 75.9852 | Percent of 2025 all-origin delivered purchases |
| All-material spot price premium | 55.91 | 75.83 | 35.6287 | Percent above matched long-term paid price, 2025 |
| All-material spot price difference | 75.83 | 55.91 | 19.92 | USD per lb U3O8e,2025 |
| 2025 foreign-origin purchase share | 43495 | 46871 | 92.7973 | Percent of all-origin delivered purchases |
Primary source · Primary source · Primary source · Primary source · Download matching CSV
How should these findings be quoted?
Credit EIA for its survey values and AMR for the stated calculations. Preserve delivery year for purchases, reported-price coverage for contract comparisons, and SWU for enrichment services. Keep W as withheld and attach preliminary status to 2025 new fuel loading. The specific finding controls below link the exact supporting comparison and matching CSV.
Frequently asked questions
Is $58.46 the current uranium spot price?
It is EIA’s nominal weighted-average paid uranium price for the relevant 2025 delivered-purchase population. A current spot quotation is a different measure. The annual table combines the reported contracts and deliveries under its own coverage.
Does buying from a U.S. supplier mean the uranium is U.S.-origin?
Supplier classification and uranium origin are separate. EIA’s supplier and origin tables explicitly use different groupings. A statement about origin should use the origin table rather than substitute seller location.
Can W be filled by subtracting known countries from the total?
W identifies data withheld to avoid disclosing individual company information. This compilation preserves the flag and does not reconstruct it, assign it zero or infer a country quantity from residual arithmetic.
Do fewer purchased pounds mean lower reactor consumption?
Purchases and new fuel loading are separate annual measures with different timing and inventories. Neither quantity alone measures the uranium that underwent fission during the year. Retain the source’s activity label.
Why do the contract total and overall purchase total differ?
Table 7 identifies quantity with reported price; the overall purchase series has its own total-purchase coverage. Preserve the published fields and their labels rather than forcing one to equal the other or assigning their difference to an undisclosed material row.
Are the source prices inflation adjusted?
EIA states that the displayed weighted-average prices are not adjusted for inflation. The price comparisons here remain nominal, with the original currency and unit stated.
Methodology and Sources
AMR inspected the offered EIA XLSX tables and their source notes, with HTML corroboration for the origin, contract and fuel-loading panels. The report covers 2025 observations and carries an August 13, 2026 revision notice. Original downloads, hashes and exact worksheet/cell references were retained for review.
The compilation uses the complete 2021 to 2025 total-purchase and service groups, Table 2’s released origin groups, the complete 2025 country-origin and contract/material panels, and compatible fuel-stage comparisons. Country comparisons use Table 3’s 2025 panel; the historical aggregate follows Table 2’s own released cells, so its W entries are not backfilled from another table. Source W cells remain W. No suppressed country or material is solved from a total. Prices follow their published two-decimal display and quantities their displayed precision, including independently rounded components.
AMR calculates shares from public numerators and the appropriate published totals, annual changes as (later / earlier − 1) × 100, and matched contract-price differences and premiums. The source-cell ledger maps every presented cell to its original workbook, sheet, cell and HTML table. The standalone reproduction program reads the supplied CSVs and tests the calculations, source windows, W flags, material rows and preliminary status.
The calculation tables reproduce AMR’s operations on published inputs, rather than unrounded company transactions or a full fuel-cycle accounting model. The analysis makes no estimate of current spot quotations, undisclosed quantities, process yields, engineering requirements or future purchase needs.
Glossary
- U3O8 equivalent, U3O8e. EIA’s common reporting basis for the uranium component of several material forms.
- Delivery year. The year uranium purchases were delivered under the report’s annual series, distinct from contract execution year.
- Weighted-average paid price. A reported average that weights prices by the applicable quantities, with coverage defined by its table.
- Uranium origin. The reported origin classification of the material, kept separate from seller and enrichment-service classifications.
- Natural feed. Uranium delivered to enrichment suppliers under the source’s feed measure.
- SWU. Separative work unit, the standard measure of enrichment services used by EIA.
- New fuel loading. Unirradiated uranium in new assemblies loaded during the year, subject to the source’s exclusions.
- W. Source data withheld to avoid disclosure of individual company information.
- Preliminary. A source status indicating that a value remains subject to later final reporting.
Sources
- EIA, 2025 Uranium Marketing Annual, revision notice. Report identity, definitions and current table links.
- Table 1, Table 2, Table 3. Delivered purchases, nominal paid prices, supplier and origin classifications.
- Table 7. Matched contract/material quantities with reported prices, prices and component exclusions.
- Table 13, Table 16, Table 18. Natural feed, enrichment services and new fuel loading, with source flags and notes.