Chemistry adoption has since changed the context in which that benchmark is quoted. The IEA’s 13 February 2026 commentary estimates that LFP accounted for over half of global EV battery chemistry share in 2025. Its EV chemistry chart measures battery capacity in registered four-wheelers, includes LFMP within LFP, and excludes two/three-wheelers and stockpiling. That capacity-weighted market comparison does not turn the older NMC622 model into a current fleet-average material inventory. IEA, global battery markets commentary and chemistry-chart notes.
This reference provides a complete reconciliation of the older model’s included categories, an original contribution analysis, a denominator check for mineral ratios and a separate ledger of newer chemistry and deployment estimates. The page date records AMR’s compilation and verification. The source vintages remain visible beside their respective figures.
Key Takeaways
- 207.01 kg versus 33.90 kg are AMR sums of the IEA model’s included material categories. They are neither total vehicle weights nor battery-only weights.
- 6.1065 times is the ratio of those sums. The original report describes the comparison in rounded terms as six times the mineral inputs.
- 173.11 kg is the modeled electric-minus-conventional increment across the included categories.
- Graphite, nickel and copper contribute 137.10 kg, or about 79.20% of that increment, by AMR calculation.
- A zero conventional-model cell does not support a finite multiple. The absolute difference remains calculable; a ratio to zero is undefined.
- The electric model specifies NMC622. Newer LFP adoption data do not supply a replacement chemistry-specific kilogram inventory.
- LFP’s 2025 EV share is reported above half, with capacity weighting, four-wheeler coverage, LFMP inclusion and exclusions that matter when quoting it.
- Sixfold battery deployment growth is a separate time comparison. It does not establish sixfold growth in every battery mineral.
What does six times the mineral input actually measure?
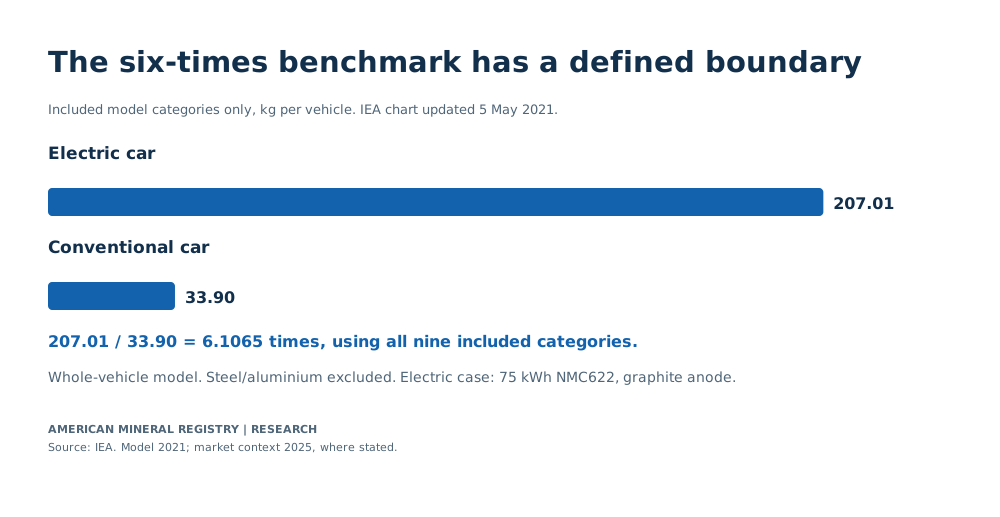
The IEA comparison measures the listed material inputs to two vehicle models, with steel and aluminium excluded. AMR calculates an electric-to-conventional ratio of 207.01 / 33.90 = 6.1065 from the offered CSV. The source’s six-times headline is a rounded summary of a specifically bounded comparison. IEA, chart updated 5 May 2021, IEA, original report executive summary.

View chart data
Included model categories only, kg per vehicle. IEA chart updated 5 May 2021.
| Vehicle model | AMR sum of included categories (kg) |
|---|---|
| Electric car | 207.01 |
| Conventional car | 33.90 |
Model categories exclude steel and aluminium and cover the entire vehicle where stated.
2025 context is estimated; bounds remain bounds and do not form an exact closed composition.
IEA, Minerals used in electric cars compared to conventional cars, chart notes and offered CSV IEA primary evidence; Offered CSV and chart Notes
| Model case | AMR sum of included categories (kg per vehicle) | Model boundary |
|---|---|---|
| Electric car | 207.01 | Entire vehicle including battery, motor and glider; 75 kWh NMC622 cathode and graphite anode; steel and aluminium excluded |
| Conventional car | 33.90 | Entire vehicle; same listed categories; steel and aluminium excluded |
| Field | Source-defined scope | Consequence for reuse |
|---|---|---|
| Chart vintage | Last updated 5 May 2021 | Treat as the stated technology benchmark, not a measured 2025 fleet average |
| Unit | kg per vehicle | No conversion to ore mass or battery-only material intensity |
| System boundary | Entire vehicle including batteries, motors and glider | Included material quantities cannot all be allocated to the battery |
| Electric battery assumption | 75 kWh NMC622 cathode and graphite-based anode | Other chemistries or pack capacities need matched material evidence |
| Excluded materials | Steel and aluminium | The category sum is neither total vehicle mass nor all material input |
| Zero convention | Explicit zero in a source model category | Preserve the row value; do not generalize to every technology |
| Others | Aggregate source category without a listed elemental decomposition | Retain as Others; do not silently omit or invent its contents |
The system boundary changes what the number can answer. “Entire vehicle” includes material associated with the battery, motor and glider. The glider is the rest of the vehicle within the source’s stated boundary. Meanwhile, the excluded steel and aluminium mean that the included-category sum cannot serve as an estimate of the vehicle’s total material mass. Both conditions must travel with the ratio. Describing it simply as six times the weight would lose the category exclusion and imply a different comparison.
The model is also a technology case. Its specified battery size, cathode family and anode material define the electric side. The source does not say that every electric car, every pack size or every chemistry has the same quantities. A journalist can use the benchmark to illustrate a material-demand contrast under those assumptions. A procurement team estimating a particular vehicle or a researcher constructing a current market average would need a model matched to that purpose.
AMR includes every material column offered in the downloaded CSV, including zinc, rare earths and the aggregate “Others” category. The sum is transparent and reproducible. Omitting the smaller categories because their visual contribution appears negligible would change the input set. Equally, adding steel or aluminium from an unrelated source without a compatible vehicle specification would create a new hybrid model. This reference keeps the IEA’s included-category comparison intact.
The original report’s wording and AMR’s arithmetic have different precision. The report gives a broad six-times characterization; summing the downloadable chart inputs yields the more detailed ratio shown here. Additional decimal places help readers reproduce the calculation from those inputs. They do not establish a highly precise universal engineering coefficient or supersede the model’s assumptions. Quote approximately six times for broad context, with the vintage and exclusion, or 6.1065 for this exact source-derived calculation.
Which materials account for the extra modeled kilograms?
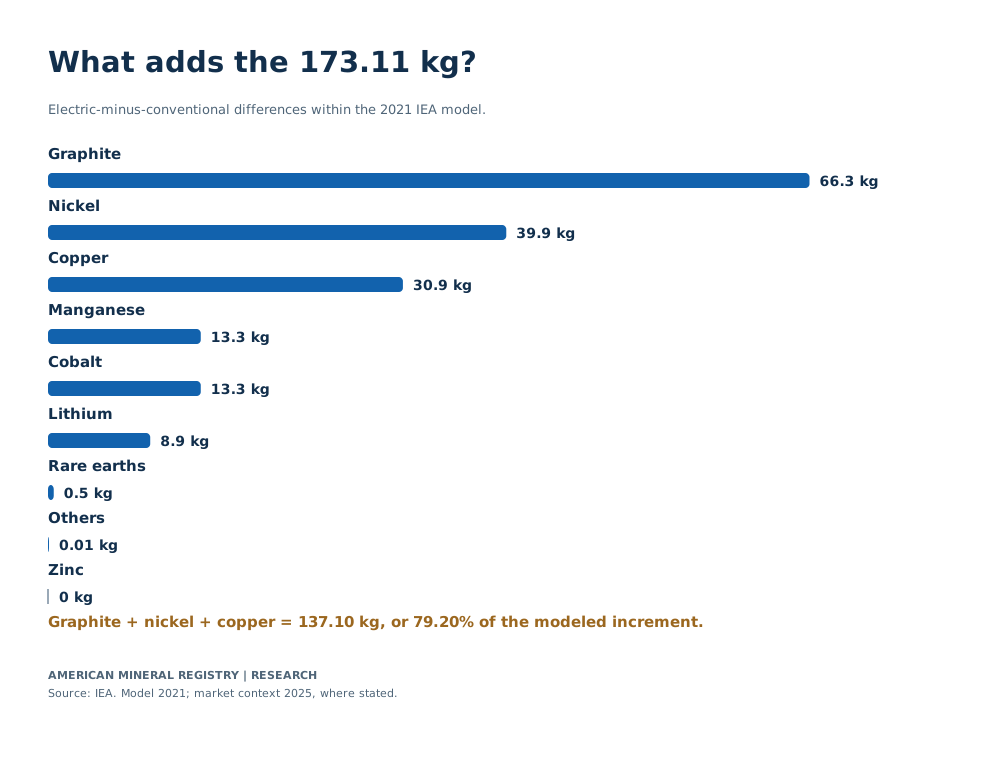
AMR calculates a 173.11 kg electric-minus-conventional increment across the included categories. Graphite contributes 66.30 kg, nickel 39.90 kg and copper 30.90 kg. Together they contribute 137.10 kg, or 79.1982% of the modeled increment. AMR calculation from the IEA vehicle-chart CSV.

View chart data
Electric-minus-conventional differences within the 2021 IEA model.
| Material | AMR difference (kg per vehicle) | AMR share of increment (%) |
|---|---|---|
| Graphite | 66.30 | 38.2993 |
| Nickel | 39.90 | 23.0489 |
| Copper | 30.90 | 17.8499 |
| Manganese | 13.30 | 7.6830 |
| Cobalt | 13.30 | 7.6830 |
| Lithium | 8.90 | 5.1412 |
| Rare earths | 0.50 | 0.2888 |
| Others | 0.01 | 0.0058 |
| Zinc | 0.00 | 0.0000 |
Model categories exclude steel and aluminium and cover the entire vehicle where stated.
2025 context is estimated; bounds remain bounds and do not form an exact closed composition.
IEA, vehicle-mineral chart, Electric car and Conventional car CSV rows IEA primary evidence; Offered CSV, both vehicle rows
| Included material category | Electric car (kg per modeled vehicle) | Conventional car (kg per modeled vehicle) | AMR difference (kg per modeled vehicle) | AMR share of 173.11 kg increment (%) | AMR share of electric included-category total (%) |
|---|---|---|---|---|---|
| Copper | 53.2 | 22.3 | 30.90 | 17.8499 | 25.6992 |
| Lithium | 8.9 | 0 | 8.90 | 5.1412 | 4.2993 |
| Nickel | 39.9 | 0 | 39.90 | 23.0489 | 19.2744 |
| Manganese | 24.5 | 11.2 | 13.30 | 7.6830 | 11.8352 |
| Cobalt | 13.3 | 0 | 13.30 | 7.6830 | 6.4248 |
| Graphite | 66.3 | 0 | 66.30 | 38.2993 | 32.0274 |
| Zinc | 0.1 | 0.1 | 0.00 | 0.0000 | 0.0483 |
| Rare earths | 0.5 | 0 | 0.50 | 0.2888 | 0.2415 |
| Others | 0.31 | 0.30 | 0.01 | 0.0058 | 0.1498 |
| AMR calculation | Numerator | Denominator or operation | Result | Unit and interpretation |
|---|---|---|---|---|
| Electric-to-conventional included-category ratio | 207.01 | 33.90 | 6.1065 | Ratio of included modeled material masses; source headline rounded to six times |
| Electric-minus-conventional increment | 207.01 | - 33.90 | 173.11 | kg per modeled vehicle, included categories |
| Graphite plus nickel plus copper increment | 66.30 + 39.90 + 30.90 | Sum | 137.10 | kg per modeled vehicle, selected contributions to increment |
| Selected three-material share of increment | 137.10 | 173.11 | 79.1982 | Percent of included-category increment |
A contribution analysis answers a different question from a ranking of material quantities in the electric case. Copper is present in both model vehicles, so its contribution to the difference is 53.2 − 22.3 = 30.9 kg. Graphite and nickel have zero entries on the conventional side of this source model, so their modeled increments equal their electric-side entries. The calculation identifies where the contrast comes from without assuming that every electric-side kilogram is an additional kilogram relative to the conventional case.
The source gives manganese at 24.5 kg for the electric car and 11.2 kg for the conventional car, producing a 13.3 kg difference. Cobalt contributes the same 13.3 kg modeled difference through a different pair of inputs: 13.3 kg and zero. Equal increments therefore do not imply equal quantities or equal conventional baselines. The full two-column source comparison remains useful even when a chart emphasizes the difference. IEA, vehicle-mineral chart CSV.
The remaining categories stay in the arithmetic. Lithium contributes 8.9 kg, rare earths 0.5 kg and zinc zero because both zinc entries are 0.1 kg. The “Others” entries are 0.31 and 0.30 kg, giving a 0.01 kg displayed difference. That small calculated difference should retain its source precision and aggregate label. It supplies no evidence about the identity, commercial importance or current availability of the materials inside that category.
The increment shares use 173.11 kg as their common denominator. Electric-case composition shares use 207.01 kg instead. Both appear in the table and are explicitly labeled. A material’s share of the increment is therefore not its share of the electric model’s included mass. The distinction is particularly useful when explaining copper, which is substantial on both sides of the comparison.
Material mass alone also does not rank supply risk, extraction burden, value or environmental impact. Those questions require compatible evidence about production, sourcing, processing, prices or life-cycle effects. This table supports a complete mass comparison within a stated technology model. AMR does not convert its kilogram ranking into an unsupported ranking of criticality or environmental harm.
Which per-mineral ratios can the benchmark support?
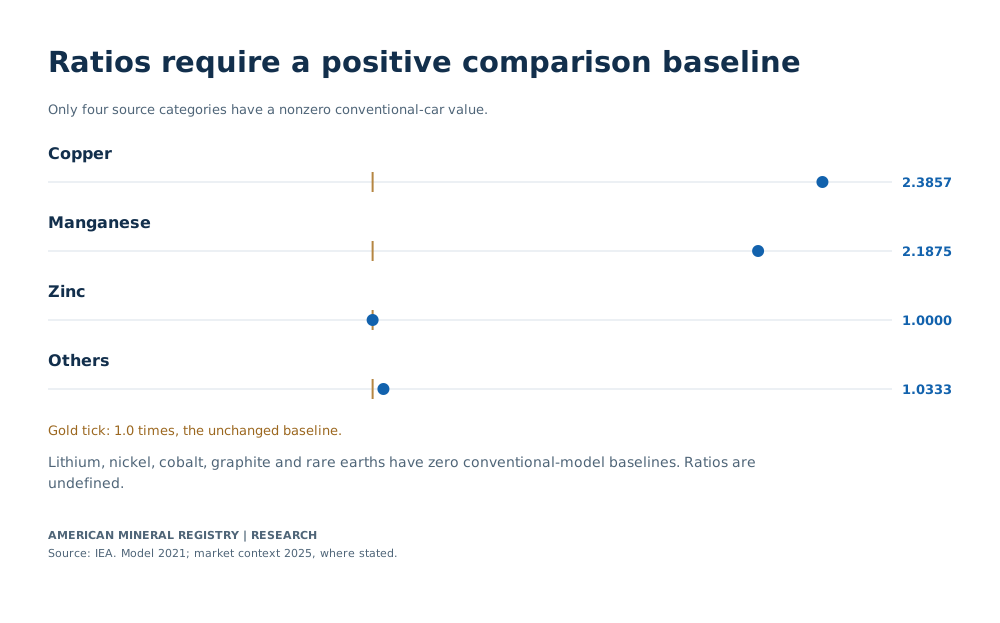
The source supports finite electric-to-conventional ratios for copper, manganese, zinc and “Others”, because their conventional-model baselines are positive. Ratios for lithium, nickel, cobalt, graphite and rare earths are undefined against the source’s zero conventional-model cells. Their absolute differences remain available. IEA, offered vehicle-chart CSV.

View chart data
Only four source categories have a nonzero conventional-car value.
| Category | AMR electric-to-conventional ratio |
|---|---|
| Copper | 2.3857 |
| Manganese | 2.1875 |
| Zinc | 1.0000 |
| Others | 1.0333 |
Model categories exclude steel and aluminium and cover the entire vehicle where stated.
2025 context is estimated; bounds remain bounds and do not form an exact closed composition.
IEA, vehicle-mineral chart CSV, corresponding material columns IEA primary evidence; Offered CSV, positive conventional baseline cells
| Included material category | Electric car (kg per modeled vehicle) | Conventional car (kg per modeled vehicle) | AMR electric-to-conventional ratio | Denominator convention |
|---|---|---|---|---|
| Copper | 53.2 | 22.3 | 2.3857 | Positive conventional baseline |
| Lithium | 8.9 | 0 | Not defined: zero model baseline | Source model row is zero; no universal absence claim |
| Nickel | 39.9 | 0 | Not defined: zero model baseline | Source model row is zero; no universal absence claim |
| Manganese | 24.5 | 11.2 | 2.1875 | Positive conventional baseline |
| Cobalt | 13.3 | 0 | Not defined: zero model baseline | Source model row is zero; no universal absence claim |
| Graphite | 66.3 | 0 | Not defined: zero model baseline | Source model row is zero; no universal absence claim |
| Zinc | 0.1 | 0.1 | 1.0000 | Positive conventional baseline |
| Rare earths | 0.5 | 0 | Not defined: zero model baseline | Source model row is zero; no universal absence claim |
| Others | 0.31 | 0.30 | 1.0333 | Positive conventional baseline |
A denominator check prevents an apparently dramatic number from becoming a mathematical error. The electric-to-conventional ratio divides one modeled material quantity by the other. If the denominator is zero, ordinary division cannot produce a finite multiple. Replacing zero with a tiny invented quantity, silently treating it as one, or assigning an arbitrarily large bar would create a result that the source does not supply.
AMR retains the explicit source zeros and labels the affected ratios undefined. That is different from treating a missing observation as zero. Here the model actually contains a zero in the named row and material column. The meaning remains local to that source model. It does not establish that all conventional vehicles, every manufacturing process or every technology variant contains none of the material.
Absolute differences do not have this division problem. The graphite comparison can be reported as a 66.3 kg electric-minus-conventional difference in the benchmark even though a graphite multiple is undefined. This is often the more informative way to explain a technology contrast. It keeps a measured unit, preserves both model entries and avoids an unbounded rhetorical comparison.
Defined ratios still need their absolute quantities. Zinc’s ratio is one, from 0.1 kg on each side. Copper’s ratio is about 2.3857, from 53.2 and 22.3 kg. The ratio describes relative scale; the kilogram table describes material magnitude. A reader interested in the increment should look at the difference column, while a reader comparing relative intensity can use the ratio column with the same source boundary.
The aggregate ratio of 6.1065 also does not imply that each material rises sixfold. The component ratios differ, and several lack a positive comparison baseline. Aggregation combines categories with different starting quantities. The complete reconciliation makes that composition visible rather than treating the headline multiple as an element-by-element multiplier.
Finally, a per-vehicle material ratio is unrelated to a metal’s share of annual demand. Estimating industry demand requires the number and type of vehicles, their material requirements, the relevant period and any other applications included in the demand measure. Applying the model’s aggregate ratio directly to a national nickel-demand forecast, for example, would skip those required inputs.
Which battery chemistry sits behind the comparison?
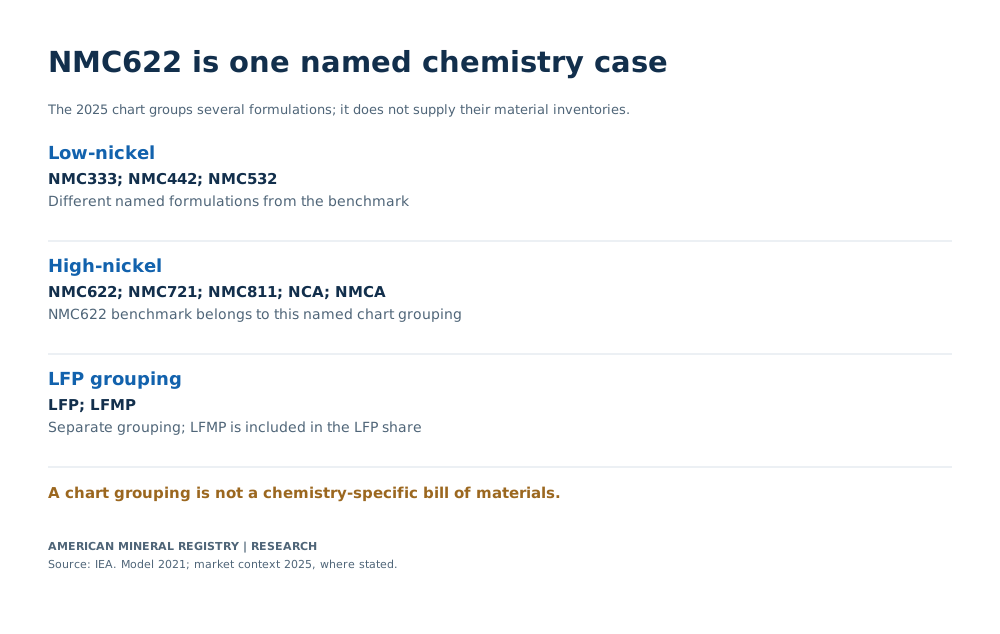
The benchmark specifies NMC622 and a graphite-based anode; the newer IEA chemistry chart places NMC622 within its high-nickel grouping. That chart also defines low-nickel and LFP groupings containing different named formulations. The groupings describe the newer market analysis and do not supply alternative kilogram inventories. IEA, 2021 vehicle-chart notes, IEA, 2026 commentary chemistry-chart notes.

View chart data
The 2025 chart groups several formulations; it does not supply their material inventories.
| IEA grouping | Included chemistry formulations | 2021 benchmark relationship |
|---|---|---|
| Low-nickel | NMC333; NMC442; NMC532 | Different named formulations from the benchmark |
| High-nickel | NMC622; NMC721; NMC811; NCA; NMCA | NMC622 benchmark belongs to this named chart grouping |
| LFP grouping | LFP; LFMP | Separate grouping; LFMP is included in the LFP share |
Model categories exclude steel and aluminium and cover the entire vehicle where stated.
2025 context is estimated; bounds remain bounds and do not form an exact closed composition.
IEA, battery-market commentary, notes below the four-wheeler EV chemistry chart IEA primary evidence; Chemistry-chart Notes;2021 source-chart Notes for NMC622 model
| IEA chart grouping | Chemistries included in the 2025 chart notes | Relationship to the 2021 model |
|---|---|---|
| Low-nickel | NMC333; NMC442; NMC532 | Different named formulations from the benchmark |
| High-nickel | NMC622; NMC721; NMC811; NCA; NMCA | NMC622 benchmark belongs to this named chart grouping |
| LFP grouping | LFP; LFMP | Separate grouping; LFMP is included in the LFP share |
“Battery minerals” can refer to several boundaries: active cathode materials, anode materials, a complete cell, a complete pack or a whole vehicle containing that pack. The IEA vehicle table supplies the last of these for its included material categories. It does not break each metal into separate battery, motor and glider contributions. Calling every kilogram in the table a battery requirement would therefore change the source boundary.
The 75 kWh assumption does not repair that allocation problem. Dividing whole-vehicle material quantities by battery capacity would produce a ratio with the wrong numerator for a battery-only intensity. It could incorporate material serving other vehicle components while presenting the result as material per kWh of battery. AMR does not publish that conversion or scale the whole-vehicle table to a different pack size.
A chemistry change adds another reason to seek a matched model. The market-share chart defines families, including multiple high-nickel formulations and an LFP grouping that also includes LFMP. A family share does not establish the precise composition of every pack in the family. Even a chemistry-specific model would need to identify what its quantities describe, the size and design assumed, and which components are included.
The source’s names are preserved rather than collapsed into a single “nickel battery” category. Its high-nickel grouping includes NMC622, NMC721, NMC811, NCA and NMCA. The low-nickel grouping includes NMC333, NMC442 and NMC532. LFP includes LFMP. These definitions matter when comparing chart categories across publications: a familiar abbreviated label may encompass more than one formulation. IEA, chemistry-chart notes.
For a current chemistry-by-size material inventory, the evidence would need to supply compatible material quantities for the relevant cell and pack designs. Those inputs would then be kept separate from the vehicle’s other materials. This reference instead provides the fully supported task: a complete reconciliation of the stated vehicle benchmark, followed by market context showing why its assumptions should remain attached when it is reused.
How much EV and stationary battery deployment uses LFP?
The IEA estimates LFP at over half of global EV battery chemistry share and over 90% of battery energy storage systems in its 2025 market discussion. AMR preserves those statements as bounds. The EV chart explicitly weights chemistry sales by the battery capacity of registered four-wheelers; the BESS statement describes a separate population. IEA, global battery markets commentary, LFP discussion and chemistry-chart notes.

View chart data
Global 2025 estimates; EV and BESS are different deployment populations.
| Population | Reported LFP share | Denominator |
|---|---|---|
| EV batteries | >50% | Registered four-wheeler EV battery capacity; LFP includes LFMP |
| Battery energy storage systems | >90% | Share of BESS using LFP, as described in the commentary |
Model categories exclude steel and aluminium and cover the entire vehicle where stated.
2025 context is estimated; bounds remain bounds and do not form an exact closed composition.
IEA, 13 February 2026 battery-market commentary and EV chemistry-chart notes IEA primary evidence; LFP paragraph and EV chemistry-chart Notes
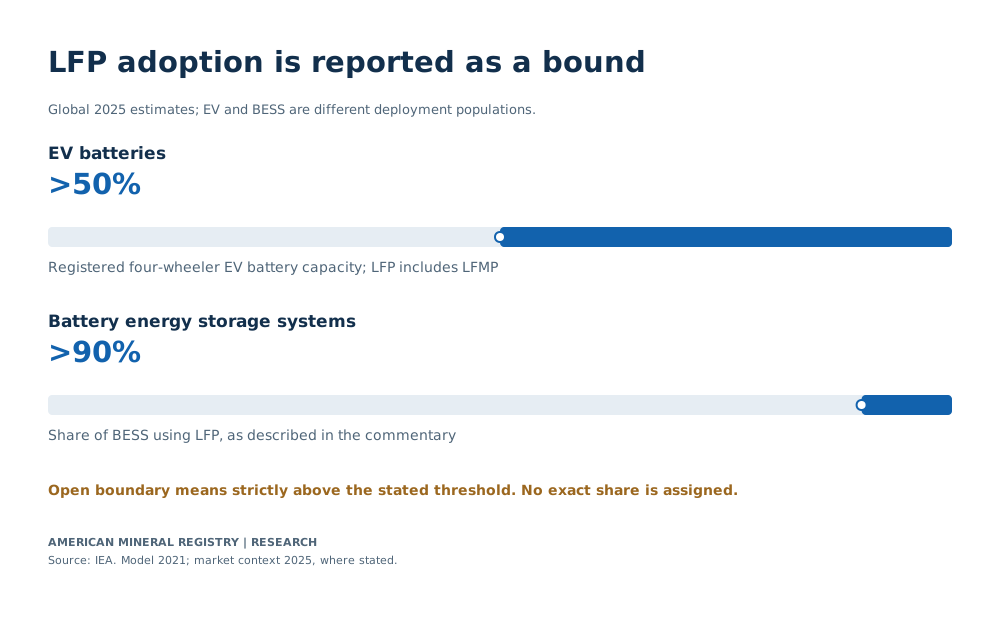
| Reported population | Year | LFP relation | Threshold (%) | Denominator and coverage | Evidence status |
|---|---|---|---|---|---|
| Global EV battery chemistry share | 2025 | > | 50 | Battery capacity of registered four-wheeler EVs; LFP includes LFMP; two/three-wheelers and EV/battery stockpiling excluded | 2025 estimate in 13 February 2026 IEA commentary |
| Global battery energy storage systems | 2025 | > | 90 | Share of BESS using LFP as described in commentary; separate population from registered EV battery-capacity chart | 2025 estimate/context in 13 February 2026 IEA commentary |
Capacity weighting is a substantive condition. A chemistry installed in larger battery packs contributes more to a capacity-based share per vehicle than the same chemistry installed in smaller packs. A capacity share therefore does not automatically equal the share of vehicle registrations. Reconstructing a unit-count share would require the relevant registration and pack-capacity distribution, rather than a simple relabeling of this percentage.
The EV chart’s coverage is equally specific. It excludes two/three-wheelers and excludes electric-vehicle and battery stockpiling. It also includes LFMP within its LFP category. A sentence describing all batteries sold, all electric mobility or every battery manufactured would broaden the population beyond those notes. AMR retains the four-wheeler registration boundary for the EV chemistry finding. The 2025 values are estimated from the latest data available to the source’s February 2026 publication.
The BESS share should remain independently labeled. It concerns battery energy storage systems rather than the registered EV population used for the chemistry-sales chart. Combining the EV and BESS percentages into a single average would require the corresponding quantities and a compatible weighting rule. The two threshold statements do not provide that complete calculation, and a greater-than sign should never be replaced with an exact point simply to fill a pie chart.
Price developments help explain the source’s discussion of chemistry choice, while answering a different numerical question from material content. The commentary says LFP battery prices fell by more than 15% in 2025, compared with less than 5% for NMC, and describes LFP as more than 40% cheaper on average. AMR retains those comparisons as the reported bounds, without constructing a new price series or inferring chemistry-specific mineral weights. IEA, LFP price and adoption discussion.
| Comparison | Year | Source bound | Unit and boundary | Interpretation |
|---|---|---|---|---|
| LFP battery price decline | 2025 | >15% | Decline in average battery price reported by chemistry | Bound retained; no exact decline inferred |
| NMC battery price decline | 2025 | <5% | Decline in average battery price reported by chemistry | Bound retained; no exact decline inferred |
| LFP price below NMC | 2025 | >40% | Average reported chemistry-price difference | Price context, not a mineral-mass intensity comparison |
This newer adoption evidence changes the interpretation of the older NMC622 example. A writer can still cite the benchmark accurately, with its assumptions. Using it as if it represented the material requirements of the current global fleet would require a separate case supported by current technology weights and matched material intensities. The LFP adoption ledger supplies a reason to check that assumption, rather than an unsupported numerical replacement for the old model.
How does battery deployment growth translate into mineral demand?
The IEA reports that global lithium-ion battery deployment in 2025 was six times its 2020 level. AMR expresses that relationship as an index of 100 in 2020 and 600 in 2025. This is a time comparison of deployed batteries, distinct from the 2021 electric-to-conventional vehicle material ratio. IEA, battery uptake discussion and deployment-chart notes.

View chart data
AMR index from IEA’s 2025-versus 2020 deployment relationship.
| Year | AMR deployment index (2020 = 100) |
|---|---|
| 2020 | 100 |
| 2025 | 600 |
Model categories exclude steel and aluminium and cover the entire vehicle where stated.
2025 context is estimated; bounds remain bounds and do not form an exact closed composition.
IEA, global battery markets commentary, opening battery uptake discussion IEA primary evidence; Battery uptake opening paragraph and 2025 estimate note
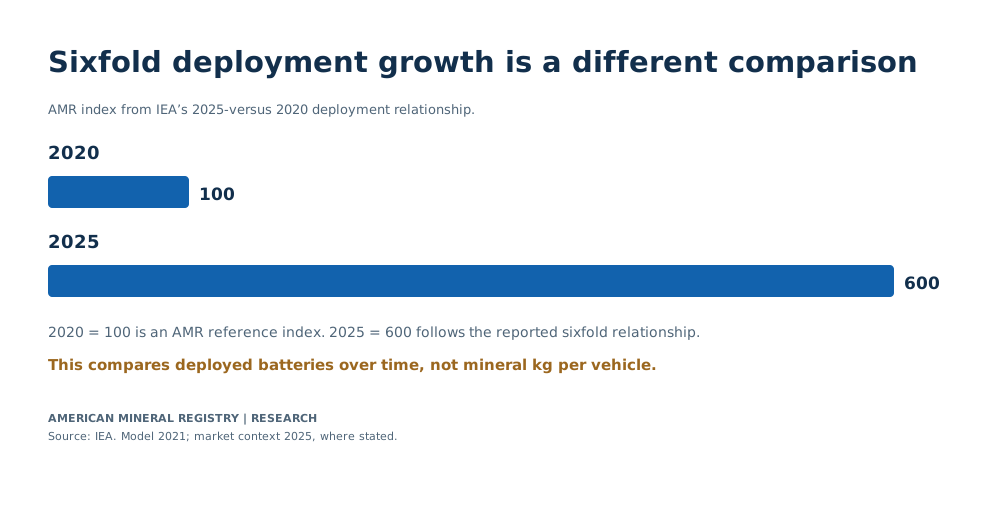
| Year | AMR deployment index (2020 = 100) | Source relationship | Evidence status |
|---|---|---|---|
| 2020 | 100 | Reference base assigned by AMR | Index base, not an observed GWh total |
| 2025 | 600 | IEA reports deployment six times 2020 | 2025 estimate; index derived from reported multiple |
The shared word “six” can hide a substantial change of subject. The vehicle benchmark divides included material kilograms in two different vehicle models. The deployment statement compares the size of the global battery market’s deployed quantity across two dates. Neither statement supplies the material intensity needed to convert the other into tonnes of lithium, nickel, copper or graphite.
Material demand depends on both deployment and technology-specific requirements. A complete calculation would match the deployed quantity to a material-intensity measure with the same product boundary and chemistry coverage, then aggregate compatible technology cases. If deployment is measured by energy capacity, battery-only material intensities would need that same capacity basis. If the material model is per whole vehicle, the matching deployment input would need the appropriate vehicle population and technology specifications. Mixing these boundaries can produce a precise-looking answer to a question the inputs do not answer.
Application shares supply further context without completing that material calculation. The commentary places EVs above 70% of total lithium-ion battery deployment, battery energy storage above 15% and portable electronics below 5% in its 2025 discussion. These are bounds, and the chart notes mark 2025 data estimated. They should remain application-deployment comparisons, rather than being converted to vehicle-count shares or assumed exact shares of mineral demand. IEA, battery uptake discussion and application-chart notes.
| Application | Year | Relation | Threshold (%) | Denominator | Qualification |
|---|---|---|---|---|---|
| Electric vehicles | 2025 | > | 70 | Total global lithium-ion battery deployment | 2025 estimated; not a share of vehicle counts |
| Battery energy storage | 2025 | > | 15 | Total global lithium-ion battery deployment | 2025 estimated; separate from LFP share within BESS |
| Portable electronics | 2025 | < | 5 | Total global lithium-ion battery deployment | 2025 estimated; remaining applications not reconstructed from bounds |
A percentage within an application and a share of the total market also need separate denominators. LFP’s share within BESS describes chemistry inside that application. BESS’s share of total lithium-ion deployment describes the application inside the broader market. Multiplying threshold values as if both were exact observations would discard the source’s inequalities and still require compatible coverage. AMR leaves the reported populations and bounds visible rather than issuing an exact all-market LFP estimate.
Manufacturing capacity adds a third category. A factory’s nameplate capability is a production potential over a period, while deployment concerns batteries actually put into applications under the source’s measure. Installed factory capacity, output, sales, registrations and deployment can differ. This reference includes no conversion of announced or nameplate factory capacity into current mineral demand.
| Metric | Numerator or unit | Population or denominator | Valid use | Invalid substitution |
|---|---|---|---|---|
| Vehicle-mineral benchmark | kg of listed materials per modeled vehicle | 2021 electric and conventional model cases, excluding steel/aluminium | Compare included quantities within the stated model | Total vehicle mass, battery-only mass or current fleet average |
| EV chemistry sales share | Battery capacity | Registered four-wheeler EV battery capacity, with stated exclusions | Describe estimated 2025 chemistry mix | Vehicle-count share or factory-capacity share |
| Application deployment share | Deployed batteries | Total lithium-ion battery deployment | Compare reported application shares | Factory nameplate capacity or mineral tonnes |
| Battery deployment growth | Ratio of deployed battery quantity over time | 2025 compared with 2020 | State the reported sixfold deployment relationship | A sixfold increase in every individual mineral |
| Factory capacity | Production capability per time | Nameplate or actual capability under a specified definition | A separate manufacturing analysis | Deployed battery demand or actual factory output |
How should this benchmark be quoted?
Keep the source, model date, included material boundary and battery assumption close to the number. A defensible sentence is: “AMR calculates a 6.1065 electric-to-conventional ratio from the included categories in the IEA’s May 2021 vehicle benchmark, which excludes steel and aluminium and assumes a 75 kWh NMC622 electric case.” When citing the newer LFP finding, retain the estimated 2025 period, capacity weighting, four-wheeler coverage, LFMP inclusion and exclusions. The finding controls below provide exact fragments and matching data.
Frequently asked questions
Is 207.01 kg the weight of an EV battery?
It is the sum of the material categories included in the source’s entire-vehicle model. The table does not allocate every included kilogram to the battery, and steel and aluminium are excluded. A battery-pack weight requires a different product boundary and corresponding evidence. IEA, vehicle-chart notes.
Can the model be scaled to a smaller or larger battery?
The source’s electric case specifies a 75 kWh battery assumption within a whole-vehicle comparison. The table does not separate battery-dependent material from other vehicle components. This reference therefore does not scale its kilogram values by a pack-capacity ratio or label them as battery material per kWh.
Does LFP adoption prove mineral demand is falling?
The adoption share by itself does not establish the direction of demand for any particular mineral. That requires compatible deployment quantities, chemistry and design distributions, material intensities and the relevant time comparison. This page reports the supported adoption bounds without inventing those missing model inputs.
Does a zero conventional-model cell mean the mineral is never used in conventional vehicles?
The zero is an explicit value in this particular source model. It should remain attached to that row and boundary. It does not establish universal absence across vehicle technologies, manufacturing operations or later model designs.
Why is the calculated benchmark 6.1065 rather than exactly six?
AMR sums the nine offered CSV categories and divides the resulting electric total by the conventional total. The source’s executive summary uses a rounded six-times characterization. Both remain intelligible when their precision and scope are stated. IEA, original report executive summary.
Does over half of EV battery capacity mean over half of EVs?
Capacity weighting gives larger packs more weight. The source defines the chemistry share using battery capacity of registered four-wheeler EVs, with its stated exclusions. A registration-count share needs its own evidence and should not inherit the capacity-share percentage. IEA, chemistry-chart notes.
Are the 2025 adoption figures final measurements?
The source notes identify 2025 values as estimated from the latest available data. Preserve that status when quoting the market context. The later publication date does not turn the older 2021 technology model into a current observed fleet average.
Methodology and Sources
AMR inspected the IEA chart capture and its offered CSV, preserving the original download preamble, units and category labels. The chart was last updated 5 May 2021. Its notes define the full-vehicle boundary, excluded steel and aluminium, 75 kWh NMC622 cathode assumption and graphite-based anode. The original report executive summary supplies the rounded six-times characterization.
The category table transcribes all nine source material columns for both vehicles. AMR calculates each electric-minus-conventional difference, its share of the total increment, the electric-side included-category composition and ratios where the conventional denominator is positive. The totals, selected-material contribution and aggregate ratio are calculated from those same input cells. No source zero is changed into a missing value or a universal technology claim; no missing value is replaced with zero.
Market context comes separately from the IEA commentary published 13 February 2026 and its chart notes. The 2025 data are estimates. EV chemistry shares retain capacity weighting, four-wheeler coverage, LFMP inclusion and stockpiling exclusions. BESS statements and application-deployment shares keep their own population labels. Inequalities remain inequalities. AMR’s deployment index assigns 2020 = 100 and applies the reported sixfold relationship to obtain 2025 = 600, without inferring an absolute deployment total or intermediate series.
The downloadable source-cell ledger gives the primary URL, table or paragraph locator, value and calculation for every presented table cell. The standalone reproduction program reads the supplied CSVs and verifies the arithmetic, total boundaries, defined ratios and preserved market bounds. Reproducibility here means reproducing AMR’s calculations and transcriptions. It does not mean independently rebuilding the IEA’s underlying vehicle model or market-estimation system.
Glossary
- Included-category total. AMR’s sum of the nine material columns in the offered vehicle-chart CSV, excluding steel and aluminium under the source notes.
- Glider. The rest of the vehicle within the source’s whole-vehicle boundary, alongside its battery and motor.
- NMC. Lithium nickel manganese cobalt oxide, with formulation labels preserved as named in the source.
- NCA. Lithium nickel cobalt aluminium oxide, included in the source’s high-nickel grouping.
- NMCA. Lithium nickel manganese cobalt aluminium oxide, also included in that grouping.
- LFP. Lithium iron phosphate; the newer IEA chart grouping also includes LFMP.
- LFMP. Lithium iron manganese phosphate, retained within LFP under the source’s chart notes.
- Capacity-weighted share. A share based on battery capacity rather than a simple count of vehicles or packs.
- BESS. Battery energy storage systems, a separate application from registered EVs.
- Nameplate capacity. A stated production capability, which should remain distinct from actual output or deployment.
- Bound. A threshold statement such as greater than 50%, rather than an exact observed percentage.
Sources
- IEA, Minerals used in electric cars compared to conventional cars. Chart updated 5 May 2021; offered CSV and notes are the primary evidence for the vehicle model and AMR’s kilogram calculations.
- IEA, The Role of Critical Minerals in Clean Energy Transitions, executive summary. Original 2021 context for the rounded six-times statement and identical vehicle-chart boundary notes.
- IEA, Global battery markets are growing strongly and so are the supply risks. Commentary published 13 February 2026; primary context for estimated 2025 deployment, chemistry shares, price bounds and chart definitions.