Key Takeaways
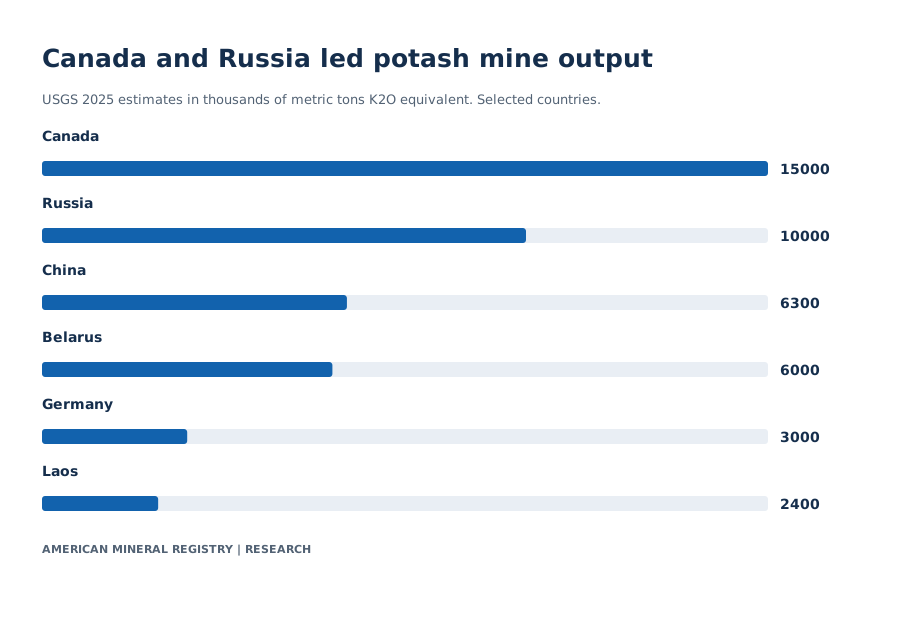
- USGS estimated Canada’s 2025 mine output at 15.0 million metric tons of K2O equivalent, Russia’s at 10.0 million, China’s at 6.3 million and Belarus’s at 6.0 million. Their combined share was about 76.1% of the rounded world total.
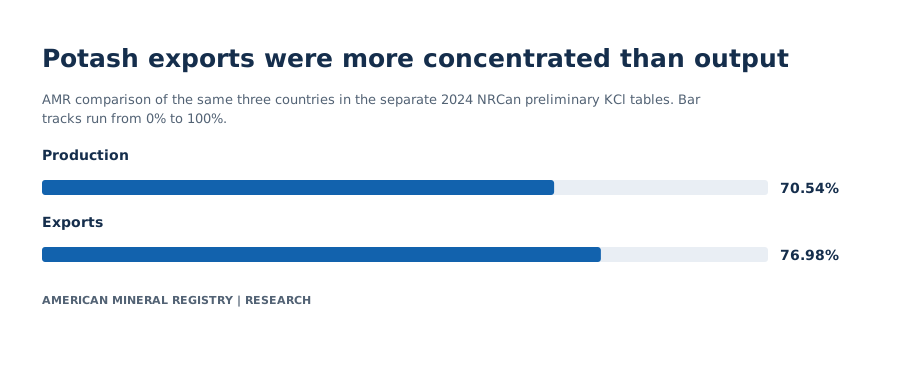
- In Natural Resources Canada’s preliminary 2024 potassium chloride tables, Canada, Russia and Belarus accounted for 70.54% of production and 76.98% of exports, calculated from each table’s own quantities.
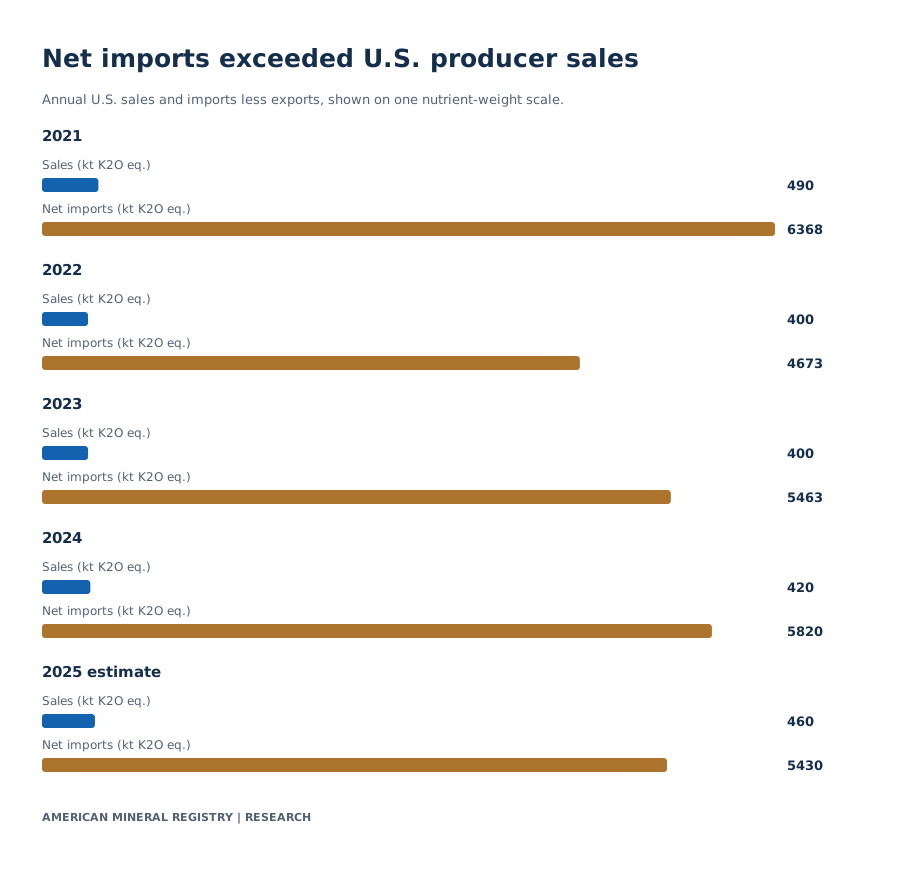
- USGS reports 5.600 million metric tons of U.S. imports and 0.170 million of exports for 2025, both in K2O equivalent. Net imports of 5.430 million divided by reported apparent use of 5.900 million give 92.03%, near the published 92%.
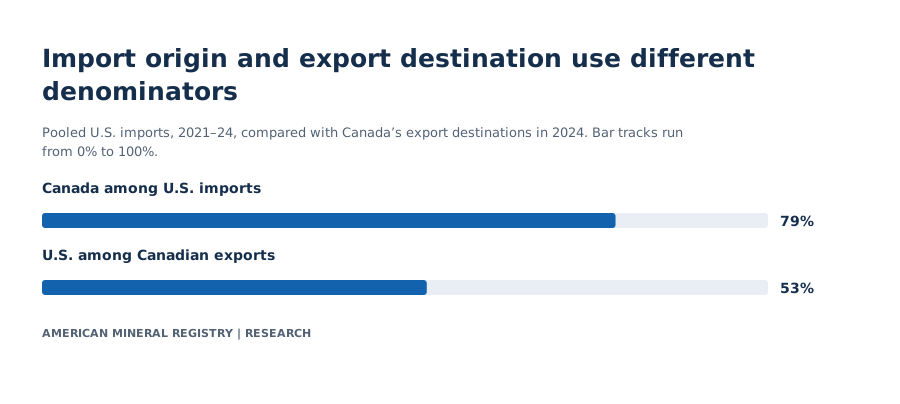
- For 2021 through 2024, Canada supplied 79% of pooled U.S. potash imports. The 53% figure from Natural Resources Canada describes the U.S. share of Canada’s 2024 exports and uses a different denominator.
Where is potash mined?
Canada led the USGS 2025 mine table with 15.0 million metric tons of potassium oxide equivalent, about 30.6% of the rounded world total. Russia accounted for about 20.4%, China 12.9% and Belarus 12.2%. The table covers each named producer, the source’s other-countries category and the global total. Potash output reflects marketed potassium-bearing material on a common nutrient basis. (USGS Potash world mine table, p. 2)

View chart data
USGS 2025 estimates in thousands of metric tons K2O equivalent. Selected countries.
| Producer | kt K2O equivalent |
|---|---|
| Canada | 15000 |
| Russia | 10000 |
| China | 6300 |
| Belarus | 6000 |
| Germany | 3000 |
| Laos | 2400 |
Values and definitions are also readable in HTML. Source precision and scope apply.
USGS Potash world mine table, p. 2 Original primary evidence
| Country or group | 2024 mine output (kt K2O eq.) | 2025 estimated mine output (kt K2O eq.) | AMR 2025 share (%) | AMR year change (%) |
|---|---|---|---|---|
| Canada | 14400 | 15000 | 30.6122 | 4.1667 |
| Russia | 10000 | 10000 | 20.4082 | 0.0000 |
| China | 6300 | 6300 | 12.8571 | 0.0000 |
| Belarus | 5000 | 6000 | 12.2449 | 20.0000 |
| Germany | 2500 | 3000 | 6.1224 | 20.0000 |
| Laos | 2400 | 2400 | 4.8980 | 0.0000 |
| Israel | 2260 | 2000 | 4.0816 | -11.5044 |
| Jordan | 1730 | 1800 | 3.6735 | 4.0462 |
| Chile | 564 | 600 | 1.2245 | 6.3830 |
| United States | 410 | 500 | 1.0204 | 21.9512 |
| Spain | 489 | 450 | 0.9184 | -7.9755 |
| Other countries | 350 | 350 | 0.7143 | 0.0000 |
| Brazil | 331 | 300 | 0.6122 | -9.3656 |
| World total (rounded) | 46700 | 49000 | 100.0000 | 4.9251 |
Output grew by about 2.3 million metric tons of K2O equivalent from 2024 to 2025 using the two world values in the same edition. That is approximately 4.9%. The highest-output countries did not all move together. Canada increased by 0.6 million tons, Belarus by 1.0 million and Germany by 0.5 million. USGS estimated unchanged output for Russia, China and Laos across those two years. USGS flags the 2024 values for Belarus, China, Germany, Laos and Russia as estimates. Use the published rounded total for world output. Small values and changes can be more sensitive to reporting precision.
Two countries can be the biggest producers and still play different roles in exports. Mine output describes where potash originates. Output sold locally can stay outside world trade. Product stocks can also move between periods. The concentration comparison below uses one source and one year so that the production and export denominators are explicit.
Why do 2024 production figures appear to change?
A comparison of two USGS editions shows 48.0 million metric tons of K2O equivalent for 2024 in the 2025 edition and 46.7 million for the same year in the 2026 edition. The latter is 1.3 million tons lower, or about 2.71%. Belarus changed from 7.0 million to 5.0 million, Germany from 3.0 million to 2.5 million and Laos from 1.5 million to 2.4 million. USGS mentions updated company and industry reporting for those revisions. (USGS 2025 Potash, p. 2, USGS 2026 Potash, p. 2)
| Country or group | 2024 in MCS 2025 (kt K2O eq.) | 2024 in MCS 2026 (kt K2O eq.) | AMR revision (kt K2O eq.) | AMR revision (%) |
|---|---|---|---|---|
| United States | 420 | 410 | -10 | -2.3810 |
| Belarus | 7000 | 5000 | -2000 | -28.5714 |
| Brazil | 360 | 331 | -29 | -8.0556 |
| Canada | 15000 | 14400 | -600 | -4.0000 |
| Chile | 750 | 564 | -186 | -24.8000 |
| China | 6300 | 6300 | 0 | 0.0000 |
| Germany | 3000 | 2500 | -500 | -16.6667 |
| Israel | 2400 | 2260 | -140 | -5.8333 |
| Jordan | 1800 | 1730 | -70 | -3.8889 |
| Laos | 1500 | 2400 | 900 | 60.0000 |
| Russia | 9000 | 10000 | 1000 | 11.1111 |
| Spain | 400 | 489 | 89 | 22.2500 |
| Other countries | 440 | 350 | -90 | -20.4545 |
| World total (rounded) | 48000 | 46700 | -1300 | -2.7083 |
The revision can materially change a headline. A comparison of the earlier 48.0-million-ton estimate with the new 49.0-million-ton estimate would suggest about 2.1% year-on-year growth. The comparison between 46.7 and 49.0 million from the 2026 edition gives 4.9%. The first calculation mixes a year change and a revision. The tables expose both comparisons and keep their underlying inputs available.
Who exports potash, and how concentrated is trade?
Natural Resources Canada reports 59.210 million tonnes of world potassium chloride exports for 2024, preliminary. Canada exported 22.916 million tonnes, Russia 11.590 million and Belarus 11.074 million. The total for those three is 45.580 million. Dividing by reported world exports gives 76.98%. The same three accounted for 70.54% of production in the agency’s parallel 2024 potassium chloride table. (Natural Resources Canada Potash facts, International context and Trade)

View chart data
AMR comparison of the same three countries in the separate 2024 NRCan preliminary KCl tables. Bar tracks run from 0% to 100%.
| Stage | Combined share (%) |
|---|---|
| Production | 70.54 |
| Exports | 76.98 |
Values and definitions are also readable in HTML. Source precision and scope apply.
Natural Resources Canada Potash facts Original primary evidence
| Stage | Period | Canada, Russia and Belarus (kt KCl product) | Published world total (kt KCl product) | AMR combined share (%) |
|---|---|---|---|---|
| Production | 2024 preliminary | 53662 | 76076 | 70.5374 |
| Exports | 2024 preliminary | 45580 | 59210 | 76.9802 |
| Country or group | 2024 preliminary (kt KCl product) | NRCan published share (%) |
|---|---|---|
| Canada | 22916 | 38.7 |
| Russia | 11590 | 19.6 |
| Belarus | 11074 | 18.7 |
| Israel | 3411 | 5.8 |
| Germany | 3225 | 5.5 |
| Other countries | 6964 | 11.8 |
| World total | 59210 | 100 |
| Country or group | 2024 preliminary (kt KCl product) | NRCan published share (%) |
|---|---|---|
| Canada | 24962 | 32.8 |
| Russia | 16600 | 21.8 |
| Belarus | 12100 | 15.9 |
| China | 6508 | 8.6 |
| Israel | 3707 | 4.9 |
| Other countries | 12199 | 16.0 |
| World total | 76076 | 100.0 |
This is a comparison of shares at each stage. It does not measure the proportion of the group’s own mine output it exports. Exports in any one year can include previously produced stocks and cross-border movements of products from other locations. For the same reason, subtraction of world exports from world output cannot establish domestic consumption. The finding is about concentration in the observed trade series.
China is fourth in NRCan’s preliminary production ranking while Israel and Germany are among its named leading exporters. Different names across the tables are expected when some large producers have large domestic markets. The remaining countries are grouped by the source. A country excluded from the named rows may still produce or export potash.
Why is the USGS world total smaller than the Canadian government’s total?
The published units answer the immediate discrepancy. USGS estimates 46.7 million metric tons of K2O equivalent for world mine production in 2024. Natural Resources Canada reports 76.076 million tonnes of potassium chloride for 2024, preliminary. Nutrient-equivalent mass and potassium chloride product mass are different measures. Coverage, reporting and rounding can also differ across the two publications. There is insufficient evidence here to attribute the entire difference to a single conversion factor.
A potassium chloride product labeled 60% K2O equivalent would represent 60 tonnes of K2O equivalent per 100 tonnes of product. That is an arithmetic illustration for a stated grade. Applying it to every tonne in a world dataset would assume the same grade or product mix everywhere. Use a product-specific assay when converting and retain the source’s existing units for global statistics.
How dependent is the U.S. on potash imports?
The U.S. was 92% net import reliant for potash in 2025 in the USGS estimate. The agency reports gross imports of 5.600 million metric tons K2O equivalent, exports of 0.170 million, and apparent consumption of 5.900 million. Subtracting exports gives a calculated 5.430 million tons of net imports. That is 92.03% of the displayed apparent use. Gross imports alone yield a different figure because some potash moves out of the country. (USGS Potash, p. 1 and footnotes on p. 2)

View chart data
Annual U.S. sales and imports less exports, shown on one nutrient-weight scale.
| Year | Sales (kt K2O eq.) | Net imports (kt K2O eq.) |
|---|---|---|
| 2021 | 490 | 6368 |
| 2022 | 400 | 4673 |
| 2023 | 400 | 5463 |
| 2024 | 420 | 5820 |
| 2025 estimate | 460 | 5430 |
Values and definitions are also readable in HTML. Source precision and scope apply.
USGS Potash U.S. salient statistics, p. 1 Original primary evidence
| Year and status | Marketable production (kt K2O eq.) | Marketable sales (kt K2O eq.) | Imports (kt K2O eq.) | Exports (kt K2O eq.) | AMR imports less exports (kt K2O eq.) | AMR sales plus net imports (kt K2O eq.) | USGS apparent use (kt K2O eq.) | USGS net import reliance (%) | AMR net imports / rounded apparent use (%) |
|---|---|---|---|---|---|---|---|---|---|
| 2021 | 480 | 490 | 6480 | 112 | 6368 | 6858 | 6900 | 93 | 92.2899 |
| 2022 | 430 | 400 | 4940 | 267 | 4673 | 5073 | 5100 | 92 | 91.6275 |
| 2023 | 390 | 400 | 5620 | 157 | 5463 | 5863 | 5900 | 93 | 92.5932 |
| 2024 | 410 | 420 | 5970 | 150 | 5820 | 6240 | 6200 | 94 | 93.8710 |
| 2025 estimate | 500 | 460 | 5600 | 170 | 5430 | 5890 | 5900 | 92 | 92.0339 |
For this commodity the source defines U.S. apparent consumption as producer sales plus imports less exports. The formula uses the 2025 sales estimate of 460,000 tons, while the year’s mine production estimate was 500,000 tons. A producer can sell stock made earlier or hold current output for later sales. The source does not assign the difference here to a particular change in inventory.
The 2025 displayed inputs give 5.890 million tons of apparent consumption, 10,000 below the 5.900 million published figure. Putting mine production into that formula would instead give 5.930 million, but it changes the method. USGS also prints 93% for 2021 while our ratio from the displayed gross imports, exports and apparent use is 92.29%. The agency uses rounded table values and the domestic footnote limits the precision of proprietary data. The source does not provide unrounded inputs to resolve each gap. Cite the published reliance value as USGS’s statistic and label the recalculation.
The table covers five years on the same footing. USGS’s published net import reliance runs from 92% to 94% over 2021 to 2025. Gross imports and apparent use moved more than the reliance ratio. This is useful context for stories about trade exposure. A country can depend on imports to a similar degree in years when it buys substantially different absolute quantities.
Where do U.S. potash imports come from?
Canada supplied 79% of U.S. potash imports in the pooled 2021 to 2024 USGS reporting window. Russia supplied 12%, Israel 3% and other origins 6%. Natural Resources Canada separately reports that the United States received 53% of Canadian potash exports in 2024, ahead of Brazil at 14% and China at 6%. The different percentages describe the same trading relationship from opposite sides and over different windows. (USGS Potash Import Sources, p. 1, Natural Resources Canada Potash facts, Trade)

View chart data
Pooled U.S. imports, 2021–24, compared with Canada’s export destinations in 2024. Bar tracks run from 0% to 100%.
| Series | Share (%) |
|---|---|
| Canada among U.S. imports | 79 |
| U.S. among Canadian exports | 53 |
Values and definitions are also readable in HTML. Source precision and scope apply.
USGS Potash import sources, p. 1 Original primary evidence · Natural Resources Canada, export destinations
| Destination | Share of 2024 Canadian potash exports (%) |
|---|---|
| United States | 53 |
| Brazil | 14 |
| China | 6 |
Pooled import origin shares describe one historical observation window. Applying 79% to the 2025 trade table would assume that its mix stayed constant into an out-of-window year. Combining the import-origin share and net reliance to estimate Canadian share of U.S. consumption would require compatible trade, origin, exports and time data. The figures here are suitable for two separate statements about sourcing and import reliance.
Natural Resources Canada places active Canadian potash mining in Saskatchewan in this source edition. For a reader tracing supply, the producer, importing market, delivery location and fertilizer grade are distinct data fields. A global figure on concentrated mining does not identify the reliability of a given location or delivery contract.
What do potash prices measure?
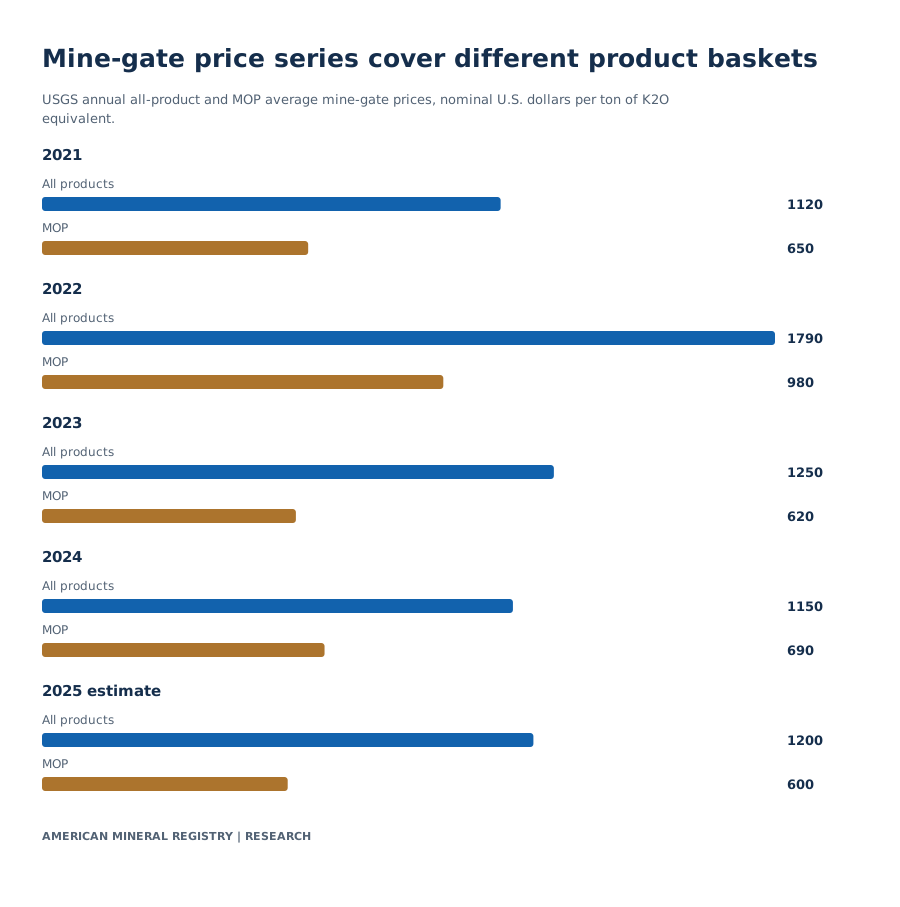
USGS estimates a 2025 U.S. mine-gate price of $1,200 per metric ton of K2O equivalent across all included potash products. Its muriate of potash (MOP) average was $600 on that same nutrient basis. The previous year the figures were $1,150 and $690. One series rose while the other fell. The all-product average includes MOP, sulfate of potash (SOP), and sulfate of potash-magnesia (SOPM). It covers products with different uses and sale prices. (USGS Potash U.S. salient statistics, pp. 1 to 2)

View chart data
USGS annual all-product and MOP average mine-gate prices, nominal U.S. dollars per ton of K2O equivalent.
| Year | All products | MOP |
|---|---|---|
| 2021 | 1120 | 650 |
| 2022 | 1790 | 980 |
| 2023 | 1250 | 620 |
| 2024 | 1150 | 690 |
| 2025 estimate | 1200 | 600 |
Values and definitions are also readable in HTML. Source precision and scope apply.
USGS Potash U.S. price table, p. 1 Original primary evidence
| Year and status | All products (nominal USD/t K2O eq. FOB mine) | MOP (nominal USD/t K2O eq. FOB mine) | Mine and mill employment (estimated) |
|---|---|---|---|
| 2021 | 1120 | 650 | 900 |
| 2022 | 1790 | 980 | 900 |
| 2023 | 1250 | 620 | 900 |
| 2024 | 1150 | 690 | 900 |
| 2025 estimate | 1200 | 600 | 900 |
The all-product average gives a view of the products counted at the U.S. mine gate. The MOP average describes an individual product group. Their difference does not give a quoted sulphate premium without the underlying product prices and weights. Freight, taxes, blending and distribution affect delivered fertilizer prices. Export benchmarks can use product tonnes and different delivery terms. Compare quotes only when the product grade, point of delivery, currency and date match.
The USGS U.S. narrative estimates that the fertilizer industry accounted for about 85% of domestic potash sales in 2025. NRCan cites about 95% of potash used in fertilizers at its broader level. These describe different geographies and sales or use populations. A farmer comparing MOP and SOP needs the chemistry and product specification relevant to the crop. A global minerals writer needs the source’s series and denominator.
How large is fertilizer demand compared with potash capacity?
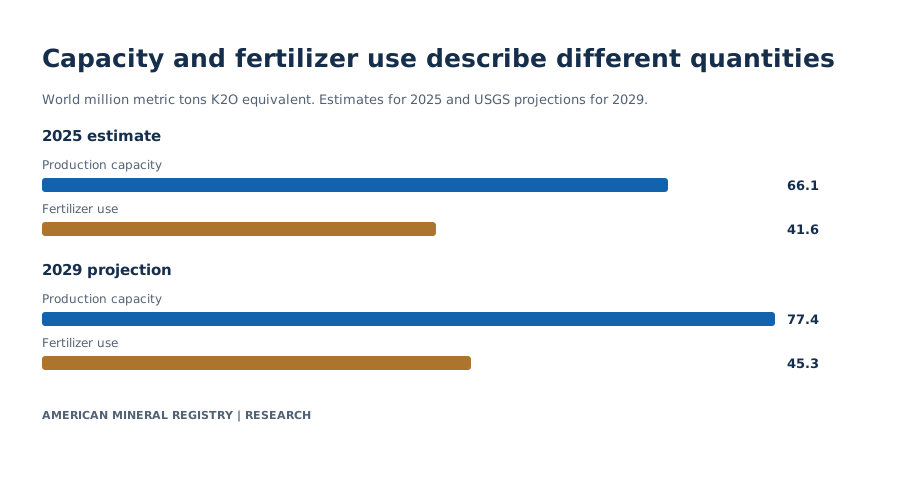
USGS estimates world potash consumption in fertilizer at 41.6 million metric tons of K2O equivalent in 2025, up from 40.6 million in 2024. The chapter estimates 66.1 million tons of world annual production capacity in 2025. Its 2029 projections are 45.3 million for fertilizer use and 77.4 million for capacity. The use and capacity measures represent different stages of the supply chain, even though both use K2O equivalent. (USGS Potash, pp. 1 to 2)

View chart data
World million metric tons K2O equivalent. Estimates for 2025 and USGS projections for 2029.
| Period | Production capacity | Fertilizer use |
|---|---|---|
| 2025 estimate | 66.1 | 41.6 |
| 2029 projection | 77.4 | 45.3 |
Values and definitions are also readable in HTML. Source precision and scope apply.
USGS Potash trends and world capacity, pp. 1 to 2 Original primary evidence
| Series | Period and status | Million metric t K2O eq. |
|---|---|---|
| Potash consumption in fertilizer | 2024 estimate | 40.6 |
| Potash consumption in fertilizer | 2025 estimate | 41.6 |
| Potash consumption in fertilizer | 2029 projection | 45.3 |
| Annual production capacity | 2025 estimate | 66.1 |
| Annual production capacity | 2029 projection | 77.4 |
The projected capacity change is 11.3 million metric tons, or about 17.1%, from 2025 to 2029. The projected use change is 3.7 million, or about 8.9%. Subtracting fertilizer use from capacity cannot show unmet demand, idle capacity or inventories. A complete physical balance would require all uses, actual output and stocks over the same period. Proposed mines and expansions also have schedules and utilization assumptions.
K2O equivalents are useful here because the same amount of potassium can be supplied in different salts. Potassium, one of the major plant nutrients, has a distinct role from nitrogen and phosphorus. When a source calls its figures consumption in fertilizer, keep that boundary even in a general article about food security or fertilizer demand.
Frequently asked questions
Which country produces the most potash?
Canada had the largest named potash mine production in the USGS 2025 estimates at 15.0 million metric tons of K2O equivalent. It also led NRCan’s 2024 production and export tables for potassium chloride measured in product tonnes. The corresponding quantities use different years and unit bases.
What is the difference between potash and potassium chloride?
Potash is a family of water-soluble potassium compounds traded or used for fertilizer and industry. Potassium chloride is the product commonly called muriate of potash or MOP. Potassium sulfate and potassium magnesium sulfate are different products. Check whether the data refers to one product, several products or nutrient content.
Does the U.S. produce potash?
Yes. USGS estimates 500,000 metric tons of marketable production on a K2O-equivalent basis in 2025 and describes operations in New Mexico and Utah. U.S. apparent use was about 5.9 million tons on the same nutrient basis. Details on producer sales, imports and exports remain separate in the supply balance.
Why can apparent use differ from fertilizer applied on farms?
Apparent use is based on commercial flows. The USGS potash series includes the available supply counted as domestic use and can cover industrial purchasers. A measure of nutrient applied on farms would require sales or application data with its own geographic and agricultural boundary.
Which statistic should I use for a story about supply disruption?
Use the concentration of world exports when the issue is internationally traded potassium chloride. Use the domestic reliance and pooled origin tables for U.S. supply exposure. The two sets can appear in the same story with separate units and periods. A claim about the impact of a specific disruption would need contemporaneous production, shipping and inventory evidence. AMR’s U.S. critical mineral import dependence shows how reliance differs across mineral grades and product groups. The oil and LNG shipping chokepoints study gives a separate example of measuring trade exposure along a route.
Methodology and Sources
USGS figures in this study come from the Mineral Commodity Summaries Potash chapters. The standard unit is thousands of metric tons of K2O equivalent except for prices, employment or a clearly labeled quantity in millions. The production and reliance values for 2025 are estimates. The two-vintage table compares the 2024 column in each edition. The 2029 values are projections and keep the source’s stated period. Rounded country and world values, provisional data and the original reported reliance are retained.
Natural Resources Canada’s 2024 figures come from its named country tables under International context and Trade. These use thousand tonnes of potassium chloride product and are preliminary. AMR computes the three-country concentration by adding the exact displayed Canada, Russia and Belarus quantities in each table and dividing by its own total. The percentage-point difference uses those two shares. Top Canadian export destinations are the named leaders from the agency’s text. Price series preserve the annual period, product scope and mine-gate terms.
U.S. net imports are imports less exports. The check on apparent use adds marketable producer sales. The derived ratio divides those net imports by published rounded apparent use. The file preserves the differences between the calculation from rounded inputs and the published ratio. Method notes, source locators and scripts are available in the download bundle.
Glossary
- Potash. A group of commercially used, water-soluble potassium-bearing compounds.
- K2O equivalent. A nutrient reporting unit that expresses potassium content as the equivalent mass of potassium oxide.
- MOP. Muriate of potash, the fertilizer product potassium chloride.
- SOP and SOPM. Sulfate of potash and sulfate of potash-magnesia, respectively.
- Net imports. Gross imports minus exports, measured with a consistent commodity and weight basis.
- Apparent consumption. The USGS potash measure of marketable sales plus net imports.
- Annual capacity. Potential annual output under the source’s capacity definition.
- Mine-gate price. The producer’s price at the mine on the specified basis, before downstream delivery and sales costs.
Sources
- USGS Mineral Commodity Summaries 2026, Potash. U.S. annual series, trade origins, prices, reliance, world production and projections.
- USGS Mineral Commodity Summaries 2025, Potash, p. 2. The earlier 2024 mine table used for matched-year revisions.
- Natural Resources Canada Potash facts. Preliminary 2024 world potassium chloride production and export country tables and the destinations of Canadian exports.
- USGS Potash, p. 1. Domestic sales, imports, prices and consumption.
- USGS Potash, p. 2. World production and capacity, definition notes.
- Natural Resources Canada Potash facts, Trade. Trade and destination table.