Start with the material you are trying to replace. A manufacturer deciding how much primary copper to buy needs usable scrap or secondary metal of the right grade. An analyst calculating the size of the national secondary supply needs an accounting denominator that includes the right flows. A city calculating how much discarded metal was captured needs the amount discarded in the first place. These questions have different numerators as well as different denominators.
This reference separates U.S. 2021 to 2025 commodity accounts, IEA global 2015 and 2023 recycled input estimates, and a 2050 scenario for new mine development. Each panel can be independently cited. The U.S. calculation compares displayed values within the same USGS edition, so a revision to one commodity account can be reviewed without reinterpreting the global scenario.
Key Takeaways
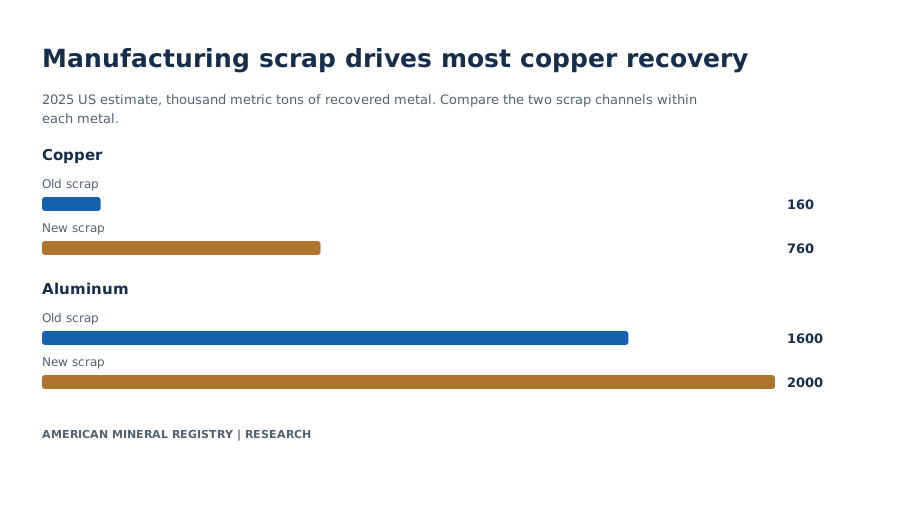
- U.S. copper scrap recovered in 2025 included 160 thousand metric tons of old scrap copper and 760 thousand metric tons of new scrap copper. Manufacturing scrap accounts for 82.61% of the displayed combined mass. (USGS Copper, 2025 recycling paragraph, Nov 2026).
- U.S. aluminum secondary production in 2025 included 1.60 million metric tons from old scrap and 2.00 million metric tons from new scrap. Old scrap accounts for 44.44% of their displayed sum. (USGS Aluminum, U.S. salient statistics, Nov 2026).
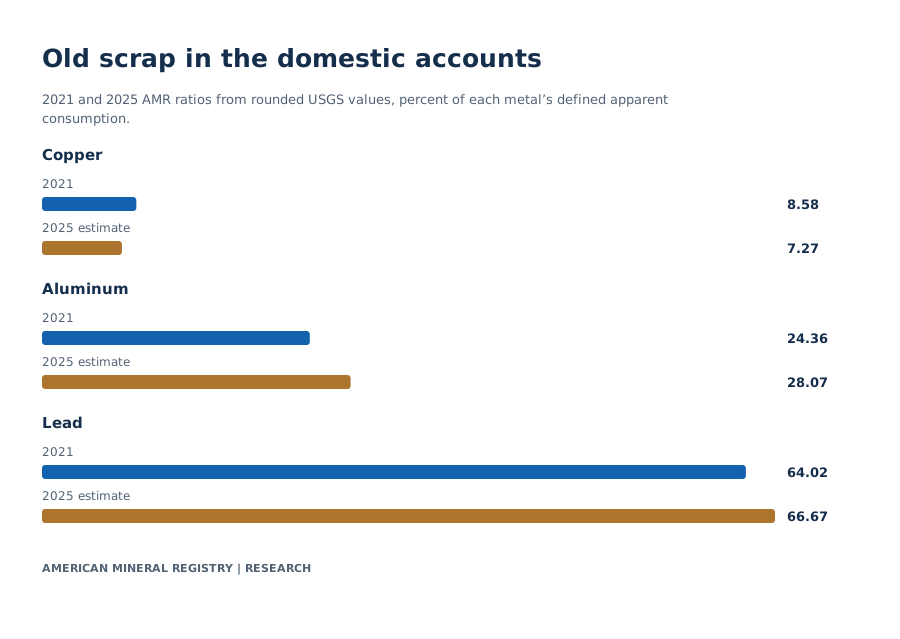
- Dividing displayed old-scrap figures by each metal’s own apparent consumption in 2025 gives 7.27% for copper, 28.07% for aluminum and 66.67% for lead. Each uses its own USGS definition. (Copper, Nov 2026), (Aluminum, Nov 2026), (Lead, Nov 2026).
- The IEA estimates global recycled input shares moved from 37% to 33% for copper, 35% to 31% for nickel, and 24% to 26% for aluminum between 2015 and 2023. (IEA recycling analysis, historical recycled input, Nov 2026).
- The IEA’s 2050 Announced Pledges Scenario estimates lower new mine development needs of 40% for copper and cobalt, and 25% for lithium and nickel. (IEA recycling analysis, new mining requirements, Nov 2026).
How much U.S. metal comes from old and new scrap?
In the USGS 2025 estimates, manufacturing scrap supplied about 4.75 times as much recovered copper as post-consumer scrap. The aluminum split was closer, with 1.25 times as much new as old scrap in the reported secondary production table. (USGS Copper, Nov 2026), (USGS Aluminum, Nov 2026).

View chart data
2025 US estimate, thousand metric tons of recovered metal. Compare the two scrap channels within each metal.
| Metal | Old scrap | New scrap |
|---|---|---|
| Copper | 160 | 760 |
| Aluminum | 1600 | 2000 |
Values and definitions are also readable in HTML. Source precision and scope apply.
| Metal | Old scrap recovery (kt metal) | New scrap recovery (kt metal) | Displayed aggregate (kt metal) | Old share of aggregate (%) | New share of aggregate (%) | Boundary |
|---|---|---|---|---|---|---|
| Copper | 160 | 760 | 920 | 17.3913 | 82.6087 | AMR sum of displayed old and new recovery figures |
| Aluminum | 1600 | 2000 | 3600 | 44.4444 | 55.5556 | AMR sum of displayed old and new secondary production |
Old scrap becomes available when a product or structure leaves service. It includes discarded aluminum products and, for lead, largely used lead-acid batteries. New scrap arises while making a product, such as metal trimmed from a fabrication operation. Both can become usable input. They tell different stories about where supply comes from. The copper numbers establish a strong contribution from manufacturing scrap in this accounting year, with old scrap providing a much smaller portion of recovered copper mass. That result does not establish how much copper consumers could have discarded, collected or sent through other routes.
The 2025 copper calculation adds the 160 and 760 thousand metric tons in the recycling paragraph to get 920 thousand metric tons. Keeping the reported numbers rounded, the new scrap share is 760 divided by 920. The aluminum calculation applies the same mix arithmetic to the secondary production rows, 1,600 plus 2,000 thousand metric tons. USGS separately summarizes the purchased-scrap aluminum split as about 56% new and 44% old. The calculation and the rounded prose are consistent.
Each row compares channels inside a metal's own accounting system. The two rows do not form a combined national total across metals. In practical procurement, a ton of metal was counted for its designated metal content and processing boundary. A buyer still needs its alloy, impurity profile, form and location before it can substitute for a primary purchase.
Copper provides an additional accounting trap. USGS separately reports 60 thousand metric tons of secondary refinery production in the 2025 table. Its old-scrap recovery definition covers material converted to refined metal, alloys and other forms by several types of processors. Treat the refinery row as a stage of processing and use the source's explicit old plus new recovery values when calculating total scrap recovery. Adding the refinery figure again can count material already in another flow.
Why do 30%, 28% and 70% need different labels?
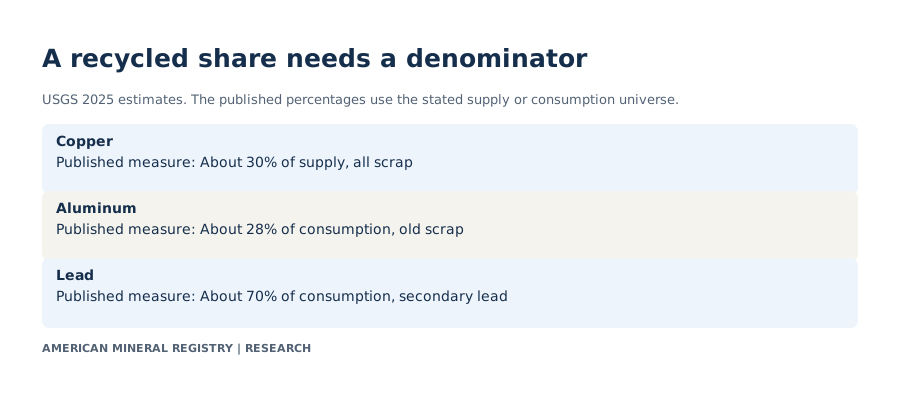
The USGS 30% copper figure uses a supply denominator that includes both old and new scrap, while its 28% aluminum figure compares old scrap with apparent consumption. The 70% lead figure describes secondary production relative to apparent domestic lead consumption. Quote the metal and accounting measure every time. (Copper footnote 5, Nov 2026), (Aluminum footnotes 2–4, Nov 2026), (Lead footnote 2, Nov 2026).

View chart data
USGS 2025 estimates. The published percentages use the stated supply or consumption universe.
| Metal | Published measure |
|---|---|
| Copper | About 30% of supply, all scrap |
| Aluminum | About 28% of consumption, old scrap |
| Lead | About 70% of consumption, secondary lead |
Values and definitions are also readable in HTML. Source precision and scope apply.
USGS Copper Original primary evidence · USGS Aluminum · USGS Lead
| Metal | Reported 2025 share (%) | Numerator | Denominator | Qualifier |
|---|---|---|---|---|
| Copper | 30 | Copper recovered from old and new scrap | US copper supply including new and old scrap | About |
| Aluminum | 28 | Aluminum recovery from old scrap | Apparent consumption | About |
| Lead | 70 | Secondary lead, nearly all from old scrap | Apparent domestic consumption | Rounded estimate |
Primary source · Primary source · Primary source · Download matching CSV
| Metal and measure | Production treatment | Imports and exports | Adjustment |
|---|---|---|---|
| Copper apparent consumption | Primary refined production plus old scrap copper | Refined net imports | Refined stock changes |
| Copper supply | Primary refined production plus old and new scrap copper | Refined net imports | Refined stock changes |
| Aluminum apparent consumption | Primary plus old scrap secondary production | Net imports excluding traded scrap | Stock changes |
| Aluminum apparent supply | Primary plus old and new scrap secondary production | Net imports excluding traded scrap | Stock changes |
| Lead apparent consumption | Secondary refined production from old scrap | Refined net imports | Defined without stock term in footnote |
Primary source · Primary source · Primary source · Download matching CSV
For copper, apparent consumption uses primary refined production, old scrap recovery, net refined imports and stock adjustments. The source's broader copper supply definition adds recovered new scrap. Switching from apparent consumption to supply changes the denominator as well as the coverage of recovery in the question. Dividing all recovered new and old copper by the narrower apparent consumption figure would construct a different ratio from the published 30%.
For aluminum, USGS provides two rows side by side. In 2025 apparent consumption was 5.70 million metric tons and apparent supply was 7.70 million metric tons. The 2.00 million-ton difference equals the displayed secondary production from new scrap. The differences between corresponding earlier rows are near the displayed new-scrap tonnage, with the published rounding left intact. Both footnotes exclude traded scrap from the relevant import and export terms. USGS explains that it no longer includes exported scrap because the returning material cannot be reliably traced. Traded scrap and metal produced from that scrap therefore require separate treatment.
The lead apparent-consumption definition combines secondary refined production from old scrap with net refined imports. U.S. mining and U.S. primary refining are different stages. USGS describes most concentrate production as exported after the last primary lead refinery closed, and estimates that lead-acid batteries accounted for 67% of 2025 apparent lead consumption. An operating lead mine can therefore coexist with a domestic refined supply heavily reliant on old scrap and imports.
These definitions make the published numbers auditable. They also explain why a cross-metal ranking needs the precise metric in the title. The same word, “recycled,” might refer to collection, measured refinery output, a share of supply including manufacturing scrap, or a share of consumption attributable to old scrap. One ranking cannot answer all of those questions.
What changed across the five U.S. data years?
Using each metal’s own apparent consumption denominator, AMR’s ratio of old-scrap output to consumption moved from 8.58% to 7.27% for copper and from 24.36% to 28.07% for aluminum, comparing 2021 with the USGS 2025 estimates. The displayed lead ratio moved from 64.02% to 66.67%. (Copper salient statistics, Nov 2026), (Aluminum salient statistics, Nov 2026), (Lead salient statistics, Nov 2026).

View chart data
2021 and 2025 AMR ratios from rounded USGS values, percent of each metal’s defined apparent consumption.
| Metal | 2021 | 2025 estimate |
|---|---|---|
| Copper | 8.58 | 7.27 |
| Aluminum | 24.36 | 28.07 |
| Lead | 64.02 | 66.67 |
Values and definitions are also readable in HTML. Source precision and scope apply.
USGS Aluminum Original primary evidence · USGS Copper · USGS Lead
| Year | Copper old scrap / apparent consumption (%) | Aluminum old scrap / apparent consumption (%) | Lead old scrap refinery / apparent consumption (%) | Precision note |
|---|---|---|---|---|
| 2021 | 8.5787 | 24.3590 | 64.0244 | Displayed source values |
| 2022 | 8.3978 | 21.4182 | 61.9632 | Displayed source values |
| 2023 | 8.1548 | 25.1208 | 67.3333 | Displayed source values |
| 2024 | 7.5269 | 26.7581 | 73.0496 | Copper old scrap estimated |
| 2025 | 7.2727 | 28.0702 | 66.6667 | 2025 estimated |
Primary source · Primary source · Primary source · Download matching CSV
| Year | Primary refinery (kt Cu) | Secondary refinery (kt Cu) | Old scrap copper (kt Cu) | Apparent consumption (kt Cu) | Net import reliance (%) | 2024 old scrap status | Year status |
|---|---|---|---|---|---|---|---|
| 2021 | 931 | 49 | 169 | 1970 | 44 | See year status | Published historical value |
| 2022 | 917 | 40 | 152 | 1810 | 41 | See year status | Published historical value |
| 2023 | 843 | 39 | 137 | 1680 | 42 | See year status | Published historical value |
| 2024 | 882 | 39 | 140 | 1860 | 45 | Estimated old scrap | Published historical value |
| 2025 | 790 | 60 | 160 | 2200 | 57 | See year status | Estimate |
| Year | Primary (kt Al) | Old scrap (kt Al) | New scrap (kt Al) | Apparent consumption (kt Al) | Apparent supply (kt Al) | Year status |
|---|---|---|---|---|---|---|
| 2021 | 889 | 1520 | 1780 | 6240 | 8020 | Published historical value |
| 2022 | 861 | 1480 | 1920 | 6910 | 8820 | Published historical value |
| 2023 | 750 | 1560 | 1870 | 6210 | 8070 | Published historical value |
| 2024 | 676 | 1560 | 2120 | 5830 | 7950 | Published historical value |
| 2025 | 660 | 1600 | 2000 | 5700 | 7700 | Estimate |
| Year | Secondary refinery old scrap (kt Pb) | Apparent consumption (kt Pb) | Refined imports (kt Pb) | Refined exports (kt gross weight) | Year status |
|---|---|---|---|---|---|
| 2021 | 1050 | 1640 | 614 | 22 | Published historical value |
| 2022 | 1010 | 1630 | 652 | 26 | Published historical value |
| 2023 | 1010 | 1500 | 519 | 23 | Published historical value |
| 2024 | 1030 | 1410 | 410 | 37 | Published historical value |
| 2025 | 1000 | 1500 | 520 | 22 | Estimate |
Read the numerator and denominator alongside each ratio. In the copper account, old scrap recovered declined from 169 to 160 thousand metric tons over the two endpoints while apparent consumption rose from 1,970 to 2,200 thousand metric tons. In aluminum, the old scrap row rose from 1,520 to 1,600 thousand metric tons and apparent consumption fell from 6,240 to 5,700 thousand metric tons. A rising aluminum ratio in this comparison therefore reflects both sides of the fraction. It is not enough to interpret the ratio as proof that a larger share of discarded aluminum was collected.
The middle years matter. Aluminum’s old-scrap ratio falls in 2022 as apparent consumption reaches 6,910 thousand metric tons and old-scrap production is 1,480 thousand metric tons. Lead's 2024 displayed ratio is about 73.05% and its 2025 ratio is about 66.67%. The U.S. summaries report the rounded 2025 lead equivalence as about 70%. AMR retains both the producer's statement and the mechanical division of displayed rounded values. Extra decimal places in the latter are arithmetic traceability, not extra precision in the measurements.
Keep the same edition when extracting a historical trend. The source marks the 2024 copper old-scrap figure as estimated inside a historical year, along with the full 2025 estimate column. A later edition may revise an endpoint. To measure the effect of a revision, compare the same year in two editions and label it as a data revision. Treat a change in the definition or coverage separately from a change in metal flows.
Why can a high recovery rate coexist with a low recycled supply share?
Collection, process recovery and recycled-input share all use different denominators. A plant can achieve a high yield on clean feedstock while secondary material supplies a modest portion of the economy. Capacity, collection and the scale of current demand determine how much material reaches the plant and how much of the total market its output can serve. (IEA, recycling system and collection constraints, Nov 2026).

View chart data
The amount available at each stage depends on collection, condition and usable output after processing.
| Stage | Reader check |
|---|---|
| Products retire | Identify contained metal and product lifetime |
| Feedstock is sorted | Track actual collection and treatment route |
| Usable output enters supply | Apply the correct product and demand boundary |
Values and definitions are also readable in HTML. Source precision and scope apply.
IEA Recycling of Critical Minerals Original primary evidence
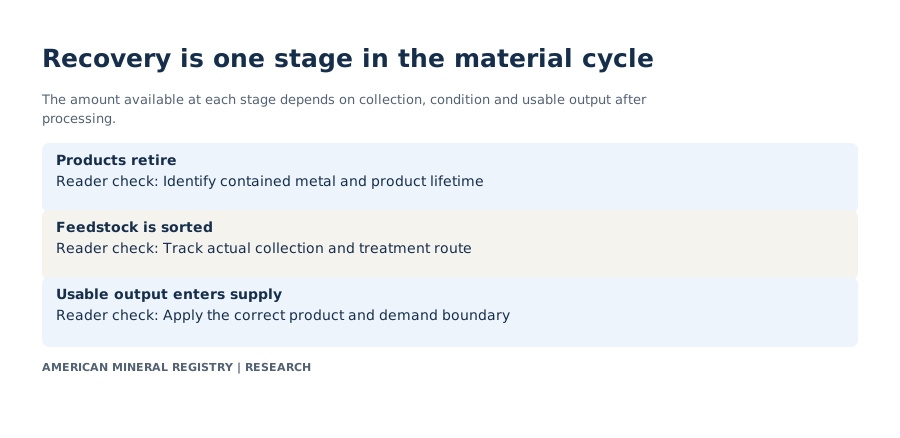
Follow one cohort through the system. First establish which products reached end of life in a specified place and time. Then estimate the portion collected and the fraction of the collected mass actually delivered to a processor. A sorting facility can reject or reroute mixtures. Smelters and refiners can produce intermediate outputs before final metal reaches a buyer. Market supply only records the output covered by the relevant accounting definition.
For an illustrative calculation, suppose 100 tons of target metal are in discarded products, 40 tons reach the processor, and the process recovers 90% of that contained input. The processor produces 36 tons. Its process yield is 90%, the recovery relative to the original discarded stock is 36%, and, if the economy uses 360 tons of the metal, this one flow supplies 10% of demand. These are fabricated inputs for an arithmetic example. They are neither USGS nor IEA observations. The example holds metal content constant throughout the chain, which is necessary to make the arithmetic compatible.
Clean manufacturing offcuts can enter the system more directly than material in a sealed product. A cell or motor can combine multiple materials, and separating them for a specified output costs time, energy and money. Products may remain in service for years and scrap may arrive late relative to a rapidly expanding market. This timing difference also explains why more total recycled metal can still coincide with a declining share of demand.
The related e-waste metal recovery study gives an observed example of denominator choice. Documented formal collection there measures equipment mass, while recovered metal mass uses the contained-metal denominator. The two percentages are useful together because the page states their separate inputs and limits. They should never be averaged into a single recycling rate.
Did recycled inputs keep up with global demand?
The IEA’s selected global endpoint estimates show declines of 4 percentage points each for copper and nickel, and an increase of 2 points for aluminum, between 2015 and 2023. That is a comparison of recycled input shares, with direct-use scrap included for copper. (IEA historical recycled-input section, Nov 2026).

View chart data
IEA historical estimates for three selected metals. Bars use published endpoints, percent.
| Metal | 2015 | 2023 |
|---|---|---|
| Copper | 37 | 33 |
| Nickel | 35 | 31 |
| Aluminum | 24 | 26 |
Values and definitions are also readable in HTML. Source precision and scope apply.
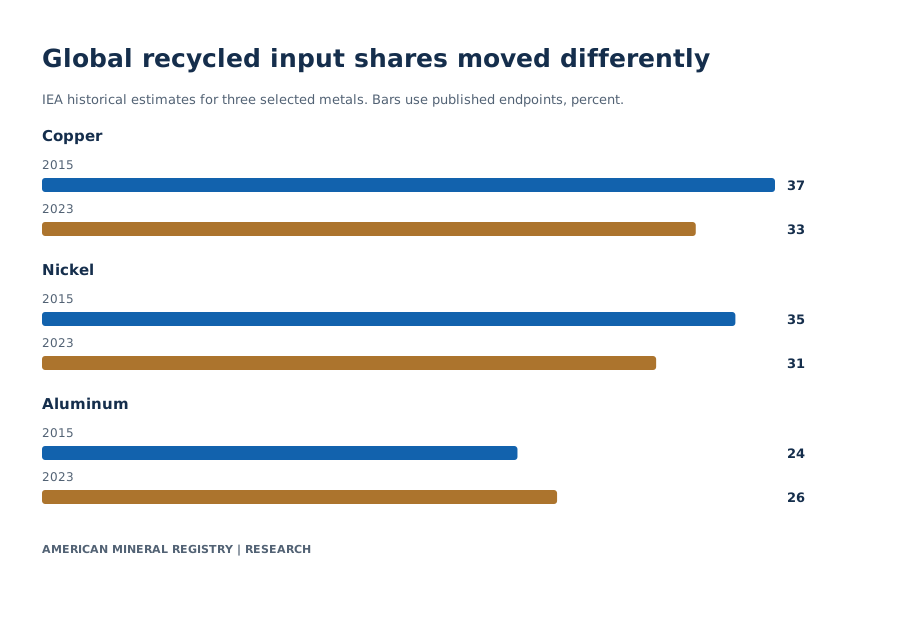
| Metal | Global 2015 recycled input share (%) | Global 2023 recycled input share (%) | AMR change (percentage points) |
|---|---|---|---|
| Copper | 37 | 33 | -4 |
| Nickel | 35 | 31 | -4 |
| Aluminum | 24 | 26 | 2 |
A share moves with the numerator relative to the denominator. If recycled output expands 10% while demand expands 20%, a 30% recycled input share becomes 27.5%, all else equal. That example demonstrates how the share can fall even as the underlying recycled tonnage grows. The selected IEA percentages alone do not establish how much tonnage changed. For an absolute change, obtain source-aligned total demand and recycled output by year.
The global estimates and the U.S. percentages earlier in this study use different years, geographies and definitions. Even for copper, the global 33% share in 2023 and the U.S. about 30% supply share in 2025 cannot be subtracted to attribute a three-point performance gap to the United States. A defensible international comparison needs matched source years and an equivalent treatment of direct use, new scrap and post-consumer flows.
For battery metals, the IEA separately discusses recovery relative to theoretically available feedstock. Feedstock availability is smaller and earlier in the chain than total material demand. Distinguish those metrics when using recycling reports to assess whether battery makers can displace mine supply in the short term. Track the volume entering the stream when a technology cohort retires. A rapid growth rate from a small recycling base can be economically meaningful while leaving primary supply central to the near-term balance.
AMR preserves the three global endpoints as a standalone table so readers can quote that comparison independently from U.S. trade and refinery statistics. It deliberately avoids interpolation between the endpoints and estimates no intermediate year from them.
How much mining might recycling displace by 2050?
In the IEA’s 2024 Announced Pledges Scenario, recycling could lower new mine development needs by 40% for copper and cobalt and 25% for lithium and nickel by 2050. This is a modeled comparison for future new development under the scenario, with assumptions about demand, policies, feedstock and recovery. (IEA scenario discussion, Nov 2026).

View chart data
IEA Announced Pledges Scenario, modeled reduction in new mine development needed by 2050, percent.
| Metal | Percent |
|---|---|
| Copper | 40 |
| Cobalt | 40 |
| Lithium | 25 |
| Nickel | 25 |
Values and definitions are also readable in HTML. Source precision and scope apply.
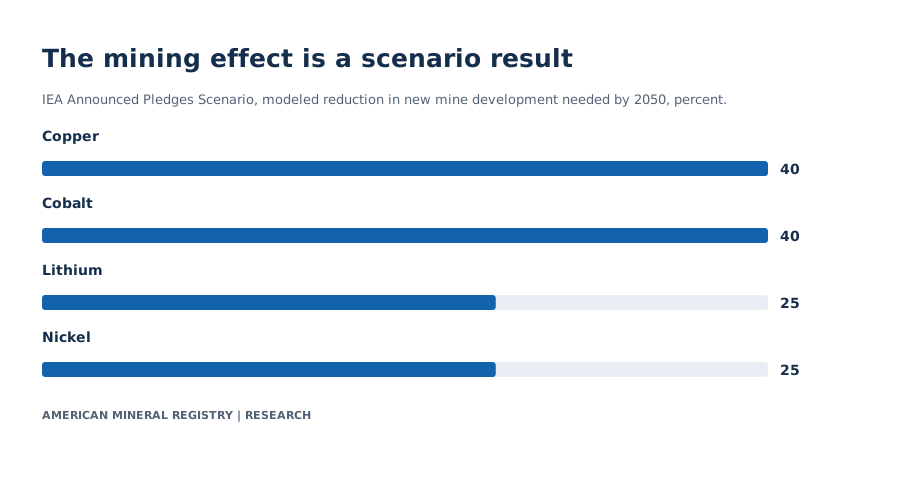
| Metal | Lower modeled new mine development needs by 2050 (%) |
|---|---|
| Copper | 40 |
| Cobalt | 40 |
| Lithium | 25 |
| Nickel | 25 |
The denominator is future modeled mining development needs. It differs from the share of total 2050 material demand met by recovered metal, and from the fraction of operating mines that might close. Even under a scenario with expanded recycling, existing mines decline and some production must be replaced. Growing demand can require more primary supply than today's production, even when the counterfactual without recycling would require still more.
Start a local feasibility assessment with the stock of metal in use, expected retirement, and actual collection by product type. Sort material into flows based on grade, processing capacity and time to arrival. Determine what saleable material substitutes for primary supply under the quality and location requirements of a buyer. Then hold end-use demand fixed across the alternatives if the purpose is to isolate recycling’s contribution. A different demand scenario may change both secondary material needs and the scale of primary development.
For a new chart or policy memo, use the separately labeled scenario table and retain “new mine development” in the description. For a report about historical national supply, use the USGS data instead. For a product or facility comparison, request direct evidence on its material inputs and yields. This separation makes each statistic actionable and keeps an economic scenario from being quoted as a measured present-day rate.
How should this research be quoted?
Use the date and denominator beside the number. Attribute original measurements to their producers and AMR’s calculations or comparisons to American Mineral Registry. The specific finding controls below preserve those qualifications and link the exact evidence. A source-derived estimate is not a transaction price, a current operational reading or a forecast guarantee.
Frequently asked questions
What percentage of U.S. copper came from recycling in 2025?
USGS says about 30% of U.S. copper supply came from recovered scrap. Copper recovered from old scrap alone divided by apparent consumption is about 7.27% from published rounded inputs. Use the numerator and denominator that match your question. (USGS Copper, Nov 2026).
How much recovered copper came from manufacturing scrap?
From the two displayed U.S. recovery estimates, new scrap yields 760 of 920 thousand metric tons, or 82.61%. The calculation describes the composition of reported scrap copper recovery, not the share of all U.S. copper use.
What percentage of U.S. aluminum was recycled?
USGS compares aluminum recovered from old scrap with apparent consumption and reports about 28% for 2025. Its separate purchased-scrap estimates divide recovery into about 56% new and 44% old scrap. (USGS Aluminum, Nov 2026).
What is the difference between recycled content and a recycling rate?
Recycled content divides recycled inputs by the mass of a product or output. A collection or recycling rate typically follows discarded or collected material through some part of a waste system. Read the producer definition before comparing rates.
What can be inferred from a lower copper recycled supply share?
It establishes a smaller fraction within the matched demand definition. To establish lower absolute recovery, check tonnage in both years. A share can decrease because demand grew more quickly.
Does a 70% domestic lead equivalence mean 70% of lead-acid batteries were recycled?
The USGS statistic divides estimated secondary lead by apparent domestic lead consumption. Its numerator and denominator are metal flows, not the number or mass of batteries discarded. (USGS Lead, Nov 2026).
Can I add the copper scrap and secondary refinery lines?
Use the explicitly defined scrap categories for the recovery question. The refinery line reflects processing, and the old-scrap definition already includes output from a range of facilities. (USGS Copper footnote 1, Nov 2026).
Can recycling eliminate new mines?
The IEA estimates reductions in new development under a specific future scenario. It also describes a continued need for investment as demand grows and existing production declines. (IEA recycling analysis, Nov 2026).
Methodology and Sources
USGS figures are extracted from each 2026 commodity PDF's page 1 U.S. salient statistics and recycling paragraph, with definitions transcribed from the page 2 footnotes. Source units are thousand metric tons unless otherwise stated; the lead export row expressly retains gross weight. Each 2025 USGS column is an estimate. Source 2024 copper old-scrap value is also marked estimated. The AMR table for old-scrap equivalence divides the old-scrap row by its own metal and year’s apparent consumption and multiplies by 100. No stock adjustment is inferred independently.
New and old scrap mix uses the sum of the two displayed channel quantities in the same metal and year. An example calculation is 760 / (760 + 160) × 100. Source percentages in prose are preserved alongside these calculations. Relative shares by year and the published supply/consumption definitions are separate files to prevent a denominator change from disappearing in a download.
The global endpoint and scenario tables come from separate sections of the IEA 2024 executive summary. The endpoint percentage point change is the published 2023 share minus the published 2015 share. The scenario describes estimates for new mine development in 2050. AMR does not rebuild the IEA model. Calculation outputs use four decimal places in the CSVs for reproduction and shorter rounded values in prose. Full descriptions and row-level source locators accompany the downloads.
Glossary
- Old scrap. Metal-bearing material from products after use.
- New scrap. Manufacturing or fabrication residues returned to a material stream.
- Apparent consumption. A source-defined domestic balance estimated from production, trade and specified adjustments.
- Secondary supply. Output provided by scrap and other secondary inputs under a stated definition.
- Direct-use scrap. Scrap entering fabrication without first appearing as newly refined metal.
- Percentage point. The arithmetic difference between two percentage shares.
Sources
- USGS 2026 Copper. Pages 1 and 2, especially recycling, salient statistics and footnotes 1, 3 and 5.
- USGS 2026 Aluminum. Pages 1 and 2, secondary supply rows and footnotes 2 to 4.
- USGS 2026 Lead. Pages 1 and 2, secondary lead and domestic apparent consumption.
- IEA Recycling of Critical Minerals. Historical recycled input estimates and a separately scoped 2050 scenario.