AMR pairs the full IEA chemistry and regional chart data with the full annual DOE workbook series. Each dataset keeps its own time window, product boundary and unit. The article shows exactly what to quote for a global price change, a chemistry or regional comparison, and a long-run real manufacturing-cost change. It also records a difference between the IEA chemistry chart arithmetic and the accompanying report’s LFP headline. Readers can reproduce the chart calculation without inferring a different population or price level.
Key Takeaways
- The IEA 2025 overall pack price index fell 8.48% from 2024 using its displayed annual values. LFP fell 16.06% and NMC fell 4.09% across the same two chart rows. (IEA chemistry chart and offered CSV, Nov 2026).
- The IEA 2025 chemistry chart gives 75 for LFP and 118.52 for NMC. That implies LFP was 36.72% lower on this chart; the accompanying report separately describes a difference of more than 40%. (IEA chemistry chart and offered CSV, Nov 2026). (IEA Global EV Outlook 2026, battery industry trends, Nov 2026).
- The 2025 IEA regional indices were 78 for China, 121 for Europe and 112 for North America, with a shared overall 2025 reference of 100. (IEA regional chart and offered CSV, Nov 2026).
- Using the 2025 regional chart, China's index was 30.36% lower than North America's and 35.54% lower than Europe's, dividing each difference by the reference region. (IEA regional chart and offered CSV, Nov 2026).
- DOE’s 2008 to 2023 manufacturing-cost series decreased 90.18% in 2023 dollars and 86.10% in current dollars, both per usable kWh. (DOE Fact of the Week 1354, Nov 2026). (DOE FOTW 1354 workbook, Nov 2026).
How much did pack prices fall from 2020 to 2025?
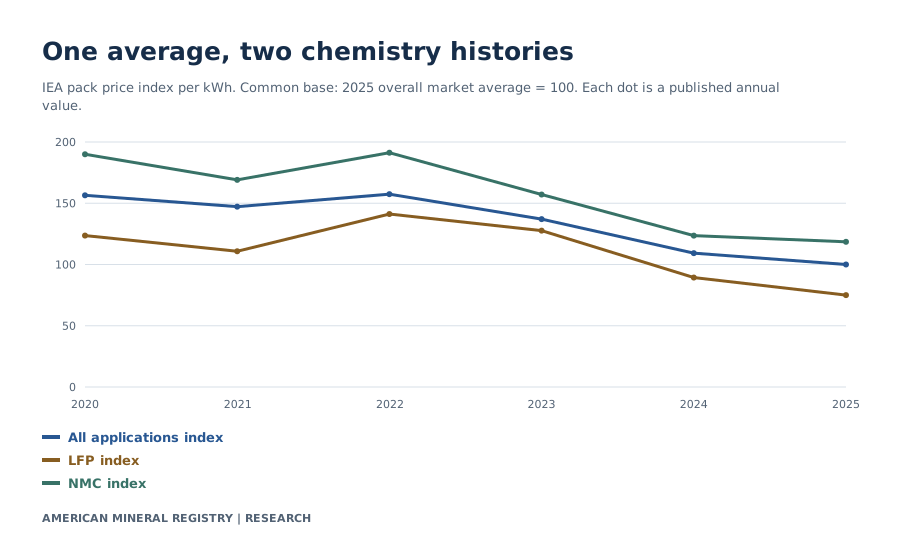
The overall IEA market index fell 36.09% from 2020 to 2025, with a temporary increase between 2021 and 2022. The series compares average pack prices per unit of capacity across EV and stationary storage applications. (IEA chemistry chart and offered CSV, Nov 2026).

View chart data
IEA pack price index per kWh. Common base: 2025 overall market average = 100. Each dot is a published annual value.
| Year | All applications index | LFP index | NMC index |
|---|---|---|---|
| 2020 | 156.48 | 123.62 | 189.99 |
| 2021 | 147.22 | 110.81 | 169.09 |
| 2022 | 157.41 | 141.19 | 191.26 |
| 2023 | 137.04 | 127.64 | 157.12 |
| 2024 | 109.26 | 89.35 | 123.57 |
| 2025 | 100 | 75 | 118.52 |
Every plotted annual value is available in the accompanying HTML table.
| Year | All applications index | LFP index | NMC index |
|---|---|---|---|
| 2020 | 156.48 | 123.62 | 189.99 |
| 2021 | 147.22 | 110.81 | 169.09 |
| 2022 | 157.41 | 141.19 | 191.26 |
| 2023 | 137.04 | 127.64 | 157.12 |
| 2024 | 109.26 | 89.35 | 123.57 |
| 2025 | 100 | 75 | 118.52 |
| Series | 2020 index | 2024 index | 2025 index | 2020 to 2025 change (%) | 2024 to 2025 change (%) |
|---|---|---|---|---|---|
| All applications | 156.48 | 109.26 | 100 | -36.0941 | -8.4752 |
| LFP | 123.62 | 89.35 | 75 | -39.3302 | -16.0604 |
| NMC | 189.99 | 123.57 | 118.52 | -37.6178 | -4.0868 |
Each chart series uses the IEA’s overall 2025 average as the common reference. An overall index of 100 identifies the reference period, not a dollar quote. If you want the dollar price, you need a primary price-level source for the corresponding product and population. An index of 156.48 relative to 100 means the 2020 overall price was 56.48% higher than the 2025 reference level. The direction matters: moving from 156.48 to 100 is a 36.09% fall, because the starting denominator is 156.48.
The annual points also matter. In the offered CSV, overall prices fell from 156.48 in 2020 to 147.22 in 2021 and rose to 157.41 in 2022 before falling to 137.04 in 2023. A headline based only on the endpoints can describe the overall direction but cannot establish a constant annual decline. From 2024 to 2025 the index moved from 109.26 to 100. The standard percentage change formula gives a decline of 8.48%, consistent with the general description of about 8% in the report.
The market mix includes different battery applications and chemistries. A market average can move because individual pack prices change, because the mix shifts to cheaper or more expensive products, or both. Pack price changes can also reflect manufacturing, material inputs and competition, as the IEA discusses. The chart rows do not isolate causal effects or provide transaction weights, so a researcher should avoid assigning a numerical portion of the headline decline to any one driver.
For a time series chart use all six points and the common-base label. For a quote about the 2025 annual change, include both endpoint index values and use the previous year's price as denominator. For a claim about price movements within a chemistry, use that chemistry's series rather than applying the overall change to each chemistry.
How much cheaper are LFP packs than NMC packs?
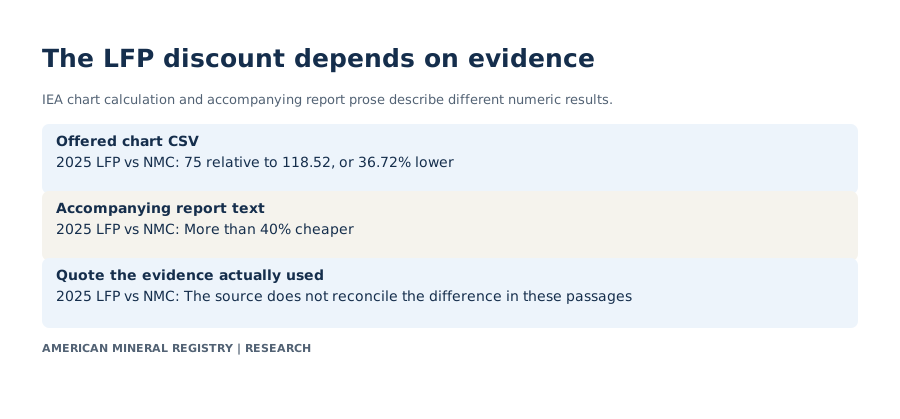
From the IEA chart’s downloadable 2025 values, 75 / 118.52 = 63.28%. On that evidence, the LFP pack price index was 36.72% lower than the NMC index. The report prose separately says LFP packs were more than 40% cheaper per kWh. The inspected chart notes and report passage do not reconcile the two figures. (IEA chemistry chart and offered CSV, Nov 2026). (IEA Global EV Outlook 2026, battery industry trends, Nov 2026).

View chart data
IEA chart calculation and accompanying report prose describe different numeric results.
| Evidence | 2025 LFP vs NMC |
|---|---|
| Offered chart CSV | 75 relative to 118.52, or 36.72% lower |
| Accompanying report text | More than 40% cheaper |
| Quote the evidence actually used | The source does not reconcile the difference in these passages |
Values and definitions are also readable in HTML. Source precision and scope apply.
IEA Global EV Outlook 2026 Original primary evidence · IEA chemistry index and offered CSV
| Evidence | 2025 LFP vs NMC difference | Basis |
|---|---|---|
| IEA downloadable chart | 36.7195% lower | AMR divides the two published series values, 75 and 118.52, on the stated common base |
| IEA accompanying report | More than 40% cheaper | Source prose; includes a discussion of different stationary storage requirements. Exact weights are not specified in the chart comparison. |
Both chart series use the same reference, so their ratio is a unitless comparison of the two chart values. To calculate the discount, divide the index difference, 43.52, by the NMC index, 118.52, instead of dividing by 100. The 43.52 is an index-point gap relative to the chart’s base. It is neither a 43.52% NMC-relative discount nor a price in dollars per kWh.
The reverse comparison uses a different denominator. Relative to LFP, 118.52 / 75 − 1 is about 58.03%. A claim about how much more expensive NMC is can show that value, provided it explicitly cites the two IEA series and the NMC-versus-LFP direction. Reporting the same 36.72% in both directions would be an arithmetic error.
The report notes that stationary storage predominantly uses LFP and can have different energy density requirements than vehicle packs. The published index chart says its average spans vehicle and storage applications. That context tells readers which comparison could reflect application mix. It does not establish the specific cause of the difference between the prose headline and the offered chart. Use the chart-derived percentage when reproducibility from public numbers is required. Use the report’s bounded wording if quoting the report statement directly. Keep the two descriptions separate in source notes.
Chemistry is a label on a pack category rather than a promise that all packs share the same volume, service life, range, warranty or operating environment. For an engineering substitution, match the amount and form of usable energy and any constraints on weight, space and power. For a procurement comparison, match quantity, delivery terms and customer requirements. An average price index cannot resolve whether a particular pack can meet those terms.
What were battery pack prices like by region?
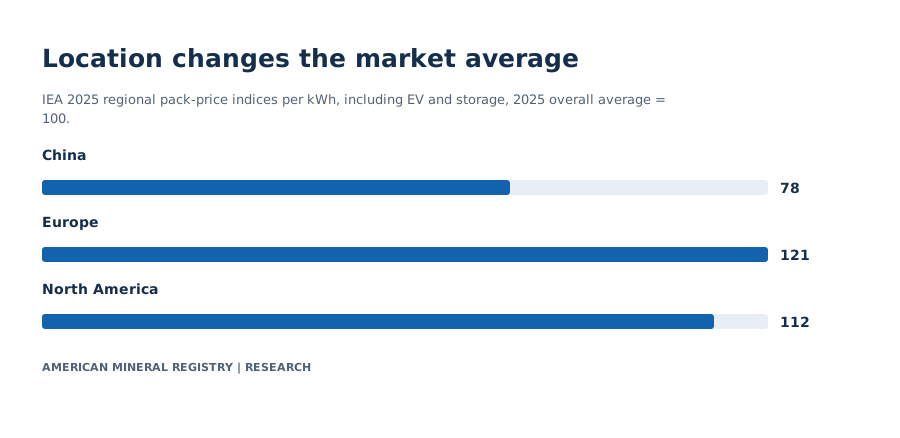
The IEA 2025 market index was 78 in China, 121 in Europe and 112 in North America. These are averages for packs priced in the named region, including locally produced batteries and imports across EV and storage applications. (IEA regional chart and offered CSV, Nov 2026). (IEA Global EV Outlook 2026, battery industry trends, Nov 2026).

View chart data
IEA 2025 regional pack-price indices per kWh, including EV and storage, 2025 overall average = 100.
| Region | Index |
|---|---|
| China | 78 |
| Europe | 121 |
| North America | 112 |
Values and definitions are also readable in HTML. Source precision and scope apply.
| Year | China index | Europe index | North America index |
|---|---|---|---|
| 2020 | 127 | 222 | 159 |
| 2021 | 124 | 197 | 172 |
| 2022 | 133 | 177 | 164 |
| 2023 | 124 | 148 | 137 |
| 2024 | 89 | 132 | 117 |
| 2025 | 78 | 121 | 112 |
Comparing regional average prices answers a market question. It does not directly report the manufacturing cost of all Chinese, European or North American factories. A pack may be manufactured in one region and priced in another. Use the pack's market, product and geography from the chart context when citing these results. North America should remain the label for the offered series. The chemistry report and some other IEA discussions use distinct regional descriptions, so the regional series should not be silently renamed the United States.
The three values share an overall 2025 reference of 100. Their simple arithmetic mean does not reproduce the overall index. The global average has its own population and composition, and national or regional means can carry different weights. The regional indices capture price differences among the published averages, whereas a calculation of each region’s global market share would require volumes.
For historical context, Europe's index fell from 222 in 2020 to 121 in 2025 while North America's fell from 159 to 112. China moved from 127 to 78. The chart offers complete annual rows, so comparisons can hold both year and definition constant. To compare how fast prices fell inside each region, divide the change by that region's own starting index. If you instead want the gap between regions, hold the year constant and use the comparison region in the denominator.
Market prices can vary with included products, customer requirements, volume, imports and competitive conditions. The chart does not track exactly the same contract over time. A purchasing budget still needs quotes and terms specific to the project, even when the source panel is useful market context.
Did the gap between regions widen?
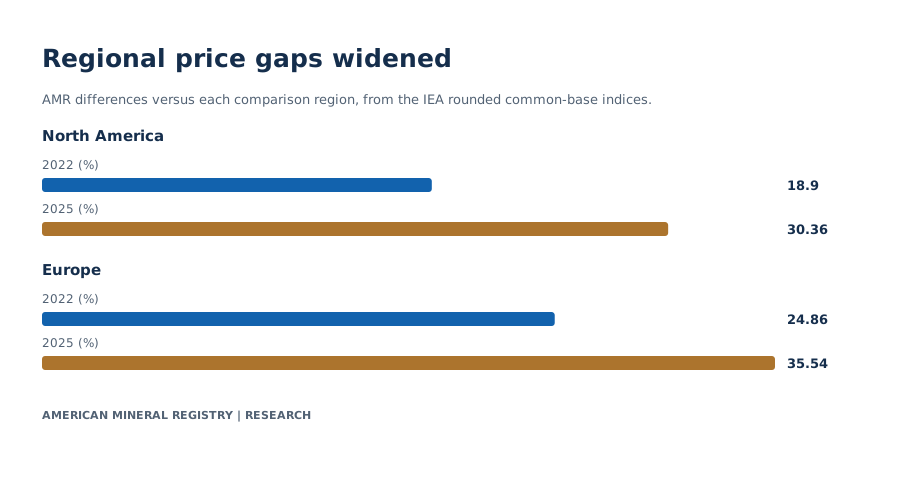
AMR’s calculation from the IEA chart puts China 18.90% below North America in 2022 and 30.36% below it in 2025. The corresponding gap versus Europe went from 24.86% to 35.54%. These are differences relative to the reference region in each year. (IEA regional chart and offered CSV, Nov 2026).

View chart data
AMR differences versus each comparison region, from the IEA rounded common-base indices.
| China relative to | 2022 (%) | 2025 (%) |
|---|---|---|
| North America | 18.9 | 30.36 |
| Europe | 24.86 | 35.54 |
Values and definitions are also readable in HTML. Source precision and scope apply.
IEA regional index with AMR calculations Original primary evidence
| Year | Lower index region | Reference region | Lower index | Reference index | AMR difference relative to reference (%) |
|---|---|---|---|---|---|
| 2022 | China | North America | 133 | 164 | 18.9024 |
| 2022 | China | Europe | 133 | 177 | 24.8588 |
| 2025 | China | North America | 78 | 112 | 30.3571 |
| 2025 | China | Europe | 78 | 121 | 35.5372 |
For a 2025 comparison with North America, subtract 78 from 112 and divide by 112. For Europe, subtract 78 from 121 and divide by 121. Multiplying by 100 produces the percentages in the table. To compare across years, subtract one gap from the other in percentage points. The displayed values imply a widening of about 11.45 percentage points versus North America and 10.68 points versus Europe, calculated before rounding the individual results.
The IEA report describes China as about 30% cheaper than North America and 35% cheaper than Europe in 2025, versus 20% and 25% in 2022. The offered CSV uses integer index values. AMR preserves the displayed numbers and reports the direct calculation rather than assuming access to the observations underlying the chart. If a writer needs a single sentence, cite the source-rounded report; if the task requires a reproducible numeric table, state that AMR uses the offered rounded indices.
These comparisons hold year and scale constant. They do not measure what a manufacturer would save by moving a plant or what a buyer would pay for a specific contract. A location decision can depend on import duties, logistics, incentives and delivery timing. A buyer may be comparing packs from different chemistries or with different performance requirements. An aggregate price spread can be useful as context while those cost items remain separate in the decision.
When reusing the graphic, carry the reference region and year in the caption. A change of 11.45 percentage points in a price-gap measure should remain distinct from an 11.45% change in the market price itself.
How much did DOE estimate EV pack manufacturing costs fell?
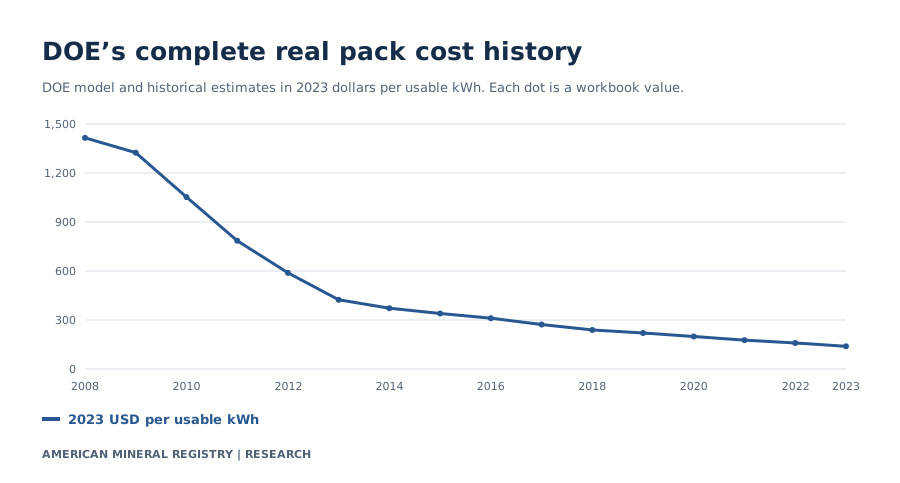
The DOE workbook shows $1,415.22 per usable kWh in 2008 and $139 in 2023, expressed in 2023 dollars. AMR calculates a 90.18% real decline from the cached worksheet values, close to the producer’s rounded 90% headline. The 2023 estimate describes production at scale of at least 100,000 units per year. (DOE Fact of the Week 1354, Nov 2026). (DOE FOTW 1354 workbook, Nov 2026).

View chart data
DOE model and historical estimates in 2023 dollars per usable kWh. Each dot is a workbook value.
| Year | 2023 USD per usable kWh |
|---|---|
| 2008 | 1415.2241259991733 |
| 2009 | 1324.4084470277853 |
| 2010 | 1052.5588908353816 |
| 2011 | 785.396127839103 |
| 2012 | 588.716635452146 |
| 2013 | 423.7839944710827 |
| 2014 | 371.97079447147877 |
| 2015 | 339.81902216549867 |
| 2016 | 311.0408863074827 |
| 2017 | 272.2329389686684 |
| 2018 | 239.04667731285863 |
| 2019 | 220.49022714026995 |
| 2020 | 198.96618768135824 |
| 2021 | 176.5443185592501 |
| 2022 | 159.29817020040664 |
| 2023 | 139 |
Every plotted annual value is available in the accompanying HTML table.
| Year | Current USD per usable kWh | 2023 USD per usable kWh |
|---|---|---|
| 2008 | 1000 | 1415.2241259991733 |
| 2009 | 932.5 | 1324.4084470277853 |
| 2010 | 753.25 | 1052.5588908353816 |
| 2011 | 579.8 | 785.396127839103 |
| 2012 | 443.6 | 588.716635452146 |
| 2013 | 324 | 423.7839944710827 |
| 2014 | 289 | 371.97079447147877 |
| 2015 | 264.3333 | 339.81902216549867 |
| 2016 | 245 | 311.0408863074827 |
| 2017 | 219 | 272.2329389686684 |
| 2018 | 197 | 239.04667731285863 |
| 2019 | 185 | 220.49022714026995 |
| 2020 | 169 | 198.96618768135824 |
| 2021 | 157 | 176.5443185592501 |
| 2022 | 153 | 159.29817020040664 |
| 2023 | 139 | 139 |
| Year | AMR real cost index (2008 = 100) |
|---|---|
| 2008 | 100.0000 |
| 2009 | 93.5829 |
| 2010 | 74.3740 |
| 2011 | 55.4962 |
| 2012 | 41.5988 |
| 2013 | 29.9447 |
| 2014 | 26.2835 |
| 2015 | 24.0117 |
| 2016 | 21.9782 |
| 2017 | 19.2360 |
| 2018 | 16.8911 |
| 2019 | 15.5799 |
| 2020 | 14.0590 |
| 2021 | 12.4747 |
| 2022 | 11.2560 |
| 2023 | 9.8218 |
| Price basis | 2008 USD/kWh usable | 2023 USD/kWh usable | AMR endpoint change (%) |
|---|---|---|---|
| 2023 constant dollars | 1415.2241259991733 | 139 | -90.1782 |
| Current dollars | 1000 | 139 | -86.1000 |
There are two dollar columns. The current-dollar historical numbers are the worksheet’s nominal estimates for each year. The 2023 constant-dollar column expresses earlier figures in a common purchasing-power unit. Dividing the 2023 value by the nominal 2008 value of $1,000 gives a drop of 86.10%. Dividing the same 2023 cost by the inflation-adjusted 2008 figure gives 90.18%. The two changes are both reproducible from the workbook, and only the latter is an inflation-adjusted comparison.
The AMR index sets the workbook's 2008 constant-dollar value to 100 and divides each later constant-dollar value by that reference. It answers how much cost remains relative to DOE’s historical starting point. In 2023 the result is about 9.82. This DOE index has a different baseline and scope from the IEA market index, even though both use 100 as a reference. They cannot be joined to establish one continuous 2008 to 2025 market series.
The workbook combines source vintages. DOE lists one source family for 2008 to 2015, separate review data for 2016 and 2017, and its estimates using Argonne's BatPaC tool for 2018 to 2023. The AMR table quotes DOE's published series; it does not independently reproduce any original manufacturing model. Decimal values come from the worksheet cells and carry their original modeling and reporting limits.
“Usable kWh” matters because the total stored energy rated for a pack and the energy available for operation can differ. Holding total cost fixed, dividing by a smaller usable capacity makes the cost per usable kWh larger. When comparing with a pack or cell quote, first establish what the quote's capacity includes and whether the supplier uses the same basis.
Which battery cost statistic should you cite?
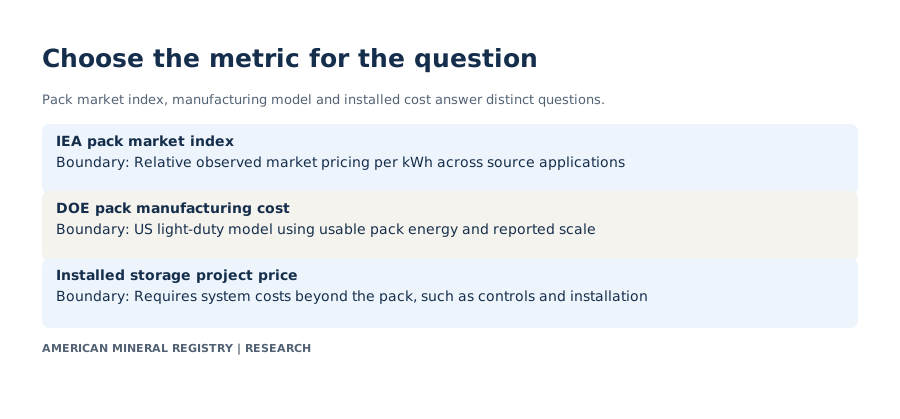
Use a market pack index for changes in the IEA’s observed price series, a manufacturing model for DOE’s long-run cost estimate, and a separately sourced system estimate for an installed project. Attach the unit, year, product boundary and population to the sentence. (IEA chemistry chart and offered CSV, Nov 2026). (IEA regional chart and offered CSV, Nov 2026). (DOE Fact of the Week 1354, Nov 2026).

View chart data
Pack market index, manufacturing model and installed cost answer distinct questions.
| Metric | Boundary |
|---|---|
| IEA pack market index | Relative observed market pricing per kWh across source applications |
| DOE pack manufacturing cost | US light-duty model using usable pack energy and reported scale |
| Installed storage project price | Requires system costs beyond the pack, such as controls and installation |
Values and definitions are also readable in HTML. Source precision and scope apply.
DOE Fact of the Week 1354 Original primary evidence · IEA pack price index
For EV battery chemistry, decide whether the question is the average pack price in the source data or comparable performance at a fixed physical size. A common unit of price per kWh does not hold weight, volume, usable capacity, degradation or power constant. A cost per vehicle, cost per pack and cost per usable kWh can all move differently as pack size and mix change.
For stationary storage, distinguish the pack from the installed project. An installed system can include enclosures, thermal management, conversion equipment, controls and integration. Its cost may also depend on how power capacity and energy capacity are specified. An index of battery pack prices can help explain direction but cannot settle an all-in installed cost per unit of energy for a project. LFP and NMC comparisons must also adopt the application boundary of the chosen source.
For comparisons over time, decide first whether you want current dollars, inflation-adjusted dollars or an index. The DOE workbook supports nominal and real estimates within one history. The IEA series here supports comparisons along one stated price index. Converting a price index to money without the base price or chaining it to a manufacturing estimate would create a new unsupported measure.
For material exposure, ask a different question. The AMR battery minerals comparison uses a defined electric vehicle model and separate chemistry deployment context. Its material values describe which substances appear in that model. A change in pack price can reflect material costs, cell design, pack design, factory utilization, trade and competition. Translating a mineral mass into a quoted pack price requires validated cost inputs and a compatible production model.
A citation should travel with the statistic. Link to the precise finding, use its source boundary, and include the original authority alongside AMR's arithmetic. If a percentage depends on a rounded series, describe the result as approximate. When two public statements differ, preserve both and explain which input underlies the figure you quote.
How should this research be quoted?
Use the date and denominator beside the number. Attribute original measurements to their producers and AMR’s calculations or comparisons to American Mineral Registry. The specific finding controls below preserve those qualifications and link the exact evidence. A source-derived estimate is not a transaction price, a current operational reading or a forecast guarantee.
Frequently asked questions
Did EV batteries cost $100 per kWh in 2025?
The 100 value in the displayed IEA series is the 2025 overall price index base. This page uses that index for relative comparisons. Dollar price claims require an explicit primary price-level series and product boundary. (IEA chemistry chart and offered CSV, Nov 2026).
How much did the 2025 average fall from the previous year?
The IEA chart's overall index declined from 109.26 to 100. That is 8.48% by AMR calculation. The report describes a decrease of about 8%. (IEA chemistry chart and offered CSV, Nov 2026). (IEA Global EV Outlook 2026, battery industry trends, Nov 2026).
Why do 36.72% and more than 40% both appear?
The 36.72% comes from the 75 and 118.52 numbers offered in the IEA chart’s CSV. The separate report prose says more than 40%. These published passages do not identify a complete reconciliation. (IEA chemistry chart and offered CSV, Nov 2026). (IEA Global EV Outlook 2026, battery industry trends, Nov 2026).
Why is the index change different from the points between values?
A change from 109.26 to 100 is a decrease of 9.26 index points and about 8.48% relative to the starting value. The first subtracts values; the second divides the difference by the chosen baseline.
Can I compare 2025 regional prices in the IEA chart?
Yes, for the source-defined regional average prices. All regions share the same 2025 overall index base, and the IEA says the regional market averages include local production and imports. (IEA regional chart and offered CSV, Nov 2026).
Is DOE's $139 a retail replacement-pack price?
DOE publishes it as an estimated 2023 light-duty EV pack cost per usable kWh under production at scale. A retail replacement price has its own product, distribution and installation terms. (DOE Fact of the Week 1354, Nov 2026).
Where can I get the annual raw values?
Download the IEA chemistry and regional CSV tables, the historical DOE table or the complete bundle below. Original evidence is linked alongside each table, including the (DOE FOTW 1354 workbook, Nov 2026).
Why can prices rise after long-run costs fell?
A market observation reflects its time window and mix. Demand, materials and competition can change. The IEA series includes a rebound between 2021 and 2022 before later declines. DOE's annual comparison is an estimate under different conditions.
Methodology and Sources
AMR extracted the two public IEA chart downloads as offered by the chart interface. The source headers identify CC BY 4.0 and the overall 2025 base of 100. The charts and notes identify IEA analysis based on Bloomberg New Energy Finance data. The chemistry table uses six annual rows and the three columns Average, LFP, and NMC. The regional table uses six annual rows and the three original geographic columns. The figure titles may say per watt-hour while the notes refer to per kWh. Relative index values are unchanged by a constant unit conversion. The source links point back to the respective dataset and notes.
AMR uses (end / start − 1) × 100 for a change and (1 − lower / reference) × 100 for a relative discount. The IEA report prose is kept apart from values calculated from the chart's displayed indices. AMR does not infer nominal or real dollar price levels from a normalized index. The regional analysis uses the original regional names.
The DOE data come from cells A6:C21 of the FOTW #1354 worksheet in the original XLSX file. Written worksheet values are retained in the CSV, including extra digits in the adjusted series and the source’s 2015 current-dollar cell. AMR’s real index divides each constant-dollar value by the 2008 constant-dollar reference and multiplies by 100. Source values and calculated tables are labeled separately. AMR does not reproduce the inflation adjustment or source cost models. Reproduction uses the downloaded CSVs and standard Python libraries.
Glossary
- Pack. An assembly of cells and pack-level components.
- Usable kWh. The energy capacity available in the stated operating boundary.
- Common-base index. A relative price scale with the same reference for the displayed series.
- Current dollars. Money at the prices of the named year.
- Constant dollars. Amounts restated on a named year's purchasing-power basis.
- LFP. Lithium iron phosphate.
- NMC. Lithium nickel manganese cobalt oxide.
Sources
- IEA chemistry price index. Offered chart CSV and notes, updated April 14, 2026.
- IEA regional price index. Offered chart CSV and regional population notes.
- Global EV Outlook 2026. Battery industry trends, prose price comparisons and coverage.
- U.S. Department of Energy, FOTW #1354. August 2024 description of estimated 2008 to 2023 pack costs and production context.
- DOE cost workbook. FOTW #1354, A6:C21 and worksheet notes.