Key takeaways
- In FY 2025, BLM reported a mean of 283 calendar days to process an application for a federal or Indian oil and gas drilling permit. The mean was 183 days before the application was complete and 100 days from completeness to the decision. BLM Table 12 reports fiscal year averages for federal and Indian permits combined.
- From FY 2024 to FY 2025, the BLM mean total fell 22 days. The phase after completeness fell 49 days, and the phase before completeness rose 27 days. AMR subtracts the FY 2024 means from the FY 2025 means for each phase and the total.
- The FY 2025 mean of 183 days before an application was complete was the highest in BLM’s 12-year series. The next highest was 162 days in FY 2022. The comparison uses the operator column in BLM Table 12.
- The highest mean total was 321 calendar days in FY 2023 and the lowest was 121 in FY 2018, a spread of 200 days. AMR compares the published annual total means from FY 2014 to FY 2025.
- The two phases of BLM drilling permit processing moved in opposite directions in six of 11 annual comparisons from FY 2014 to FY 2025. AMR compares the direction of change in the means before and after completeness for each adjacent fiscal year in BLM Table 12.
- In FY 2025, BLM received 3,927 federal and Indian drilling permit applications and processed 6,709. The agency reported 2,984 pending at fiscal year end. BLM Table 16 reports received and processed flows and a September 30 inventory. Applications can cross fiscal years.

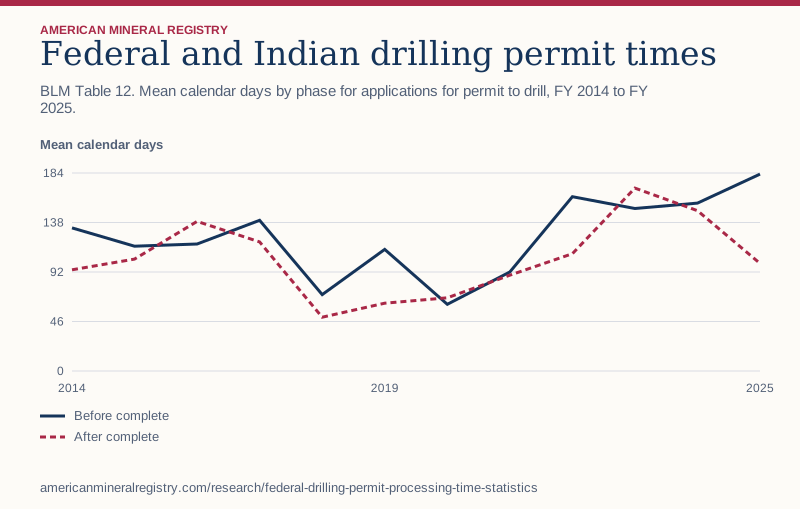
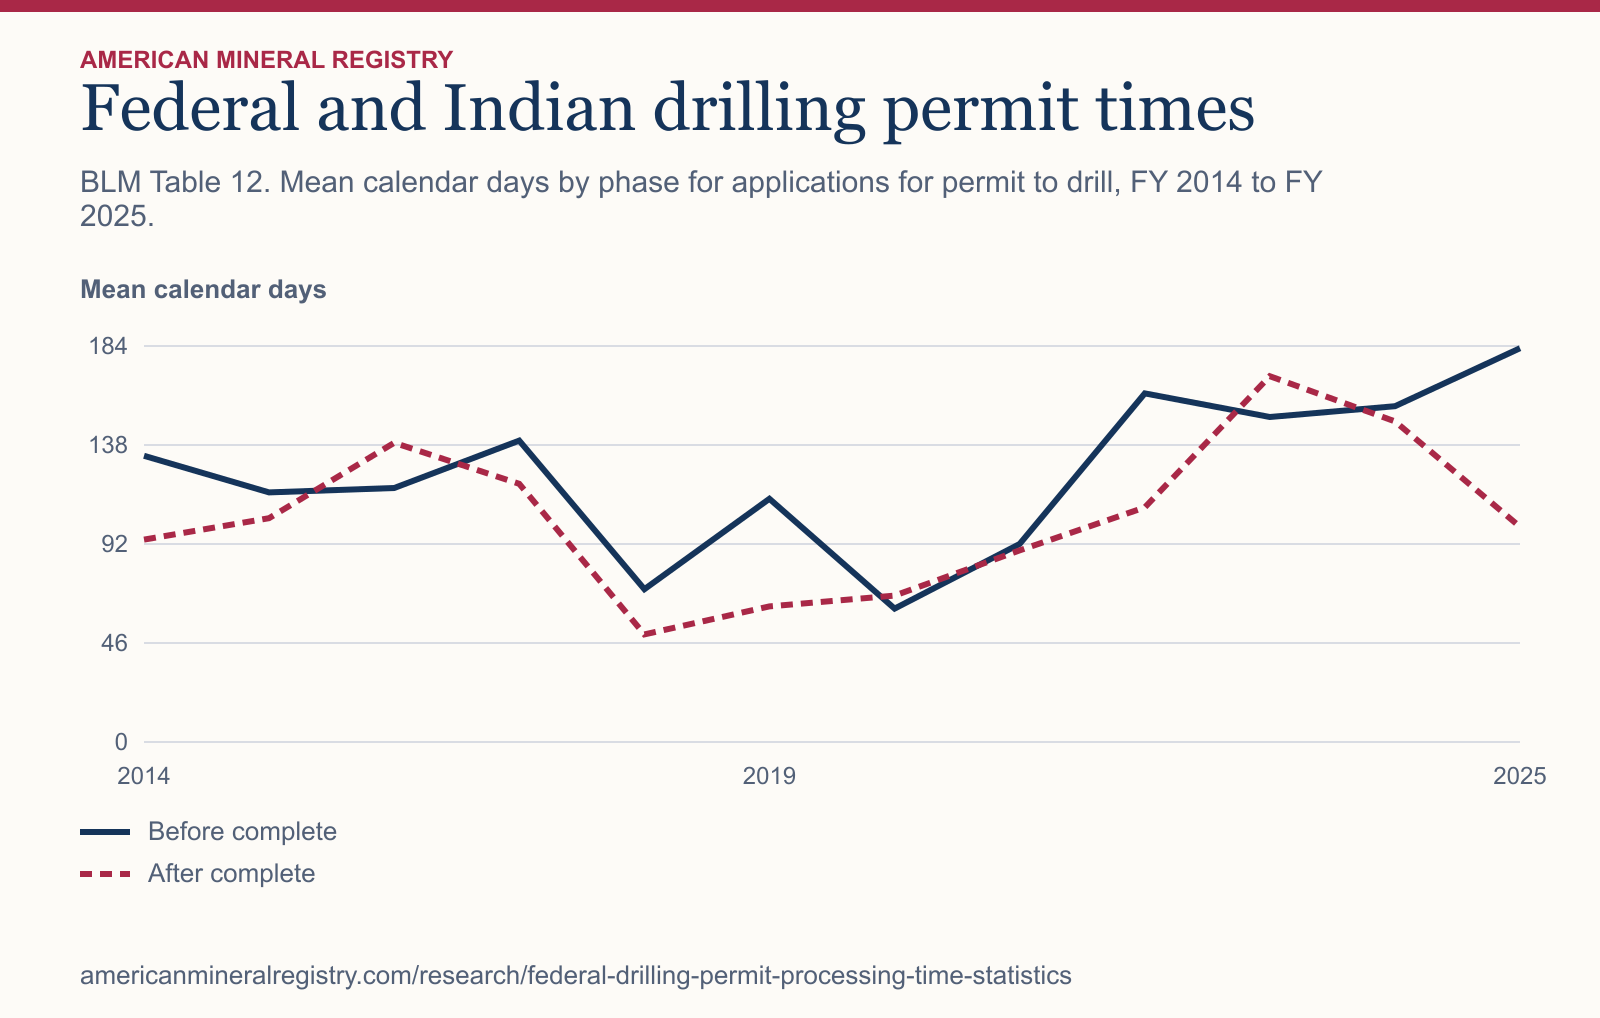
Figure 1 in text
BLM Table 12. Mean calendar days by phase for applications for permit to drill, FY 2014 to FY 2025. Mean calendar days.
| Fiscal year | Before complete | After complete |
|---|---|---|
| 2014 | 133.00 | 94.00 |
| 2015 | 116.00 | 104.00 |
| 2016 | 118.00 | 139.00 |
| 2017 | 140.00 | 120.00 |
| 2018 | 71.00 | 50.00 |
| 2019 | 113.00 | 63.00 |
| 2020 | 62.00 | 68.00 |
| 2021 | 92.00 | 89.00 |
| 2022 | 162.00 | 109.00 |
| 2023 | 151.00 | 170.00 |
| 2024 | 156.00 | 149.00 |
| 2025 | 183.00 | 100.00 |
Chart wording and scale
Federal and Indian drilling permit times BLM Table 12. Mean calendar days by phase for applications for permit to drill, FY 2014 to FY 2025.
Mean calendar days 0 46 92 138 184 2014 2019 2025 Before complete After complete
Source and data: Download chart source data
Permanent link to this figure’s text and data · Sources and context
Which drilling permit processing time should you use?
Use the total mean when comparing the reported span from submission to a decision. Use the post-completeness mean when the starting point is a complete application. A headline that says a permit took 100 days in FY 2025 implicitly chooses the second clock. A headline describing the reported end-to-end time for the same fiscal year needs 283 days and the combined federal and Indian scope.
The agency labels the earlier phase time with the operator and the later phase time with BLM. For interpretation, the useful boundary is whether the application was complete. Administrative attribution puts elapsed days on one side of that boundary. The timing table does not allocate each day to a specific cause, employee, review activity or outside party.
| Question | Use this measure | FY 2025 |
|---|---|---|
| What was the full reported processing span? | Mean total calendar days | 283 |
| How long after the application was complete? | Mean calendar days in the BLM phase | 100 |
| How much elapsed before completeness? | Mean calendar days in the operator phase | 183 |
What does the complete 12-year permit timing series show?
The total exceeded 250 calendar days in six of the 12 fiscal years. All four fiscal years from 2022 through 2025 were above that threshold. Across the whole series, FY 2023, FY 2024 and FY 2025 had the three highest totals in that order. FY 2025 still led the before-completeness measure despite the decline in its total.
Individual components matter because the shorter phase can change. The BLM phase accounted for 68 of 130 days in FY 2020, a little over half of the two reported means. It accounted for 100 of 283 days in FY 2025, just over one third. Those shares are ratios of annual mean days. They say nothing about the percentage of applications that spent more time in one phase.
| Fiscal year | Before complete, days | After complete, days | Total, days | Before complete share |
|---|---|---|---|---|
| 2014 | 133 | 94 | 227 | 58.6% |
| 2015 | 116 | 104 | 220 | 52.7% |
| 2016 | 118 | 139 | 257 | 45.9% |
| 2017 | 140 | 120 | 260 | 53.8% |
| 2018 | 71 | 50 | 121 | 58.7% |
| 2019 | 113 | 63 | 176 | 64.2% |
| 2020 | 62 | 68 | 130 | 47.7% |
| 2021 | 92 | 89 | 181 | 50.8% |
| 2022 | 162 | 109 | 271 | 59.8% |
| 2023 | 151 | 170 | 321 | 47.0% |
| 2024 | 156 | 149 | 305 | 51.1% |
| 2025 | 183 | 100 | 283 | 64.7% |
How can permit processing get shorter while one phase gets longer?
The FY 2024 to FY 2025 comparison is the cleanest example. Before completeness, the mean rose from 156 to 183 days. After completeness, it fell from 149 to 100 days. The 49-day fall more than offset the 27-day rise, yielding a net decline of 22 days. The earlier phase therefore took a larger share of a smaller total, rising from 51.1% to 64.7%.
Looking a year further back avoids mistaking the drop for a return to the earlier distribution. Between FY 2023 and FY 2025, the mean post-completeness phase fell by 70 days, and the earlier phase lengthened by 32. The total fell by 38. A reader who tracks only the total would see part of the shift and miss the direction of the earlier phase entirely.
| Comparison | Before complete change | After complete change | Total change |
|---|---|---|---|
| FY 2023 to FY 2024 | +5 days | −21 days | −16 days |
| FY 2024 to FY 2025 | +27 days | −49 days | −22 days |
| FY 2023 to FY 2025 | +32 days | −70 days | −38 days |
Does the conclusion depend on picking a single year?
AMR compared two equal six-year windows and used the median of the six annual means in each. The annual total mean had a median of 223.5 days in FY 2014 to FY 2019 and 277.0 days in FY 2020 to FY 2025. The difference is 53.5 days. The component medians rose as well, with the larger increase in the phase before completeness.
These are medians across fiscal years. Each fiscal year gets equal weight. A median across applications would require individual elapsed times, and a weighted average across the period would require the count behind each published mean. A report making a comparison across years can use these year medians if it identifies the unit of observation.
| Median of annual means | FY 2014 to FY 2019 | FY 2020 to FY 2025 |
|---|---|---|
| Before complete | 117.0 days | 153.5 days |
| After complete | 99.0 days | 104.5 days |
| Total | 223.5 days | 277.0 days |
Where does the application clock sit in the development process?
An application for permit to drill, or APD, concerns a proposed operation. BLM’s process materials distinguish the application materials and the agency’s evaluation of the proposed drilling. For a parcel-level question, first establish which proposal, operator and field office you are asking about. Then identify the application milestones that the relevant record actually shows. A lease date, a submission date and a decision date describe different events.
For a practical inquiry, ask for the dates of submission and completeness if the question is how long the application itself has been in the process. For an approved proposal, the date of the decision closes that comparison. A later start of drilling is a separate event. The national time series cannot tell a mineral owner whether an operator will drill, when it might begin, or when any production might result.
Can the national average tell you how many permits are waiting?
A queue is a count of unresolved applications at a point in time. Throughput is a count of decisions during a period. A processing mean is elapsed time among the records covered by the source. These three quantities can move independently. A queue can grow while the published average falls if, for example, incoming volume increases and many new records remain pending at the end of the period.
For a comparison of workload, pair the timing series with a BLM inventory or decision count only after checking geography, the application population and how the source handles pending records. To compare an office with the national figure, use the same milestones and time units. For a published article, put the fiscal year and “federal and Indian combined” in the same sentence as the number.
Why do published estimates of the review time differ?
GAO reported a decline from 196 to 94 days for applications received over its May 2016 to June 2019 study period. BLM Table 12 reports 257 days for FY 2016 and 176 for FY 2019 on its annual total line. Each figure belongs to its source’s date range and measurement design. Subtracting 94 from 176 would mix different measures. Start a trend comparison with one publication’s consistent series and use the other study to understand its workflow or data quality findings.
When a source says an agency has sped up its review, check whether the measure starts at submission or completeness and whether it groups applications by receipt or decision. Those choices determine which elapsed time and which applications enter a result.
How often did the two phases move in opposite directions?
They moved in opposite directions six times across 11 adjacent-year comparisons. FY 2017 is an instructive case. The total went up just three days, from 257 to 260. The time after completeness declined by 19 days while the time before completeness increased by 22. A single series of the total can make a year look steady even when both parts changed.
FY 2018 shows the other pattern. The total fell by 139 days, the largest decline in the window, as both phases contracted by nearly equal amounts. FY 2022 had the largest increase, 90 days, with 70 before and 20 after completeness. For an assessment of administrative review use the post-completeness series. For a planning comparison of full elapsed time, keep the earlier clock visible.
| FY ending in | After complete, change in days | Before complete, change in days | Total, change in days |
|---|---|---|---|
| 2015 | +10 | -17 | -7 |
| 2016 | +35 | +2 | +37 |
| 2017 | -19 | +22 | +3 |
| 2018 | -70 | -69 | -139 |
| 2019 | +13 | +42 | +55 |
| 2020 | +5 | -51 | -46 |
| 2021 | +21 | +30 | +51 |
| 2022 | +20 | +70 | +90 |
| 2023 | +61 | -11 | +50 |
| 2024 | -21 | +5 | -16 |
| 2025 | -49 | +27 | -22 |
What did BLM process and how many applications were pending?
The FY 2025 status workbook provides a complementary answer. Its national summary records 6,106 approvals and 603 applications processed to other dispositions, for 6,709 processed in total. It separately records 3,927 received during the year and 2,984 pending at the end. Its federal and Indian rows sum to that published total across all seven measures. Use the combined row when comparing the agency’s annual workload with the combined timing scope.
The count processed can exceed the count received in the same year because applications can carry over from an earlier year. Dividing 6,106 approvals by 3,927 receipts would give a quotient greater than 100%, which is a clue that the numerator and denominator are different flows. Dividing 6,106 approvals by 6,709 processed gives 91.0% of dispositions in that status report. A cohort approval probability would require following applications received in a defined period and counting their outcomes.
The workbook also lets readers separate federal from Indian counts. Of the applications processed, 90.8% of the federal group and 94.1% of the Indian group were approved. Those percentages describe the two groups of reported dispositions. They cannot explain why outcomes differ or allocate the 283-day timing mean between the groups. The mean comes from Table 12, where those groups are combined.
| BLM Table 16 scope | Received | Approved | Other dispositions | Processed | Pending Sep 30 |
|---|---|---|---|---|---|
| Federal | 3,629 | 5,740 | 580 | 6,320 | 2,807 |
| Indian | 298 | 366 | 23 | 389 | 177 |
| Combined | 3,927 | 6,106 | 603 | 6,709 | 2,984 |
How should you compare permit approvals with drilling starts and completions?
The same workbook reports 2,575 wells spudded and 1,230 wells completed in FY 2025 across federal and Indian interests. In BLM’s terminology, spudding is the start of drilling. A completed well count in this workbook follows its reporting criteria for a submitted completion report and a production or injection well. An approved permit records a decision about an application. Each count describes a different milestone.
A well spudded in FY 2025 can be associated with a permit approved earlier. A well started in the year may be completed later, and the completion report may be filed on a different date again. To measure conversion from approval to spud, start with permit identifiers from an approval cohort and match them to the same wells over an explicit follow-up period. When comparing unlinked national totals, call each count by its milestone rather than treating the quotients as conversion rates.
| Table 16 scope | Approvals | Wells spudded | Wells completed |
|---|---|---|---|
| Federal | 5,740 | 2,358 | 1,074 |
| Indian | 366 | 217 | 156 |
| Combined | 6,106 | 2,575 | 1,230 |
What should a landowner or reporter check for a specific application?
Start with the well or application identifier if you have it. Confirm the operator name and the BLM field office associated with the proposal. A Table 16 office entry is an aggregate workload statistic, and BLM distinguishes its administrative office boundaries from the geographic-state groupings used for separate permit totals. That matters when the project crosses a state boundary or an office handles work on both sides of it.
Next, record the submission date and the completeness date as separate fields. If completeness has not been recorded, describe the period since submission as time to date. If you have the agency’s final decision date, report the duration measured between the two milestones you actually know. A published benchmark is meaningful alongside that case only when the comparison has the same start event, end event and time unit.
For a longer-term update, copy the agency’s scope notes and first reconcile the new workbook with its predecessor. Keep the previous edition on record so a corrected historic observation can be separated from movement in the latest fiscal year. That makes it possible to cite a fixed result today and reproduce it after a release has been revised.
How does this analysis compare with published sources?
This study draws on BLM Table 12, U.S. Government Accountability Office, BLM permit application guidance, BLM Table 16. The comparison below shows which questions each source answers and which calculations AMR adds.
| Publication | What it covers | Where the scope differs | How AMR uses it |
|---|---|---|---|
| BLM Table 12 | Twelve fiscal years of mean federal and Indian processing days by phase. | Readers need separate before-completeness and after-completeness change calculations. | Reconcile the phases and show how they contribute to the total. |
| U.S. Government Accountability Office | Historical review of application workflow, prioritization and tracking quality for records in its audit period. | Audit period and receipt cohorts differ from the latest fiscal-year series. | Use it for workflow context. Keep BLM Table 12 as the source of the 12-year figures. |
| BLM permit application guidance | Application materials and the agency’s permit review process. | Process guidance answers how a proposal is handled. Timing evidence uses different records. | Separate elapsed time from application requirements and permit status. |
| BLM Table 16 | Federal and Indian annual receipts, dispositions and drilling activity, plus year-end pending applications. | Counts describe workloads and inventories. They do not report the durations in Table 12. | Reconcile federal and Indian counts to the published combined total and explain how applications cross reporting years. |
How can you reproduce and cite the permit timing numbers?
Start with the FY 2025 Table 12 PDF. Read the BLM, operator and total columns against the labels above the table. The FY 2024 edition prints the component columns in the opposite order, so match by heading when comparing vintages. AMR independently transcribed both editions and reconciled all 11 shared rows. Each row in the CSV satisfies the published phase sum.
For a phase share, divide the earlier-phase mean by the total mean for the same year and multiply by 100. For a year-over-year change, subtract the prior year within the same column. If you need a typical case, an upper percentile or a projection for an application now underway, seek case-level or office-level evidence with the relevant milestone dates. Use the linked primary publication for the reported means and cite AMR for the phase shares, the window comparison and the change decomposition.
Sources and data
- BLM FY 2025 Table 12, all 12 timing rows and definitions
- BLM FY 2024 Table 12, 11 overlap rows
- BLM FY 2025 Table 16, national and office workload
- BLM oil and gas statistics inventory
- BLM drilling application process
- GAO audit of BLM review and data tracking, GAO-20-329
Download the data (CSV) · Read the data dictionary. The AMR analysis and figures are licensed CC BY 4.0. Refer to the original issuers for their materials.