Key takeaways
- In FY 2025, 200,194.017 of the 702,193.137 federal onshore oil and gas acres BLM offered at auction received bids, or 28.5%. By parcel count, 252 of 359 offered parcels received bids, or 70.2%. AMR divides acreage with bids by acreage offered and parcel count with bids by parcels offered.
- One Alaska sale accounted for 400,221 acres offered and received no bids in FY 2025. Across the other 19 sales, 66.3% of offered acreage received bids. The alternate denominator removes this sale’s acreage and retains all other sales.
- FY 2024 had the highest acreage bid rate in the study at 74.2%. FY 2025 had the largest acreage with bids at 200,194.017 acres. A rate measures the share of the offering. The acreage level measures the amount receiving bids.
- Five of the 44 sale rows in BLM Table 15 across FY 2023 to FY 2025 recorded no parcels receiving bids. AMR counts sale rows with zero parcels receiving bids. The annual counts were one, one and three.
- BLM reported $214,949,539 in total receipts from FY 2025 auctions, equivalent to $1,073.71 per acre that received bids. BLM receipts include bonus bids, first-year rentals and fees. AMR divides receipts by 200,194.017 acres.
- The equally weighted mean FY 2025 auction acreage bid rate was 73.8%, while 28.5% of all offered acres received bids. AMR averages 20 sale-level acreage ratios for the first number and divides the summed acres receiving bids by summed acres offered for the second.
- In FY 2025, 81.3% of offered federal onshore acreage that received no bids came from three sale rows where no acreage received a bid. AMR divides 408,345.120 acres from the three zero-bid sale rows by 501,999.120 acres without bids across all 20 sale rows.

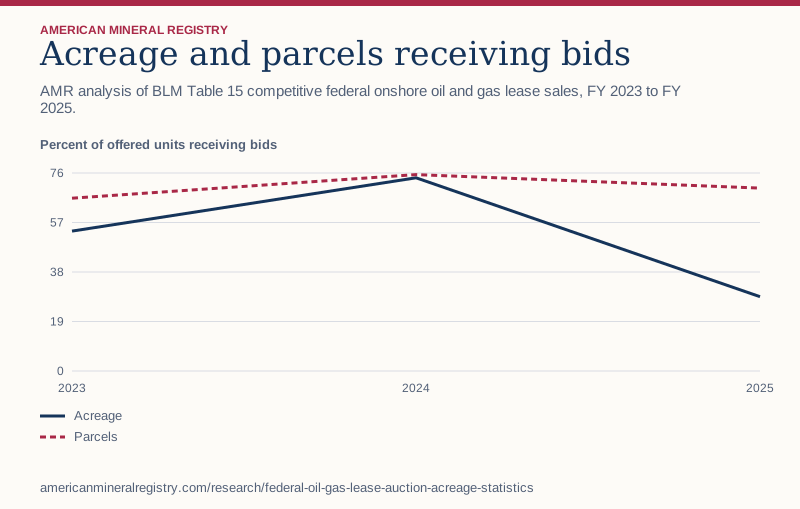
Figure 1 in text
AMR analysis of BLM Table 15 competitive federal onshore oil and gas lease sales, FY 2023 to FY 2025. Percent of offered units receiving bids.
| Fiscal year | Acreage | Parcels |
|---|---|---|
| 2023 | 53.70 | 66.33 |
| 2024 | 74.17 | 75.37 |
| 2025 | 28.51 | 70.19 |
Chart wording and scale
Acreage and parcels receiving bids AMR analysis of BLM Table 15 competitive federal onshore oil and gas lease sales, FY 2023 to FY 2025.
Percent of offered units receiving bids 0 19 38 57 76 2023 2024 2025 Acreage Parcels
Source and data: Download chart source data
Permanent link to this figure’s text and data · Sources and context
Which measure answers whether federal auction acreage received bids?
Use the acreage bid rate when the question is how much of the land offered attracted a bid. Use the parcel bid rate when the question is how many individual auction units found a bidder. A parcel counts once whatever its size. A thousand-acre parcel contributes ten times as much acreage as a hundred-acre parcel. The two rates can tell very different stories about the same set of sales.
For a fiscal-year rate, sum the relevant numerator and denominator across all sales first. A simple average of individual sale rates gives the smallest sale the same weight as the largest. That can answer a question about an equally weighted group of sales. It is a different calculation from the share of all offered acres that received bids.
| Question | Numerator | Denominator | FY 2025 result |
|---|---|---|---|
| How much offered land drew bids? | Acres receiving bids | Acres offered | 28.5% |
| How many auction units drew bids? | Parcels receiving bids | Parcels offered | 70.2% |
| How many sales received no bids? | Sale rows with zero parcels receiving bids | All sale rows | 3 of 20 |
What did the three fiscal years show?
FY 2024 had the highest acreage bid rate of the three years and the fewest acres receiving bids. FY 2025 had the lowest acreage bid rate and the most acres receiving bids. Those observations can coexist because FY 2025 had by far the largest offering. Keep the numerator with the rate when reporting that bidding rose or fell so the reader can distinguish a change in acreage from a change in the share.
The parcel bid rates stayed closer together, spanning 66.3% to 75.4%. The acreage rates spanned 28.5% to 74.2%. The difference in those ranges is a reason to check the composition of the offering before interpreting the change as a change in bidder behavior.
| FY | Sales | Parcels offered | Parcels with bids | Parcel rate | Acres offered | Acres with bids | Acreage rate |
|---|---|---|---|---|---|---|---|
| 2023 | 8 | 297 | 197 | 66.3% | 249,757.390 | 134,117.990 | 53.7% |
| 2024 | 16 | 203 | 153 | 75.4% | 93,384.669 | 69,263.937 | 74.2% |
| 2025 | 20 | 359 | 252 | 70.2% | 702,193.137 | 200,194.017 | 28.5% |
How much did one large Alaska offering change the FY 2025 rate?
One Alaska sale listed 12 parcels covering 400,221 acres. It recorded zero parcels and zero acres receiving bids. That sale represented 57.0% of the year’s offered acres and 3.3% of its offered parcels. Removing that row for a sensitivity calculation reduces the acreage denominator to 301,972.137 acres. The 200,194.017-acre numerator stays the same.
The acreage bid rate is 28.5% across all 20 sales and 66.3% across the other 19. The corresponding parcel bid rates are 70.2% and 72.6%. The published national result includes Alaska. The second result describes a defined subset and shows how much the large offering affected the two national measures.
| FY 2025 population | Offered acres | Acres with bids | Acreage rate | Parcel rate |
|---|---|---|---|---|
| All 20 sales | 702,193.137 | 200,194.017 | 28.5% | 70.2% |
| 19 sales excluding one Alaska sale | 301,972.137 | 200,194.017 | 66.3% | 72.6% |
What does auction receipts per acre measure?
BLM’s total receipts column includes bonus bids, first-year rentals and fees. Dividing it by acres receiving bids produces a receipts-per-acre measure for the set of sales in the numerator. For bonus dollars per acre, start with bid-only results for the same auctions. The numerator and denominator must cover the same winning acreage.
The FY 2024 total was smaller than FY 2025, but its receipts per acre with bids were higher. That quotient describes the combined receipts and acreage across the offering. It cannot reveal a typical winning bid or the expected value of a parcel. For a parcel comparison, use the sale-level or parcel-level terms, acres and bid amounts that apply to each observation.
| FY | BLM total receipts | Acres with bids | Total receipts per acre with bids |
|---|---|---|---|
| 2023 | $124,644,758 | 134,117.990 | $929.37 |
| 2024 | $170,747,847 | 69,263.937 | $2,465.18 |
| 2025 | $214,949,539 | 200,194.017 | $1,073.71 |
What counts as a sale with zero bids?
The download preserves rows that report parcels offered and zero parcels receiving bids. Five such sale rows appear. Omitting them would mechanically increase an acreage or parcel bid rate, since they contribute to offered acreage and parcels while adding zero to the corresponding numerator. Keep them for a national measure of all offerings in the source.
Use a separate count when writing about how often whole sales drew no bids. Five sale rows in 44 answer that question for this period. To ask how many parcels went without bids, subtract parcels receiving bids from parcels offered. To ask how much acreage went without bids, use the acreage columns. For FY 2025 those calculations yield 107 parcels and 501,999.120 acres, respectively.
How does acreage with bids relate to leases issued and production?
A sale record establishes which offered acreage received bids in that sale. Issuance is a separate administrative event. Acreage in effect is an inventory of leases in force, and producing acreage describes another subset of lease inventory. Use the series that matches the question, including its date and geography. A reader following a specific parcel needs the applicable sale and lease records to see where it sits in that sequence.
The percentage of acreage receiving bids also cannot distinguish a parcel that drew one bidder from a parcel that drew multiple bidders. If the question concerns bidder competition, the useful evidence is bidder or bid counts at the parcel level. For an article comparing fiscal and calendar periods, retain the source’s reporting dates and the receipt components rather than combining totals across the two windows.
Why do other reports give different results for 2025?
Taxpayers for Common Sense reports 22 sales and 326,680 of 473,362 acres sold in its calendar 2025 analysis. It reports $354,405,095 in bonus bid revenue. BLM Table 15 reports 20 sales and 200,194.017 of 702,193.137 acres receiving bids for FY 2025. The fiscal year includes October through December 2024 and ends before the final three calendar months of 2025. The calendar review also reports a different sale population. To reconcile two publications, match each sale by date and location first, then check the acreage category and the components of receipts.
A journalist writing about the federal fiscal year can use the BLM result and the denominator in the table above. Someone evaluating calendar 2025 auction outcomes can use the calendar report within its stated coverage. A comparison across fiscal years should keep all observations on the fiscal basis.
| Measure | BLM fiscal 2025 | TCS calendar 2025 |
|---|---|---|
| Sales in publication | 20 | 22 |
| Acres offered | 702,193.137 | 473,362 |
| Acres receiving bids or sold as labeled | 200,194.017 receiving bids | 326,680 sold |
| Published receipts basis | Total receipts | Bonus bid revenue |
What does the average auction look like beside the average offered acre?
An equally weighted average across FY 2025 sales is 73.8%. The national acreage rate is 28.5%. To reproduce the first, divide acres with bids by acres offered for each sale, sum the 20 rates and divide by 20. To reproduce the second, sum acreage in both columns first, then divide the two sums. The unit you choose changes which observations influence the result most.
The equally weighted average gives a small offering and the 400,221-acre Alaska offering the same weight. The national rate gives each acre the same weight. FY 2024 illustrates that the direction of the gap can change: the average sale rate was lower than the pooled acreage rate that year. A reported average should always say whether it weights each sale or each acre.
| Fiscal year | Sales | Equally weighted average sale | Rate across all acres | Average less pooled, pp |
|---|---|---|---|---|
| 2023 | 8 | 64.7% | 53.7% | +11.0 |
| 2024 | 16 | 72.7% | 74.2% | -1.5 |
| 2025 | 20 | 73.8% | 28.5% | +45.3 |
Did acreage without bids mostly come from wholly unsuccessful sales?
Separate each sale row into full acreage coverage, partial coverage, or zero coverage. A full-coverage row has the same acreage in the offered and receiving columns. A partial row has positive receiving acreage below offered acreage. A zero row still counts in the annual denominator because BLM reports it as an offering. This grouping identifies where a comparison might require separate discussion of unsuccessful offerings and parcels within otherwise successful sales.
In FY 2025, 408,345.120 acres without bids came from the three zero-coverage sales. A further 93,654.000 acres without bids came from five sales where other acreage did receive bids. The two groups reconcile to the year’s total acreage without bids. That division uses whole sale rows. It cannot attribute an absence of bidding to lease terms, parcel characteristics, auction timing or bidder behavior.
| FY | Full coverage sales | Partial coverage sales | Zero coverage sales | Offered acres at zero coverage sales |
|---|---|---|---|---|
| 2023 | 2 | 5 | 1 | 4,720.000 |
| 2024 | 6 | 9 | 1 | 2,080.000 |
| 2025 | 12 | 5 | 3 | 408,345.120 |
Did the offices with the most acreage also generate the most receipts?
The order varies with the measure. In FY 2025, the Alaska office accounted for the largest offering. The Wyoming office accounted for the most acreage receiving bids. New Mexico generated the largest share of total receipts among BLM reporting offices in that fiscal year. Aggregate receipts combine prices, parcel sizes, quantity and the applicable receipt components. The ranking should travel with the metric it is based on.
BLM Table 15 uses office labels. Montana/Dakotas and Eastern States are administrative groupings in the source. When a story is about a geographic state, use the individual sale or parcel information to assign the correct geography before comparing results. The table below follows the source labels and includes all reporting offices that appear in the fiscal year. Its totals reconcile to the annual national result.
For example, New Mexico’s office generated 37.0% of FY 2025 receipts from 5.0% of the acreage that received bids. Wyoming’s office accounted for 62.9% of bid acreage and 16.5% of receipts. These are shares of the observed fiscal-year totals. The receipt shares include fees and rentals as well as bids. A comparison of price alone needs the corresponding winning bid data.
| FY 2025 BLM office | Offered acres | Acres with bids | Total receipts | Share of receipts |
|---|---|---|---|---|
| Alaska | 400,221.000 | 0.000 | $0 | 0.0% |
| Colorado | 7,895.030 | 7,895.030 | $6,730,718 | 3.1% |
| Eastern States | 2,089.690 | 2,089.690 | $14,660,759 | 6.8% |
| Montana/Dakotas | 17,118.417 | 16,367.977 | $69,712,694 | 32.4% |
| Nevada | 30,002.360 | 19,954.440 | $295,309 | 0.1% |
| New Mexico | 11,404.610 | 10,080.490 | $79,508,722 | 37.0% |
| Utah | 37,986.660 | 17,942.240 | $8,569,952 | 4.0% |
| Wyoming | 195,475.370 | 125,864.150 | $35,471,385 | 16.5% |
What records answer the next question about a particular parcel?
Start with the final sale result to establish which auction unit received a bid. Record the date, parcel identifier, applicable office and land description together. Then match those fields to the agency’s lease record if you need the issue date or current status. A nationwide bid-rate calculation provides context for the sale, while the parcel record answers what happened to that particular interest.
For a comparison of prices, collect parcel-level bid figures and verify whether they are bid dollars, bonus per acre, or a combined amount including charges. For a comparison of future activity, look for a separate record of drilling applications, decisions or well operations linked to the parcel or lease. Write down which event closes each question. That prevents a sale result from silently becoming an issuance, drilling or production figure in a subsequent article.
When a parcel is offered more than once, keep the date in the key. Counting unique acreage over several years would require a deduplicated land-level analysis. The sums here describe acreage offered in the sale rows, so the calculation can be rerun from the three published workbooks.
How does this analysis compare with published sources?
This study draws on BLM Table 15, Taxpayers for Common Sense, BLM leasing program. The comparison below shows which questions each source answers and which calculations AMR adds.
| Publication | What it covers | Where the scope differs | How AMR uses it |
|---|---|---|---|
| BLM Table 15 | Official fiscal-year sale rows with offered and bid acreage and parcels. | Raw sale rows require weighted aggregation to compare national rates. | Reconcile the annual totals and show the effect of the Alaska row. |
| Taxpayers for Common Sense | Calendar 2025 auction tallies and bonus bid receipts. | The calendar-year window and bonus bids differ from the BLM fiscal window and total receipts. | Keep dates and receipt components explicit when comparing figures. |
| BLM leasing program | Federal onshore competitive leasing context and process. | Process guidance does not tabulate parcel or acreage bid rates. | Explain how a sale result fits between the offering and later lease records. |
How can you reproduce and cite the auction statistics?
Open the three BLM Table 15 workbooks and use the rows listing sales above each annual total. AMR reconciled all 44 sale rows to the five published annual totals in each workbook: receipts, parcels and acres offered, and parcels and acres receiving bids. The download preserves the BLM office label and sale date, including the one two-day sale row.
To reproduce a national rate, group the rows by fiscal year and sum both relevant columns before dividing. To reproduce the FY 2025 sensitivity calculation, remove only the Alaska sale row and repeat the same aggregation. For a footnote, cite BLM for the individual sale records and AMR for the rate calculations or alternate denominator. Keep the fiscal period, onshore scope and offered-acre denominator with the figure.
Sources and data
- BLM FY 2025 Table 15, 20 sale rows
- BLM FY 2024 Table 15, 16 sale rows
- BLM FY 2023 Table 15, eight sale rows
- BLM federal onshore oil and gas leasing process
- Taxpayers for Common Sense calendar 2025 auction analysis
Download the data (CSV) · Read the data dictionary. The AMR analysis and figures are licensed CC BY 4.0. Refer to the original issuers for their materials.