Use the denominator beside the statistic. A country can lead in mine output, contain large reserves, supply a large share of imports, or manufacture a large quantity of cathode materials. Each uses a different accounting boundary. This reference shows the complete quantified country mine table, matches 2024 figures across USGS editions, and links separately to U.S. trade, global use and the IEA’s 2035 project-stage estimates.
Key Takeaways
- Australia led quantified 2025 mine output at 92,000 tons of lithium content, followed by China at 62,000 and Chile at 56,000. (USGS Lithium, MCS 2026, Nov 2026).
- The three leaders’ share fell by about 5.51 percentage points between 2024 and 2025 even as their combined output rose by 37,000 tons. AMR uses the same edition and rounded ex-U.S. denominator in both years. (USGS Lithium, MCS 2026, Nov 2026).
- The estimate for 2024 was revised from 240,000 to 222,000 tons, a decline of 7.50% between editions for the same reference year. (USGS Lithium, MCS 2025, Nov 2026). (USGS Lithium, MCS 2026, Nov 2026).
- Chile and Argentina supplied 97% of U.S. lithium imports in 2021 to 2024 on the displayed pooled shares. Neither share describes global mine output. (USGS Lithium, MCS 2026, Nov 2026).
- The U.S. held 4.4 million tons of estimated reserves and about 30 million tons of measured and indicated resources. Both measure lithium content in distinct classifications. (USGS Lithium, MCS 2026, Nov 2026).
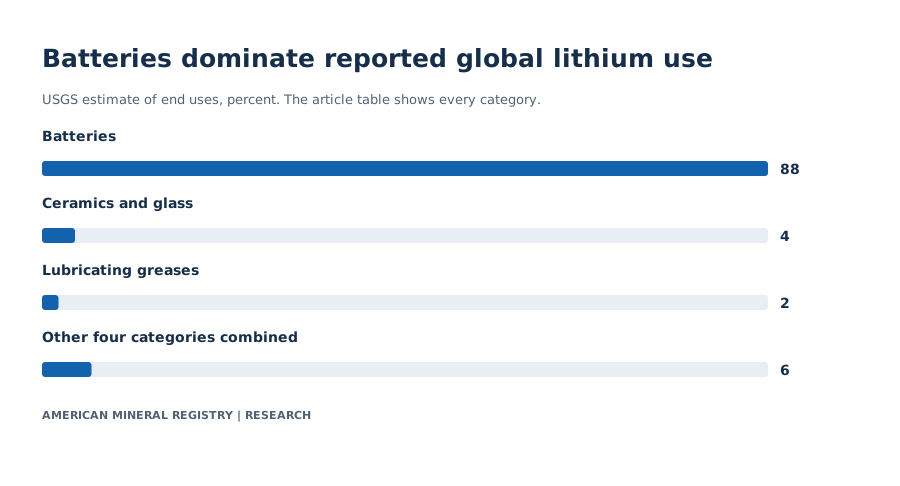
- Batteries accounted for an estimated 88% of world lithium end uses in the USGS commodity summary. (USGS Lithium, MCS 2026, Nov 2026).
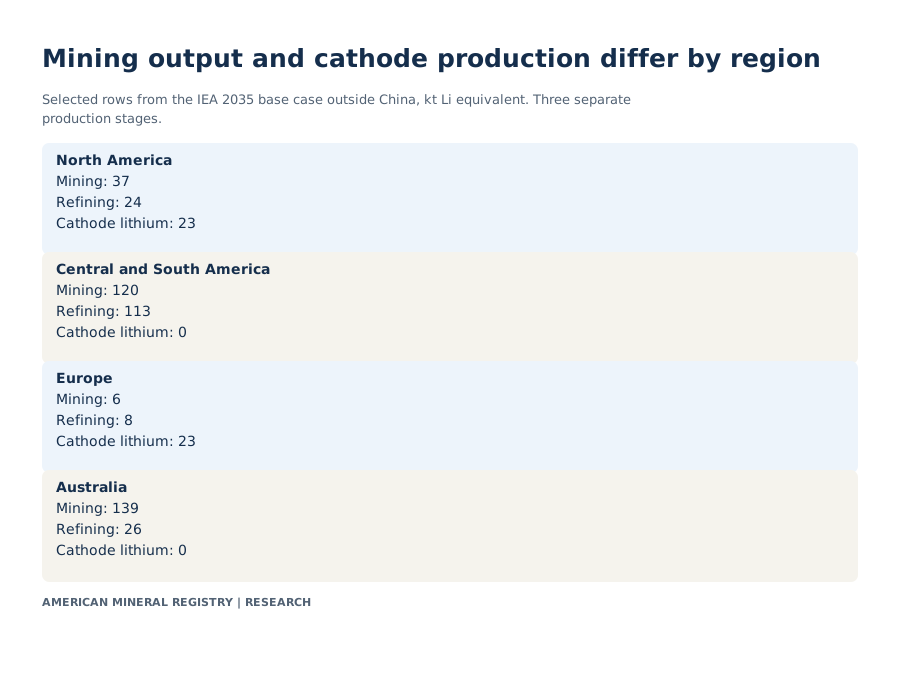
- Australia’s projected 2035 stage estimates are 139 kt mined and 26 kt refined in the IEA base case, on a lithium-equivalent basis. These are separate modeled outputs. (IEA 2035 base case, available chart CSV, Nov 2026).
Which countries mine the most lithium?
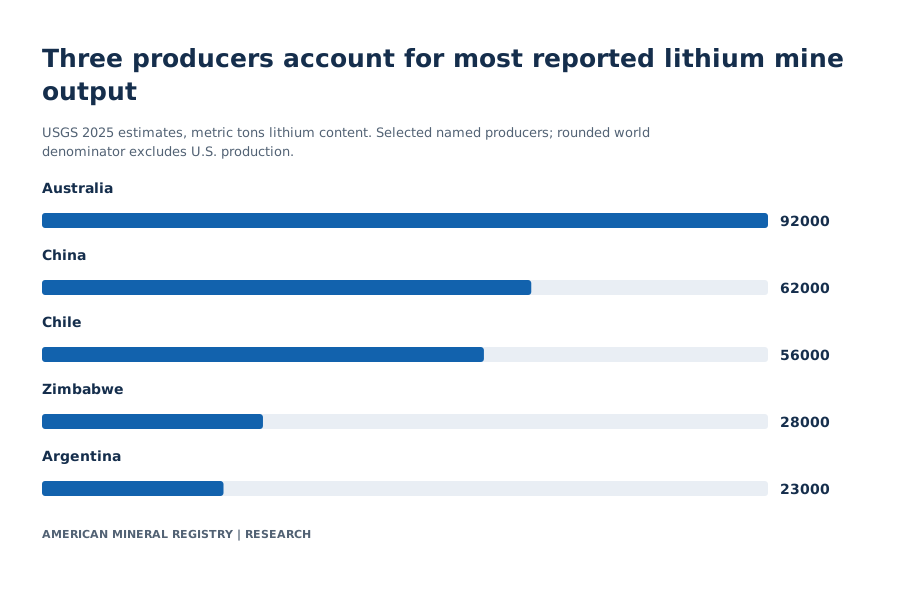
USGS estimates 92,000 metric tons of lithium content from Australia in 2025, 62,000 from China and 56,000 from Chile. These are mine figures. The rounded comparison total excludes U.S. production, which the source withholds. (USGS Lithium, MCS 2026, Nov 2026).

View chart data
USGS 2025 estimates, metric tons lithium content. Selected named producers; rounded world denominator excludes U.S. production.
| Country | Mine output (t Li) |
|---|---|
| Australia | 92000 |
| China | 62000 |
| Chile | 56000 |
| Zimbabwe | 28000 |
| Argentina | 23000 |
Values and definitions are also readable in HTML. Source precision and scope apply.
| Rank | Country | Estimated 2025 mine output (t Li) | Share of rounded ex-U.S. total (%) |
|---|---|---|---|
| 1 | Australia | 92000 | 31.7241 |
| 2 | China | 62000 | 21.3793 |
| 3 | Chile | 56000 | 19.3103 |
| 4 | Zimbabwe | 28000 | 9.6552 |
| 5 | Argentina | 23000 | 7.9310 |
| 6 | Brazil | 12000 | 4.1379 |
| 7 | Mali | 9400 | 3.2414 |
| 8 | Canada | 5600 | 1.9310 |
| 9 | Portugal | 380 | 0.1310 |
| Country | 2024 mine output (t Li) | 2025 mine output (t Li) | Source flag |
|---|---|---|---|
| Argentina | 13800 | 23000 | 2024 reported, footnote 5 |
| Australia | 82700 | 92000 | Australia JORC or equivalent reserves 5.1 million t, footnote 6 |
| Brazil | 10200 | 12000 | USGS table estimate |
| Canada | 4820 | 5600 | USGS table estimate |
| Chile | 48900 | 56000 | 2024 reported, footnote 5 |
| China | 41400 | 62000 | USGS table estimate |
| Mali | 770 | 9400 | USGS table estimate |
| Portugal | 380 | 380 | USGS table estimate |
| Zimbabwe | 20000 | 28000 | USGS table estimate |
In the published comparison, Australia alone accounted for about 31.72% of the 2025 rounded ex-U.S. total. The three leaders produced 210,000 tons in total. AMR’s share divides their combined tonnage by 290,000. When a writer wants to compare two regions, the “excluding U.S. production” qualifier has to travel with this percentage. The table ranks quantified country entries. U.S. commercial output exists according to USGS, and the withheld figure cannot be used to rank the United States.
Output and its share can move in opposite directions. In the same edition, the three leaders went from a combined 173,000 tons to 210,000 tons, an increase of about 21.39%. The rounded ex-U.S. total rose about 30.63%. Output outside the top three therefore rose faster relative to its starting base. The top-three share dropped from 77.93% to 72.41%. A falling share alone would not establish an absolute decline in the countries’ production.
The 2025 table includes both lithium from brines and lithium from mined minerals. USGS describes Australia’s main source operations as mineral-based and Argentina’s main source operations as brine-based. China has both. The reported comparison is by contained lithium, which makes these source-defined mine figures comparable even where the material originally extracted is different.
Gross tonnes of mineral concentrate or brine volume cannot take the place of tonnes of lithium content. Consider a hypothetical concentrate parcel of 1,000 tonnes containing 1% lithium by mass. It holds 10 tonnes of lithium before downstream recovery losses. The gross parcel is still 1,000 tonnes. A unit conversion to a common mass basis requires the grade, product and stage. Analysts comparing lithium metal, lithium carbonate and lithium hydroxide should identify which quantity was measured before putting it into a chart.
How much did lithium production actually increase?
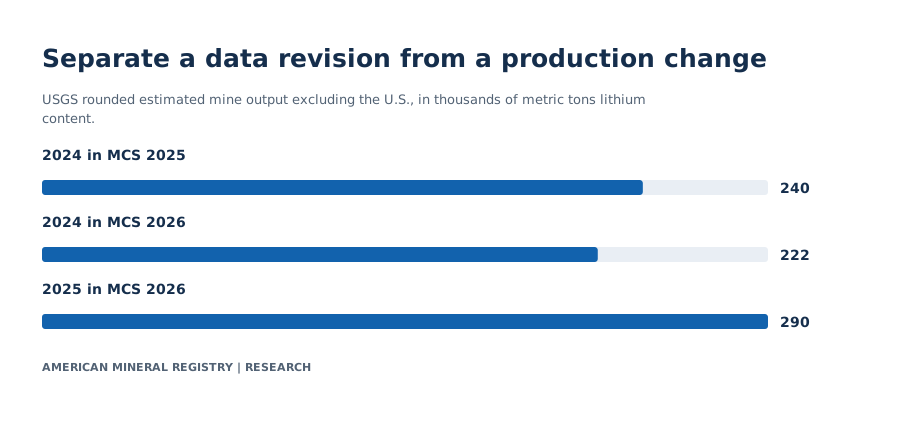
In MCS 2026, the rounded ex-U.S. mine total rises from 222,000 tons in 2024 to 290,000 in 2025, or 30.63% by AMR arithmetic. The earlier edition’s 2024 figure was 240,000. Revisions and changes through time have different inputs. (USGS Lithium, MCS 2026, Nov 2026). (USGS Lithium, MCS 2025, Nov 2026).

View chart data
USGS rounded estimated mine output excluding the U.S., in thousands of metric tons lithium content.
| Edition and reference year | Thousand t Li |
|---|---|
| 2024 in MCS 2025 | 240 |
| 2024 in MCS 2026 | 222 |
| 2025 in MCS 2026 | 290 |
Values and definitions are also readable in HTML. Source precision and scope apply.
USGS MCS 2026 Lithium, world mine table Original primary evidence · USGS MCS 2025 Lithium, original 2024 estimate
| Year | Mine output excl. U.S. (t Li) | Estimated consumption (t Li) | Boundary |
|---|---|---|---|
| 2024 | 222000 | 220000 | Mine total excludes U.S.; consumption separately estimated |
| 2025 | 290000 | 263000 | Mine total excludes U.S.; consumption separately estimated |
| 2024 comparison | MCS 2025 (t Li) | MCS 2026 (t Li) | AMR revision (t Li) |
|---|---|---|---|
| Argentina | 18000 | 13800 | -4200 |
| Australia | 88000 | 82700 | -5300 |
| Brazil | 10000 | 10200 | 200 |
| Canada | 4300 | 4820 | 520 |
| Chile | 49000 | 48900 | -100 |
| China | 41000 | 41400 | 400 |
| Portugal | 380 | 380 | 0 |
| Zimbabwe | 22000 | 20000 | -2000 |
| World total excl. U.S. | 240000 | 222000 | -18000 |
A valid time comparison uses a common release where possible. Dividing 290,000 by 240,000 gives a 20.83% increase, but mixes the 2025 estimate with the older edition’s 2024 baseline. Comparing the two 2024 figures instead gives a revision of minus 18,000 tons, or minus 7.50%. It is possible for a new estimate to revise history downward and still show strong year-over-year growth. These are distinct findings.
Several country values changed. Argentina’s 2024 entry moved from 18,000 tons in the earlier edition to 13,800 in the later one. Australia moved from 88,000 to 82,700 and Zimbabwe from 22,000 to 20,000. Canada moved up from 4,300 to 4,820. The country rows in the revision table match geography across releases. The world figure uses the published rounded total for each edition, and need not equal the sum of matched country revisions. USGS temporarily removed Namibia from the later mine table and reported a Mali entry after two operations started in 2024. AMR keeps these source coverage changes visible in the method rather than forcing a comparable row where one edition lacks it.
USGS estimates lithium consumption rose from 220,000 to 263,000 tons over the same reference years. That is a separate demand series. The adjacent mine total excludes U.S. mine output, and the commodity report does not reconcile output and consumption as a stock or inventory account. Subtracting the figures may be arithmetic but does not establish an exact surplus available to buyers. Import timing, inventory and product coverage need their own evidence.
A reader comparing annual mineral charts should save the source edition next to the year, especially when a source updates values from provisional company reports. If a later edition restates the table, decide whether the task is reproducing what was known at the time or comparing the best available estimates now. The correct source row differs between those two tasks.
What do U.S. lithium imports and exports tell us?
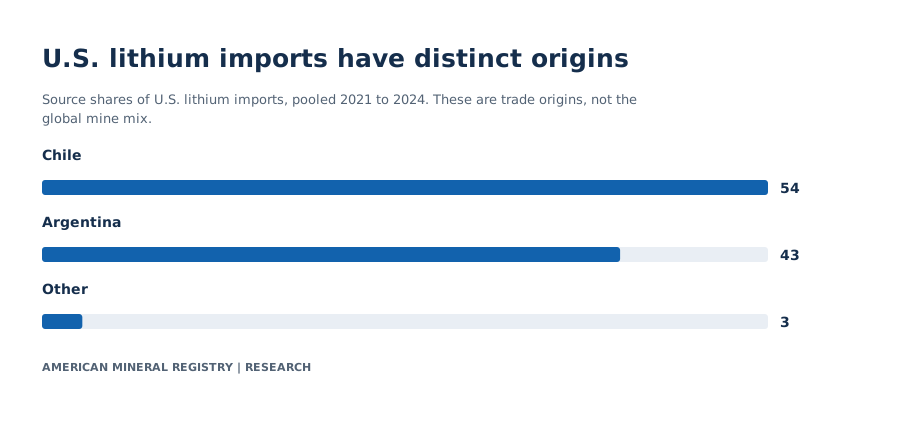
Chile accounted for 54% and Argentina for 43% of U.S. lithium import sources in USGS’s 2021 to 2024 grouping. In 2025 the U.S. imported 3,800 tons of lithium content and exported 2,000, while net import reliance is reported as more than 50% of apparent consumption. (USGS Lithium, MCS 2026, Nov 2026).

View chart data
Source shares of U.S. lithium imports, pooled 2021 to 2024. These are trade origins, not the global mine mix.
| Origin group | Share (%) |
|---|---|
| Chile | 54 |
| Argentina | 43 |
| Other | 3 |
Values and definitions are also readable in HTML. Source precision and scope apply.
USGS MCS 2026 Lithium, Import Sources Original primary evidence
| Origin group | 2021–2024 U.S. share (%) |
|---|---|
| Chile | 54 |
| Argentina | 43 |
| Other | 3 |
| Year | Imports (t Li) | Exports (t Li) | AMR gross flows difference (t Li) | Net import reliance bound (%) | Vintage |
|---|---|---|---|---|---|
| 2021 | 2640 | 1870 | 770 | >25 | Published history |
| 2022 | 3260 | 2440 | 820 | >25 | Published history |
| 2023 | 3390 | 1960 | 1430 | >50 | Published history |
| 2024 | 3020 | 1690 | 1330 | >50 | Published history |
| 2025 | 3800 | 2000 | 1800 | >50 | Estimate |
The 1,800-ton import-minus-export difference is a transparent calculation using displayed gross flows. The USGS defines net import reliance using net imports adjusted for stock changes, expressed as a share of apparent consumption. The source withholds domestic production and apparent consumption. Its reported greater-than sign remains part of the statistic. A writer cannot replace more than 50% with an exact 50% or back out an actual denominator from two gross trade figures.
The pooled origin shares refer to U.S. imports over a separate four-year window. They do not describe the source mix of the 2025 estimate. Nor do they establish how long the material spent in each processing stage, the ownership of the mines, or the finished battery’s origin. Trade statistics can help describe a supply relationship within their reporting category. Product origin and stage of processing remain separate questions.
USGS reports commercial-scale production from a Nevada continental brine operation during the reference year and domestic producers of downstream compounds using domestic or imported feedstock. Domestic production therefore cannot be assumed zero. A domestic conversion facility can use imported inputs, and its presence does not measure national self-sufficiency in the earlier mine stage. If measuring domestic contribution, use an actual production series or a published dependency bound rather than a factory count.
The table preserves five years of gross imports, gross exports and the exact published reliance bounds, including greater than 25% in 2021 and 2022 and greater than 50% in the following three years. A threshold change tells readers the lower bound moved. It cannot establish the size or even the year-on-year path of the actual reliance rate within the values permitted by those bounds.
How much lithium is in reserves versus resources?
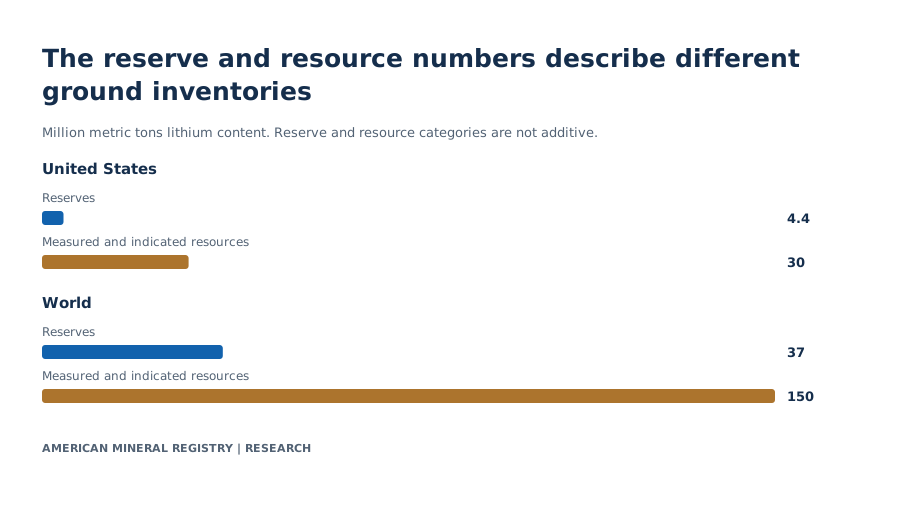
The USGS 2026 commodity summary reports 37 million metric tons of lithium reserves worldwide and about 150 million tons of measured and indicated resources. It reports 4.4 million tons of U.S. reserves and 30 million tons of U.S. measured and indicated resources. (USGS Lithium, MCS 2026, Nov 2026).

View chart data
Million metric tons lithium content. Reserve and resource categories are not additive.
| Geography | Reserves | Measured and indicated resources |
|---|---|---|
| United States | 4.4 | 30 |
| World | 37 | 150 |
Values and definitions are also readable in HTML. Source precision and scope apply.
USGS MCS 2026 Lithium, world resources and reserves Original primary evidence
| Country or reporting group | Estimated reserves (t Li) |
|---|---|
| Argentina | 4400000 |
| Australia | 8400000 |
| Brazil | 540000 |
| Canada | 1600000 |
| Chile | 9200000 |
| China | 4600000 |
| Mali | 370000 |
| Portugal | 60000 |
| Zimbabwe | 500000 |
| United States | 4400000 |
| Other countries, source group | 2400000 |
| World total | 37000000 |
| Geography | Reserves (million t Li) | Measured and indicated resources (million t Li) |
|---|---|---|
| United States | 4.4 | 30 |
| World | 37 | 150 |
A resource describes mineral material with a geological estimate under the source’s classification. A reserve is the economically mineable part as assessed under reserve rules, including project and feasibility conditions. The appropriate level may change when data, commodity assumptions, ownership or feasibility work change. Reserves and resources should not be added together. The fact that the resource estimate is larger does not establish how much additional material will become economic, when it would be mined, or how much cathode material will be produced.
A particularly useful distinction is Australia’s row. The published USGS estimate is 8.4 million tons of lithium reserves. The source footnote separately gives 5.1 million tons on a Joint Ore Reserves Committee compliant or equivalent basis. The main reserve table keeps the printed USGS value and the note identifies the narrower basis. The two quantities should not be averaged or summed. If a reader needs one stated rule, cite the measure with that rule rather than selecting a larger number.
The USGS U.S. reserves table contains a public value even though the U.S. mine output table contains a withholding code. That is a normal difference in disclosure and measurement between a ground inventory category and an annual flow. A public reserve cannot be used to deduce suppressed production. Likewise, a country with a large resource estimate may not be a leading producer in the 2025 table. Converting a resource into output requires a validated production pathway, project timing and extraction economics.
Dividing global reserves by one year’s mine output creates a static ratio under the chosen units and areas. Here the published mine denominator excludes U.S. production and the reserve total includes U.S. reserves. A ratio using those two values would also mix coverage. It should not be reported as years until lithium runs out. Such a forecast would require future demand, extraction, reserve replacement and project-specific assumptions.
How much lithium is used in batteries?
The USGS estimates that 88% of world lithium end use goes into batteries. Ceramics and glass account for 4%, and lubricating greases for 2%. The remaining four categories account for 6% combined. (USGS Lithium, MCS 2026, Nov 2026).

View chart data
USGS estimate of end uses, percent. The article table shows every category.
| End use | Share (%) |
|---|---|
| Batteries | 88 |
| Ceramics and glass | 4 |
| Lubricating greases | 2 |
| Other four categories combined | 6 |
Values and definitions are also readable in HTML. Source precision and scope apply.
USGS MCS 2026 Lithium, Domestic Production and Use Original primary evidence
| End use | USGS global estimate (%) |
|---|---|
| Batteries | 88 |
| Ceramics and glass | 4 |
| Lubricating greases | 2 |
| Air treatment | 1 |
| Casting mold flux | 1 |
| Medical | 1 |
| Other | 3 |
This denominator is all reported lithium end uses, not all battery minerals, lithium inside a standard EV pack, or the portion of cars fitted with a battery. The battery category includes multiple markets, including portable electronics, transport, stationary storage and other rechargeable products. The USGS table does not quantify their separate shares. A writer should keep “of lithium end use” beside the 88% figure and avoid substituting “of lithium used in EVs.”
Chemistry matters for material requirements. A chemistry can reduce one metal’s role while still using another. AMR’s vehicle mineral benchmark reports a particular IEA model and distinguishes vehicle-wide mineral figures from battery recipe estimates. Combining the 88% global end-use share with a single model design cannot establish aggregate demand. A market model would need the number of packs, their size distribution, chemistries, material intensities and the share of different end-market applications.
The source distinguishes material prices and demand over time. A lower unit price can coincide with rising consumption if output availability, manufacturing and stocking behavior change. An annual benchmark averages across the year, while a spot observation identifies a market and date. Keep carbonate, hydroxide and mineral concentrate quotes separate because their product basis and delivery conditions differ.
When building a story around supply, use the mine data to explain country production and the end-use table to explain who uses the material. The two can provide context together. Neither gives the share of batteries sourced from a particular country or the exact sourcing of an intermediate commodity. Those require source-level procurement data.
Do more mines mean more refining and cathode output?
In the IEA’s 2035 base case outside China, Australia shows 139 thousand metric tons of lithium equivalent at the mining stage and 26 thousand at refining. North America’s corresponding stage estimates are 37, 24 and 23 across mining, refining and lithium contained in manufactured cathodes. These are source-defined outputs across separate networks. (IEA 2035 base case, available chart CSV, Nov 2026).

View chart data
Selected rows from the IEA 2035 base case outside China, kt Li equivalent. Three separate production stages.
| Region | Mining | Refining | Cathode lithium |
|---|---|---|---|
| North America | 37 | 24 | 23 |
| Central and South America | 120 | 113 | 0 |
| Europe | 6 | 8 | 23 |
| Australia | 139 | 26 | 0 |
Values and definitions are also readable in HTML. Source precision and scope apply.
IEA 2035 lithium by stage, offered CSV Original primary evidence
| Region (outside China) | Modeled mining (kt Li equivalent) | Modeled refining (kt Li equivalent) | Contained in cathodes (kt Li equivalent) |
|---|---|---|---|
| North America | 37 | 24 | 23 |
| Central and South America | 120 | 113 | 0 |
| Europe | 6 | 8 | 23 |
| Asia except top refiners | 0 | 19 | 67 |
| Australia | 139 | 26 | 0 |
| Africa | 62 | 0 | 3 |
Place matters differently at each stage. In the displayed base case, Central and South America has projected mining of 120 and refining of 113 thousand tons of lithium equivalent but zero in the shown cathode column. The Asia group excluding the leading refiner has zero in the selected mining row, 19 in refining and 67 contained in cathodes. These cells characterize the base-case entries. A row's zero does not guarantee that companies in the region will never develop that stage.
The stage differences do not establish how many tons of one region’s mined lithium move into its own refining plants. Trade between regions, different feedstocks, capacity and the source’s project modeling can change independently. A ratio of modeled refining to mining at the regional level is not a processing yield. The chart provides production estimates and the contained material in the downstream product, not the gross mass of cathodes.
The IEA offered CSV has seven column headings, but the Mining row has only six numeric fields. AMR displays the six fully reported regional comparisons and excludes the Russia column from this table. The two available downstream Russia entries cannot determine its unreported mining cell. No missing cell is filled with zero, and no total for all regions outside China is inferred from the truncated row. This is a claim about the downloadable evidence, not a conclusion about Russian production.
The modeled year is 2035, conditional on the IEA’s base case for existing and announced projects. It belongs alongside the historical table only if the period and stage are clear. A forecast can be useful for identifying where refining or manufacturing might lag announced mining. A project or purchasing decision should verify actual commissioning, operating capacity and procurement terms before treating a modeled number as supply.
How should this research be quoted?
Use the date and denominator beside the number. Attribute original measurements to their producers and AMR’s calculations or comparisons to American Mineral Registry. The specific finding controls below preserve those qualifications and link the exact evidence. A source-derived estimate is not a transaction price, a current operational reading or a forecast guarantee.
Frequently asked questions
What was the largest lithium mining country in 2025?
Australia led the quantified USGS rows at 92,000 metric tons of lithium content. The rounded denominator excludes U.S. production. (USGS Lithium, MCS 2026, Nov 2026).
What changed in the USGS 2024 estimate?
The earlier edition put the rounded ex-U.S. total at 240,000 tons. MCS 2026 revised it to 222,000 tons. That is a comparison of two estimates for 2024. (USGS Lithium, MCS 2025, Nov 2026). (USGS Lithium, MCS 2026, Nov 2026).
Did the United States produce zero lithium?
USGS reports commercial-scale Nevada brine production and withholds the U.S. volume. A withheld value represents confidential information rather than zero. (USGS Lithium, MCS 2026, Nov 2026).
What is the difference between U.S. imports and reliance?
Imports are gross incoming flows. USGS net import reliance uses net imports and stock adjustments relative to apparent consumption. The latest estimate remains bounded above 50%.
Why is mine output in tons of lithium rather than tons of ore?
Contained lithium is a common metal-content unit across materials. Ore, concentrates, compounds and recovered metal require different grades or conversion factors to be stated in one series.
Why are U.S. reserves public when production is withheld?
Reserves and annual output are different measurements. Disclosure of one line does not determine the other.
Can I infer a refining yield from the 2035 chart?
The region totals do not track the same physical material through successive plants. The IEA reports separate project-stage production volumes. (IEA 2035 base case, available chart CSV, Nov 2026).
Why is one region excluded from the 2035 comparison?
The offered IEA mining row omits its final input field. The AMR table uses the six regions with complete stage values. See the original file and notes. (IEA 2035 base case, available chart CSV, Nov 2026).
Methodology and Sources
The author inspected the USGS Lithium chapter in MCS 2026, pages 1 and 2, and matched eight country 2024 production rows plus the world total against MCS 2025 page 2. The quantified mine comparison omits the withheld U.S. output while retaining all nine country rows with a displayed match for 2024 and 2025 in the current edition. Argentina and Chile’s 2024 entries carry footnote 5. All shares use the producer's rounded denominator. Date labels identify the data period and the reporting vintage.
The AMR concentration statistic adds Australia, China and Chile before dividing by the rounded world output excluding U.S. production. Edition revisions subtract earlier from later for the same 2024 period. Gross trade differences subtract exports from imports before any stock adjustment. Reserves, resources and usage percentages retain USGS categories. Reserves and resource values are producer estimates, with the reported Australia reserve qualification retained.
The separately tagged IEA chart was retrieved using its native public CSV download. The private capture retains the original CC BY 4.0 header and notes. The public table normalizes the six complete geographic sets and maintains the original numeric terms. The stage figures do not enter country shares, production revisions or trade arithmetic. Reproduction uses only the exposed tables and standard Python modules.
Glossary
- Lithium content. Mass of elemental lithium represented by a stream or deposit.
- Mine output. The source-defined annual extraction or recoverable output measure.
- Brine. A solution from which dissolved material can be extracted.
- Concentrate. An enriched mineral material that can be further processed.
- Reserve. Economically mineable inventory under the source classification.
- Resource. A geologically estimated mineral occurrence under a stated classification.
- Apparent consumption. Production plus trade net of exports and stated adjustments.
- Cathode lithium. Contained lithium in manufactured battery cathodes for the IEA stage metric.
Sources
- USGS MCS 2026 Lithium. Pages 1–2, U.S. salient statistics, end uses, resource definitions and world production.
- USGS MCS 2025 Lithium. Page 2 is the earlier 2024 production estimate.
- IEA 2026 lithium project estimates. Original offered chart download and notes, 2035 base-case stage data.