This reference gives the full country table, an estimate-vintage comparison, the U.S. natural graphite balance and the separate processed anode import comparison. An IEA project chart extends the comparison to potential mining, refining and anode manufacturing stages in 2035. It has its own unit and scenario.
Key Takeaways
- China's 2025 mine row is 1.4 million metric tons, compared with a rounded 1.8 million ton world total. AMR retains the producer’s 82% narrative separately from the 77.78% table arithmetic. (USGS Natural Graphite, MCS 2026, Nov 2026).
- U.S. natural graphite imports totalled an estimated 79,000 metric tons in 2025, with 8,400 exports and 71,000 apparent consumption. (USGS Natural Graphite, MCS 2026, Nov 2026).
- China including Hong Kong supplied 46% of U.S. natural graphite imports in 2021 to 2024, followed by Canada and Mozambique at 13% each. (USGS Natural Graphite, MCS 2026, Nov 2026).
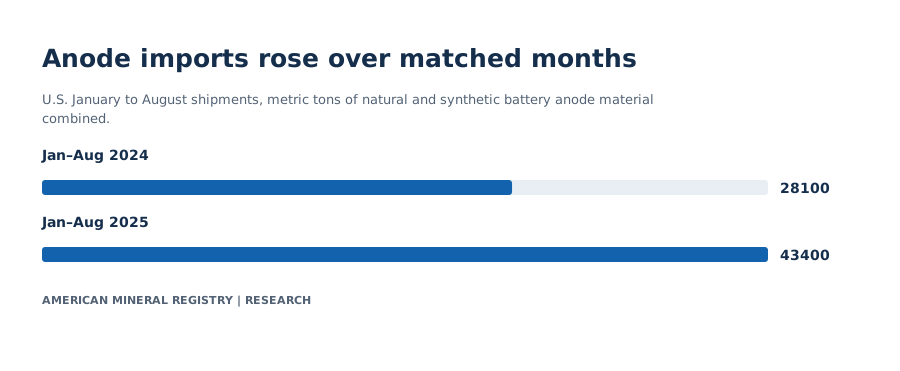
- U.S. battery anode material imports rose about 54.45% from 28,100 to 43,400 metric tons over matched January to August periods in 2024 and 2025. This product includes natural and synthetic material. (USGS Natural Graphite, MCS 2026, Nov 2026).
- USGS revised 2024 world mine output from 1.60 to 1.55 million tons between editions. The 2025 estimate subsequently uses the newer comparison baseline. (USGS Natural Graphite, MCS 2025, Nov 2026). (USGS Natural Graphite, MCS 2026, Nov 2026).
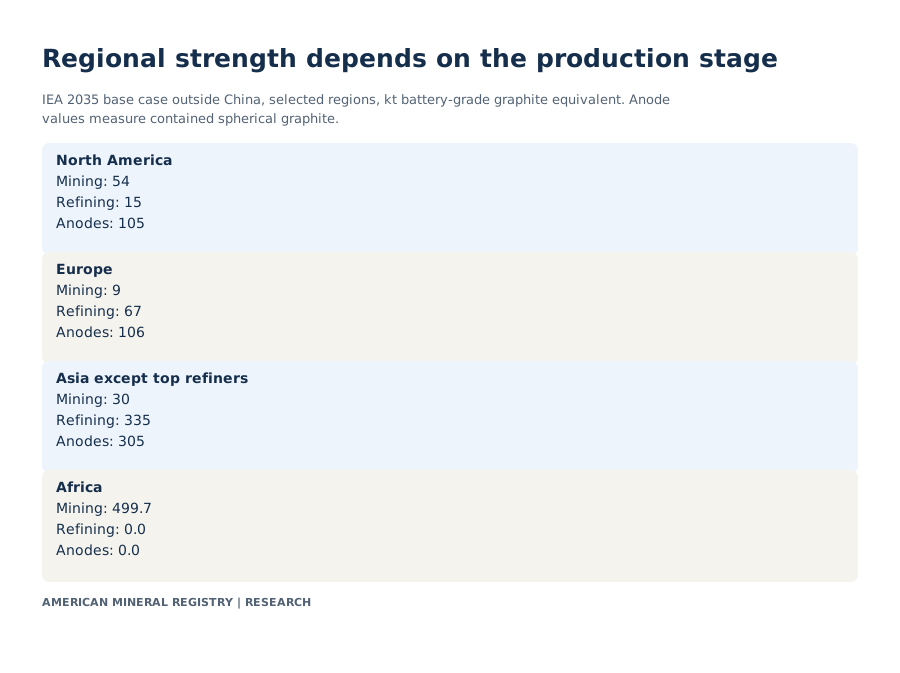
- Africa’s 2035 IEA modeled mining result is 499.7 kt battery-grade equivalent outside China, while the offered regional refining row shows zero in that case. These are projected stage quantities. (IEA 2035 graphite stage estimates, Nov 2026).
Which countries produce the most natural graphite?
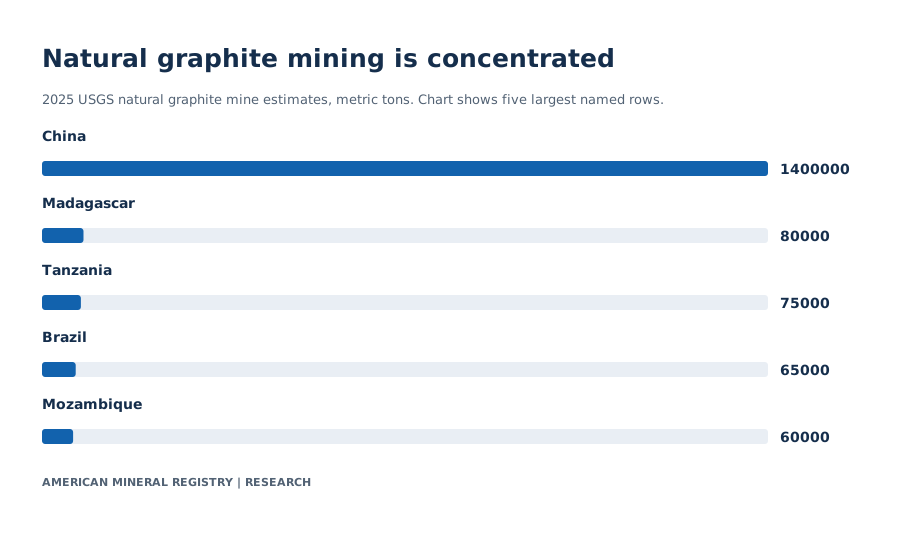
In the USGS 2025 mine table, China leads with 1.4 million tons, followed among the displayed countries by Madagascar at 80,000, Tanzania at 75,000, Brazil at 65,000 and Mozambique at 60,000. The rounded world estimate is 1.8 million tons. (USGS Natural Graphite, MCS 2026, Nov 2026).

View chart data
2025 USGS natural graphite mine estimates, metric tons. Chart shows five largest named rows.
| Producer | Mine output (t) |
|---|---|
| China | 1400000 |
| Madagascar | 80000 |
| Tanzania | 75000 |
| Brazil | 65000 |
| Mozambique | 60000 |
Values and definitions are also readable in HTML. Source precision and scope apply.
USGS MCS 2026 Graphite, p. 2 mine table Original primary evidence
| 2025 rank | Named producer | Mine output (t) | AMR share of rounded world output (%) |
|---|---|---|---|
| 1 | China | 1400000 | 77.7778 |
| 2 | Madagascar | 80000 | 4.4444 |
| 3 | Tanzania | 75000 | 4.1667 |
| 4 | Brazil | 65000 | 3.6111 |
| 5 | Mozambique | 60000 | 3.3333 |
| Country | Reported 2024 mine output (t natural graphite) | Estimated 2025 mine output (t natural graphite) | Source flag |
|---|---|---|---|
| United States | 0 | 0 | Source dash means zero |
| Austria | 100 | 200 | 2025 estimate |
| Brazil | 58000 | 65000 | 2025 estimate |
| Canada | 11700 | 8000 | 2025 estimate |
| China | 1270000 | 1400000 | 2025 estimate |
| Germany | 140 | 140 | 2025 estimate |
| India | 17600 | 17000 | 2025 estimate |
| North Korea | 8100 | 8000 | 2024 estimate marked e |
| South Korea | 1000 | 500 | 2025 estimate |
| Madagascar | 85000 | 80000 | 2025 estimate |
| Mexico | 706 | 740 | 2025 estimate |
| Mozambique | 39000 | 60000 | 2025 estimate |
| Norway | 5340 | 6600 | 2025 estimate |
| Russia | 20000 | 25000 | 2024 estimate marked e |
| Sri Lanka | 3000 | 3200 | 2025 estimate |
| Tanzania | 27000 | 75000 | 2024 estimate marked e |
| Turkey | 2600 | 2200 | 2025 estimate |
| Ukraine | 900 | 800 | 2025 estimate |
| Vietnam | 500 | 500 | 2025 estimate |
| World total | 1550000 | 1800000 | Rounded USGS total |
This is natural graphite produced at the mine stage. It includes source-reported varieties of natural graphite and excludes synthetic graphite production. Battery-grade and industrial-grade output may require different processing, so one country's mine output gives neither its usable anode tonnage nor its total graphite industry output. The chart identifies the largest named producers. The complete country table keeps the smaller rows, paired reference years and the USGS rounded world total.
Production shares use the producer’s world total. USGS rounds its published table and individual country rows, so the sum of displayed rows should not be substituted for an exact world balance. If readers want a precise answer about China’s concentration, state the unit and that the share comes from displayed, rounded quantities. The formal treatment of estimates matters more than extra decimal places in a quoted number.
Tanzania illustrates a different kind of change. In MCS 2026 it rises from an estimated 27,000 tons in 2024 to 75,000 tons in 2025, a change of 48,000 tons or about 177.78%. The source narrative describes increased output and identifies projects commissioned before the 2025 reference year. The percentage measures a large relative increase from a smaller starting point. It does not imply Tanzania supplied a larger absolute amount than China or Madagascar.
A country ranking can help identify supply concentration in a headline, but a sourcing decision also needs graphite form, grade, purity and delivery terms. A project offering flakes suitable for one application may not produce the same target form or specifications as another. Annual mine volumes are an important physical input, with anode-ready materials further downstream.
What percentage of the world's natural graphite does China produce?
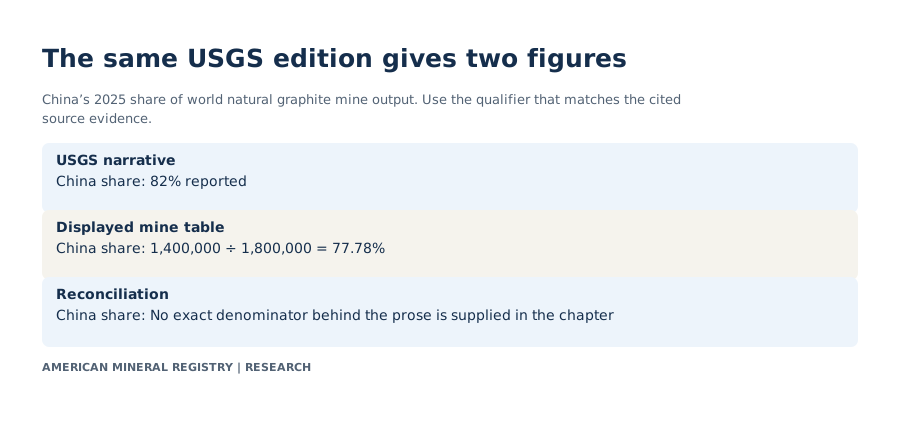
AMR calculates 77.78% from the displayed 2025 China and world rows. The chapter's narrative separately says 82%. The available chapter does not provide a more precise numerator and denominator that reconcile the two statements. (USGS Natural Graphite, MCS 2026, Nov 2026).

View chart data
China’s 2025 share of world natural graphite mine output. Use the qualifier that matches the cited source evidence.
| Basis | China share |
|---|---|
| USGS narrative | 82% reported |
| Displayed mine table | 1,400,000 ÷ 1,800,000 = 77.78% |
| Reconciliation | No exact denominator behind the prose is supplied in the chapter |
Values and definitions are also readable in HTML. Source precision and scope apply.
USGS MCS 2026 Graphite, p. 1 prose and p. 2 table Original primary evidence
| Country | 2024 in MCS 2025 (t) | 2024 in MCS 2026 (t) | AMR revision (t) |
|---|---|---|---|
| United States | 0 | 0 | 0 |
| Austria | 500 | 100 | -400 |
| Brazil | 68000 | 58000 | -10000 |
| Canada | 20000 | 11700 | -8300 |
| China | 1270000 | 1270000 | 0 |
| Germany | 170 | 140 | -30 |
| India | 27800 | 17600 | -10200 |
| North Korea | 8100 | 8100 | 0 |
| South Korea | 9600 | 1000 | -8600 |
| Madagascar | 89000 | 85000 | -4000 |
| Mexico | 900 | 706 | -194 |
| Mozambique | 75000 | 39000 | -36000 |
| Norway | 7000 | 5340 | -1660 |
| Russia | 20000 | 20000 | 0 |
| Sri Lanka | 3300 | 3000 | -300 |
| Tanzania | 25000 | 27000 | 2000 |
| Turkey | 3100 | 2600 | -500 |
| Ukraine | 1200 | 900 | -300 |
| Vietnam | 2000 | 500 | -1500 |
| World total | 1600000 | 1550000 | -50000 |
The calculation uses 1,400,000 divided by 1,800,000 and multiplied by 100. A citation can reproduce the result directly from the table. It should say “about 77.8% using the displayed USGS values.” When quoting the narrative, attribute it independently as the USGS's reported estimate of 82%. Avoid turning the two values into a confidence range or silently replacing the producer's narrative estimate with AMR's arithmetic.
The 2024 vintage table answers a different question. The prior edition’s world estimate was 1,600,000 tons for 2024, revised to 1,550,000 in MCS 2026, a 50,000-ton downward revision. At the country level, the earlier Mozambique estimate was 75,000 tons, while the new edition gives 39,000 for the same year. The later edition estimates 60,000 tons for 2025. A comparison of older 75,000 with newer 60,000 suggests a decline, while a matched current-edition comparison of 39,000 to 60,000 gives an increase of about 53.85%. The source table's sequence matters enough to reverse the direction of this example.
China’s 2024 mine row reads 1,270,000 in both editions under comparison. Its contribution to the revised 2024 global total can appear larger because the denominator moved, even though the displayed country row did not. This is why a country-share chart should show the release edition as well as the reporting year on either the chart or underlying download.
The data also preserve source flags. Some country 2024 entries in the new table remain explicitly estimated, and 2025 is an estimated column. A change from one year or one edition can reflect actual output, improved reporting, revised definitions or producer disclosure. The table demonstrates the observed revision and leaves the precise cause to the source record.
How dependent is the U.S. on natural graphite imports?
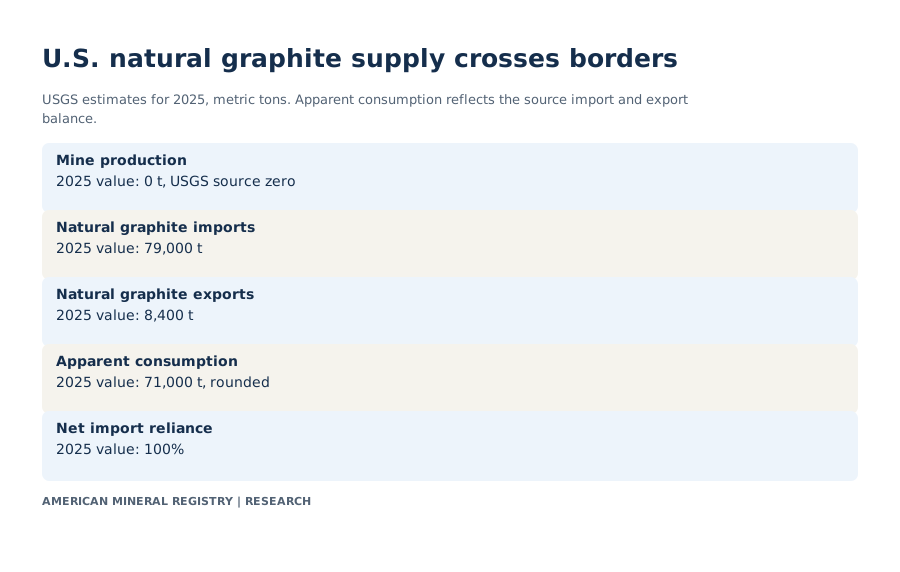
USGS records zero U.S. natural graphite mine production, estimated imports of 79,000 metric tons, and 100% net import reliance in 2025. The reported 71,000 tons of apparent consumption is rounded. This is the natural graphite account. (USGS Natural Graphite, MCS 2026, Nov 2026).

View chart data
USGS estimates for 2025, metric tons. Apparent consumption reflects the source import and export balance.
| Measure | 2025 value |
|---|---|
| Mine production | 0 t, USGS source zero |
| Natural graphite imports | 79,000 t |
| Natural graphite exports | 8,400 t |
| Apparent consumption | 71,000 t, rounded |
| Net import reliance | 100% |
Values and definitions are also readable in HTML. Source precision and scope apply.
USGS MCS 2026 Natural Graphite, U.S. salient statistics Original primary evidence
| Year | Mine production (t) | Imports (t) | Exports (t) | Apparent consumption (t) | Net import reliance (%) | Year status |
|---|---|---|---|---|---|---|
| 2021 | 0 | 53000 | 8660 | 44300 | 100 | Published history |
| 2022 | 0 | 89200 | 9500 | 79700 | 100 | Published history |
| 2023 | 0 | 73500 | 7780 | 65700 | 100 | Published history |
| 2024 | 0 | 73900 | 8740 | 65200 | 100 | Published history |
| 2025 | 0 | 79000 | 8400 | 71000 | 100 | Estimate |
The source’s net balance is imports minus exports. Using the two displayed 2025 trade figures gives 70,600 tons. USGS reports 71,000 in the apparent-consumption row. Retain its rounded reported total alongside the displayed calculation rather than considering the 400-ton difference an undocumented stock adjustment. The use of rounded values in each line explains why transparent arithmetic can differ slightly from a producer’s rounded headline.
The five-year table includes a source-reported zero mine output and 100% reliance in each of its years. Both values come from the series. They do not describe domestically manufactured synthetic material, recycling volume, the origin of imported finished batteries, or requirements at any particular facility. USGS separately notes that the quantity and value of recycled graphite were unavailable and gives examples of industrial recovery. The article does not fill in a recycling share or treat it as zero.
The U.S. chapter discusses proposed mining developments and spherical purified graphite activity. Proposed capacity, qualification work and active production have different meanings. The page can report zero domestic natural mine output while the country still has processing activity. A producer may refine imported natural material, or make another product from a different feedstock. Mine output measures extraction, not industrial activity across the complete supply chain.
Use imports for gross trade, exports for outward movement, and apparent consumption for the source's domestic balance. For a comparison with another mineral, inspect its source footnotes. For example, USGS defines apparent consumption for some other minerals with stock adjustments, while the graphite chapter gives an imports-minus-exports definition in its table. A cross-mineral ranking should preserve those definitions as part of the data.
Where do U.S. natural graphite imports come from?
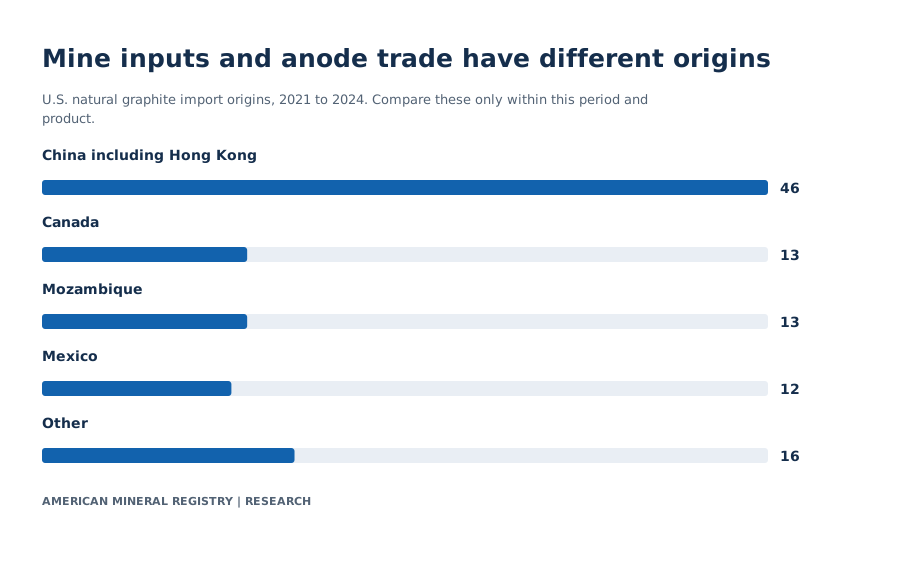
China including Hong Kong provided 46% of U.S. natural graphite imports for 2021 to 2024. Canada and Mozambique each supplied 13%, Mexico 12%, and the source's other group 16%. These shares refer to natural graphite imports over the stated four years. (USGS Natural Graphite, MCS 2026, Nov 2026).

View chart data
U.S. natural graphite import origins, 2021 to 2024. Compare these only within this period and product.
| Geography | Share (%) |
|---|---|
| China including Hong Kong | 46 |
| Canada | 13 |
| Mozambique | 13 |
| Mexico | 12 |
| Other | 16 |
Values and definitions are also readable in HTML. Source precision and scope apply.
USGS MCS 2026 Natural Graphite, Import Sources Original primary evidence
| Origin | 2021–2024 import share (%) |
|---|---|
| China including Hong Kong | 46 |
| Canada | 13 |
| Mozambique | 13 |
| Mexico | 12 |
| Other | 16 |
| Natural graphite import form | 2025 share (%) | Estimated U.S. import tonnes using displayed shares |
|---|---|---|
| Flake and high-purity | 73.4 | 57986 |
| Amorphous | 26.2 | 20698 |
| Lump and chip | 0.4 | 316 |
The origin shares describe a trade population. U.S. sourcing is more varied than a chart of world mining would suggest, but the two sets of shares cannot be directly subtracted to measure diversification. The origin group can depend on what product the import category counts, bilateral trading routes and timing. The global mine share describes extraction wherever it occurred. The U.S. pooled series describes where its imported natural graphite came from.
Import form is a separate dimension. For 2025 USGS estimates that 73.4% was flake and high-purity graphite, 26.2% amorphous and 0.4% lump and chip. The AMR form table multiplies each percentage by the displayed 79,000-ton aggregate. For example, 79,000 × 0.734 gives approximately 58,000 tons. The full computed value remains in the CSV so the arithmetic can be audited. It is a product of rounded inputs and carries their uncertainty, not an independently published tonnage precise to a single ton.
There is no complete joint table here linking each 2025 form to each supplying country. A reader who needs direct country-by-grade evidence should obtain trade entries for the relevant tariff code and year. Multiplying the pooled China percentage by the annual flake proportion would assume year and category alignment and independence that have not been established. The same warning applies when assigning country of origin to graphite already incorporated into batteries.
For an editorial comparison, keep the four-year origin shares together, then use the distinct 2025 form table to explain what type of natural material was imported. For supply chain due diligence, keep source country, manufacturing location, graphite type and product specification as separate fields. Publishing one of those fields does not settle the other three.
How much have battery anode imports changed?
U.S. imports of natural and synthetic graphite battery anode material rose from 28,100 to 43,400 metric tons, comparing January through August in 2024 and 2025. AMR calculates a 54.45% increase, using matched months and the same product boundary. (USGS Natural Graphite, MCS 2026, Nov 2026).

View chart data
U.S. January to August shipments, metric tons of natural and synthetic battery anode material combined.
| Period | Metric tons |
|---|---|
| Jan–Aug 2024 | 28100 |
| Jan–Aug 2025 | 43400 |
Values and definitions are also readable in HTML. Source precision and scope apply.
USGS MCS 2026 Natural Graphite, Events, Trends, and Issues Original primary evidence
| Period | 2024 imports (t) | 2025 imports (t) | AMR change (%) | Product |
|---|---|---|---|---|
| January to August | 28100 | 43400 | 54.4484 | Natural and synthetic battery anode material |
| Source | Jan–Aug 2025 share (%) |
|---|---|
| China | 55 |
| Indonesia | 31 |
| Republic of Korea | 14 |
| Product | Jan–Sep 2024 exports (t) | Jan–Sep 2025 exports (t) | AMR change (%) |
|---|---|---|---|
| Natural graphite | 109000 | 115000 | 5.5046 |
| Spherical purified graphite | 29100 | 37400 | 28.5223 |
USGS identifies China at 55%, Indonesia at 31% and the Republic of Korea at 14% for the 2025 anode material statistic. This is a different list and period from natural graphite imports. It includes synthetic anode material alongside natural anode material. The estimated 43,400 tons cannot be added to annual natural graphite imports or presented as exclusively natural material.
The growth calculation divides the increase of 15,300 tons by the 2024 eight-month base of 28,100. It is useful because the same months are observed in both years. Scaling the eight-month 2025 total to a full year would impose a timing assumption not established by the source. The article retains the original window rather than annualizing it.
USGS separately reports China’s exports of natural graphite and spherical purified graphite for the first nine months of 2024 and 2025. The first series moves from 109,000 to 115,000 tons. The spherical purified series moves from 29,100 to 37,400. Both are China exports rather than U.S. imports and both use a nine-month window rather than the eight months used for the U.S. anode statistic. Each can be compared with its own 2024 value. None establishes the quantity shipped to a specific U.S. company.
Spherical purification is a processing stage for natural material. Anode material has a specific manufacturing purpose and can include synthetic alternatives. A comparison of mine supply will miss refiners and processors, while a trade series on finished anode material will miss some types of upstream dependency. Use a data source for the decision's exact stage. A price or import figure for one grade is not a reliable stand-in for every product that contains graphite.
Where might graphite processing and anode output expand?
In the IEA’s 2035 base case for projects outside China, Africa shows 499.7 thousand tons of battery-grade-equivalent mining output. Europe shows 9 thousand at mining, 67 thousand at refining and 106 thousand contained in manufactured anodes. Output by stage can differ within a region. (IEA 2035 graphite stage estimates, Nov 2026).

View chart data
IEA 2035 base case outside China, selected regions, kt battery-grade graphite equivalent. Anode values measure contained spherical graphite.
| Region | Mining | Refining | Anodes |
|---|---|---|---|
| North America | 54 | 15 | 105 |
| Europe | 9 | 67 | 106 |
| Asia except top refiners | 30 | 335 | 305 |
| Africa | 499.7 | 0.0 | 0.0 |
Values and definitions are also readable in HTML. Source precision and scope apply.
IEA 2035 graphite project output, original CSV and notes Original primary evidence
| Region (outside China) | Modeled mining (kt battery-grade equivalent) | Modeled refining (kt battery-grade equivalent) | Contained in anodes (kt battery-grade equivalent) |
|---|---|---|---|
| North America | 54 | 15 | 105 |
| Central and South America | 65 | 0.0 | 8.5 |
| Europe | 9 | 67 | 106 |
| Asia except top refiners | 30 | 335 | 305 |
| Australia | 0 | 0.0 | 0.0 |
| Africa | 499.7 | 0.0 | 0.0 |
| Russia | 26 | 0.0 | 0.0 |
The IEA mining values are already adjusted for processing losses to a battery-grade equivalent. They differ from the USGS aggregate natural graphite mining series. The downstream values track spherical graphite contained in manufactured battery anodes. They do not measure the gross anode mass or the weight of a battery pack.
The Asia group outside the leading refiner records 30, 335 and 305 thousand tons across the three stages. North America records 54, 15 and 105. The relative levels are a way to identify how project pipelines vary by stage in the source scenario. They are not an input-output account for each region. It is possible for a region to refine more than it mines because it can import feedstock. It is also possible to manufacture more contained graphite than the local refining row if the product or network includes imports. The offered chart does not trace those routes.
The European and North American stage comparisons are especially useful for writers quoting announced downstream projects. Their modeled contained-anode production exceeds their own modeled mining row on the IEA equivalent basis. The differences should be described as stage comparisons, with the time and geographic scope. A claim that specific tonnage will be imported or that a processing bottleneck is proven would need evidence on matched throughput and trade.
The estimate assumes project development under the IEA’s identified base case for existing and announced projects. Read the report date and modeled target year separately. Earlier project announcements may not produce on schedule, and new supply chains may enter the estimate after a release. Any update to this comparison should preserve the original 2035 issue date, which locations were excluded as top refiners, and the producer's equivalent unit before comparing vintages.
How should this research be quoted?
Use the date and denominator beside the number. Attribute original measurements to their producers and AMR’s calculations or comparisons to American Mineral Registry. The specific finding controls below preserve those qualifications and link the exact evidence. A source-derived estimate is not a transaction price, a current operational reading or a forecast guarantee.
Frequently asked questions
What share of natural graphite did China mine in 2025?
USGS reports 82% in its prose. AMR divides the displayed mine figures, 1.4 million and 1.8 million tons, to obtain about 77.78%. Cite the basis you use. (USGS Natural Graphite, MCS 2026, Nov 2026).
Did the United States mine natural graphite in 2025?
The USGS reports zero. Its annual commodity account also reports 100% net import reliance for natural graphite. (USGS Natural Graphite, MCS 2026, Nov 2026).
Does 100% natural graphite reliance include synthetic graphite?
It describes the natural graphite balance printed by USGS. The separate anode trade excerpt includes both natural and synthetic product.
What is the difference between import origin and mine origin?
Import origin describes the source attributed in the stated trade series. Mine origin describes where mineral extraction occurred. A processed product can pass through additional jurisdictions.
Did U.S. anode imports rise by 54.45% for the whole year?
The comparison covers January to August of each year. The increase applies to those matched months. (USGS Natural Graphite, MCS 2026, Nov 2026).
Why can a region refine more graphite than it mines?
The IEA models different production networks for mining, refining and anodes. Feedstock can move between regions. The chart has no matched plant-flow data. (IEA 2035 graphite stage estimates, Nov 2026).
How should a published chart handle the revised 2024 total?
Show the source edition beside each 2024 value. For a year comparison, use the 2024 and 2025 figures available in the same release. (USGS Natural Graphite, MCS 2025, Nov 2026). (USGS Natural Graphite, MCS 2026, Nov 2026).
Where does this fit with the battery mineral reference?
The vehicle mineral benchmark measures material in a defined model. This source measures mine production, trade and separate stage output. Read the scopes before combining figures.
Methodology and Sources
The 2026 USGS natural graphite PDF was checked against its displayed p. 1 U.S. salient statistics, import sources, product composition and trade paragraphs, and p. 2 world mine production table and footnotes. The earlier 2024 estimates are from p. 2 of the 2025 edition. The source convention explicitly identifies a dash as zero in the production table. No reserve dashes or included-in-total footnotes are turned into supply observations. The same named mine rows are aligned across vintages using USGS names normalized for readability.
AMR computes the China mine share from the reported 1.4 million and 1.8 million tons. The 82% narrative is retained in a separate row. Historical revisions subtract the earlier 2024 estimate from the later estimate for the same year. Import volumes by form apply the displayed percentages to the displayed 2025 total. U.S. anode import and China export changes compare matched periods, each divided by its own earlier period. No joint origin-and-grade panel is inferred.
IEA stage data are copied from the chart's native public CSV and its notes from the 2026 Critical Minerals Outlook. The complete seven-region grid is normalized by stage and retains the case and metric stated by IEA. Values from that panel do not enter historical rankings or year-over-year comparisons. Reproduction checks work from the provided CSVs.
Glossary
- Natural graphite. Graphite sourced from naturally occurring mineral material.
- Synthetic graphite. Manufactured graphite from a distinct production pathway.
- Flake and high purity. A combined grouping in the USGS 2025 import form breakdown.
- Spherical purified graphite. A processed material distinct from gross natural graphite mine output.
- Anode material. An input used to make a negative battery electrode.
- Battery-grade equivalent. The IEA's unit for the 2035 graphite stage model.
- Apparent consumption. A source-defined domestic material balance.
- Vintage. The publication edition that produced a value for a given year.
Sources
- USGS MCS 2026 Natural Graphite. Pages 1–2, domestic balance, grade mix, natural graphite origins, matched anode/processed trade and country mine table.
- USGS MCS 2025 Natural Graphite. Page 2 earlier 2024 mine estimates.
- IEA 2026 graphite project estimates. Offered 2035 base-case stage values and battery-grade equivalent notes.