Key Takeaways
- In the USGS series, nickel mine output grew from 3.71 million tons in 2024 to 3.90 million in 2025. Indonesia added about 290,000 tons while output declined in the Philippines and Australia.
- IEA historical estimates show that Indonesian nickel mining grew by 1,532 kilotons from 2021 to 2025. The world grew by 1,437 kilotons. AMR calculates a contribution of 106.61% of world net growth as the combined output of all other locations fell by 95 kilotons.
- Nickel supply changes hands and form. The IEA reports that China accounted for 75% of nickel sulphate production in its 2026 review, versus 10% for Indonesia. The IEA counts more products in its broader refining series.
- The IEA attributed 625 of 3,532 kilotons of 2025 global nickel demand to clean energy, a calculated 17.70%. U.S. net import reliance was 41% on the USGS measure that includes scrap.
Where is nickel mined?
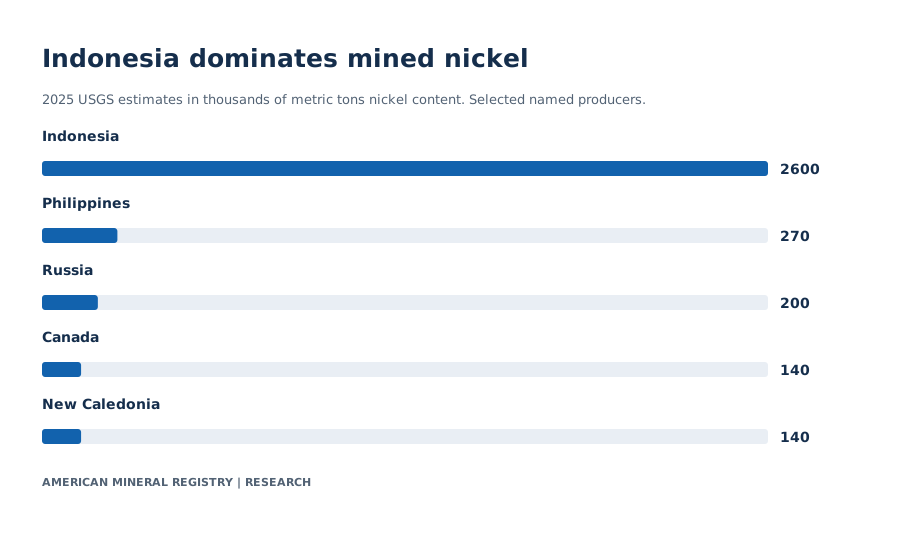
USGS estimated that Indonesia mined 2.60 million metric tons of contained nickel in 2025, followed by the Philippines at 270,000 and Russia at 200,000. Those are the top three named producers in that edition. The aggregate other-countries row represents many producers and stays outside the country ranking. Canada and New Caledonia each show 140,000 tons in the rounded estimates. (USGS Nickel, p. 2)

View chart data
2025 USGS estimates in thousands of metric tons nickel content. Selected named producers.
| Producer | kt Ni |
|---|---|
| Indonesia | 2600 |
| Philippines | 270 |
| Russia | 200 |
| Canada | 140 |
| New Caledonia | 140 |
Values and definitions are also readable in HTML. Source precision and scope apply.
USGS Nickel world mine table, p. 2 Original primary evidence
| Country or group | 2024 output (t Ni) | 2025 estimate (t Ni) | AMR change (%) | 2025 share of rounded global total (%) |
|---|---|---|---|---|
| Indonesia | 2310000 | 2600000 | 12.5541 | 66.6667 |
| Other countries | 308000 | 290000 | -5.8442 | 7.4359 |
| Philippines | 354000 | 270000 | -23.7288 | 6.9231 |
| Russia | 205000 | 200000 | -2.4390 | 5.1282 |
| Canada | 125000 | 140000 | 12.0000 | 3.5897 |
| New Caledonia | 116000 | 140000 | 20.6897 | 3.5897 |
| China | 115000 | 120000 | 4.3478 | 3.0769 |
| Brazil | 67500 | 70000 | 3.7037 | 1.7949 |
| Australia | 98000 | 45000 | -54.0816 | 1.1538 |
| United States | 7490 | 10000 | 33.5113 | 0.2564 |
| World total (rounded) | 3710000 | 3900000 | 5.1213 | 100.0000 |
USGS flags China’s 2024 country value as an estimate in the mine table. The tonnage measures contained nickel. A tonne of mined material or concentrate can contain far less than one tonne of nickel. Ore-grade, moisture, shipment weight and recoverable nickel are separate quantities. The published world total has independent rounding. Summing the displayed country and residual rows can therefore give a slightly different value. A share calculated from the published world total is a rounded estimate.
The same 2026 edition puts Indonesia’s 2024 mine output at 2.31 million tons. Against its 2024 world denominator of 3.71 million tons, Indonesia’s share was about 62.26%. The year-on-year increase to 66.67% is about 4.40 percentage points. It combines a larger numerator and a larger world denominator. Contributions from countries whose mine output fell are visible alongside Indonesian growth.
What changed when USGS revised its 2024 estimates?
An estimate for one year can change in the next publication. The 2025 edition reported a world estimate of 3.70 million tons for 2024. The 2026 edition put the same year at 3.71 million. Indonesia’s estimate changed from 2.20 to 2.31 million tons, while Canada’s went from 190,000 to 125,000 tons. A small revision in the global total can mask much larger changes in individual rows. USGS attributes its significant Canadian revision to updated government reporting. (2025 edition, p. 2, 2026 edition, p. 2)
| Country or group | 2024 in MCS 2025 (t Ni) | 2024 in MCS 2026 (t Ni) | AMR difference (t Ni) | AMR revision (%) |
|---|---|---|---|---|
| United States | 8000 | 7490 | -510 | -6.3750 |
| Australia | 110000 | 98000 | -12000 | -10.9091 |
| Brazil | 77000 | 67500 | -9500 | -12.3377 |
| Canada | 190000 | 125000 | -65000 | -34.2105 |
| China | 120000 | 115000 | -5000 | -4.1667 |
| Indonesia | 2200000 | 2310000 | 110000 | 5.0000 |
| New Caledonia | 110000 | 116000 | 6000 | 5.4545 |
| Philippines | 330000 | 354000 | 24000 | 7.2727 |
| Russia | 210000 | 205000 | -5000 | -2.3810 |
| Other countries | 300000 | 308000 | 8000 | 2.6667 |
| World total (rounded) | 3700000 | 3710000 | 10000 | 0.2703 |
Use a single edition to compare years when it supplies both. Use two editions when the subject is a revision. If a chart imports the first 2024 estimate and the latest 2025 estimate, it incorporates both changes and can misrepresent the change in mine activity. This matters more for a country such as Canada than for the rounded world total.
How much nickel does Indonesia refine?
In the IEA’s 2025 historical estimates, Indonesia produced 1,681 of 3,729 kilotons of refined nickel, or 45.08%. China had 1,160 kilotons, or about 31.1% of the same total. Together they accounted for roughly three quarters of that stage. The mining comparison uses Indonesia’s 2,637 kilotons and a world mine denominator of 4,207. A country can play very different roles in the two stages without any change in where the ore originated. (IEA Nickel supply table, p. 354)

View chart data
IEA 2025 mining and refining shares versus the IEA report’s separate nickel sulphate snapshot for Indonesia. Bar tracks run from 0% to 100%.
| Stage | Share (%) |
|---|---|
| Mining | 62.68 |
| Refining | 45.08 |
| Nickel sulphate | 10 |
Values and definitions are also readable in HTML. Source precision and scope apply.
IEA 2026 Nickel supply, p. 354 Original primary evidence · IEA nickel sulphate snapshot, p. 151
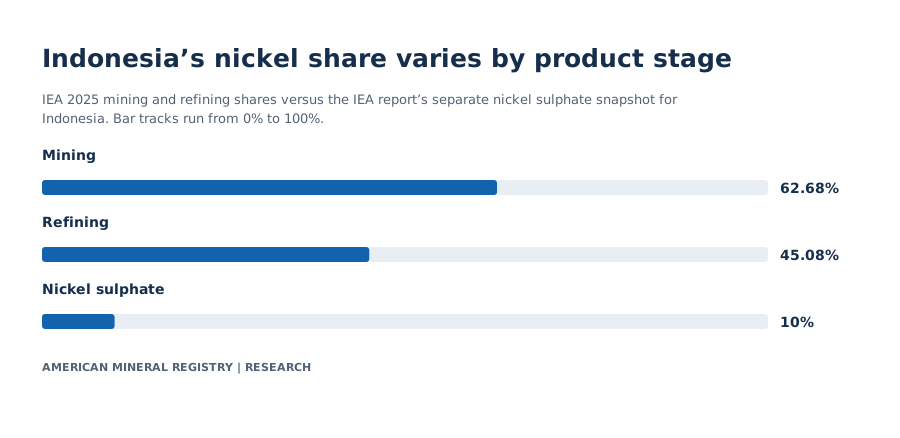
The IEA counts final products including nickel metal, oxide, nickel pig iron, ferronickel and sulphate as refining output, while excluding outputs from intermediate steps. Products used in stainless steel and batteries can therefore appear in the same refining total. For a battery ingredient question, use the series for the specified chemical or product. Page 151 of the IEA report identifies China at 75% and Indonesia at 10% in its narrower nickel sulphate snapshot. This page provides a separate product comparison and does not label those two shares as its Annex’s annual 2025 series. (IEA Nickel chapter, p. 151)
What is the difference between nickel pig iron, matte and sulphate?
Nickel pig iron and ferronickel are iron-bearing products used mainly in stainless steel. Nickel matte and mixed hydroxide precipitate are intermediate products that can move between producers and further processing steps. Nickel sulphate is a narrower chemical product used in the battery materials chain. Trade in ore, intermediate products or finished sulphate answers a different question in each case. A tonne of one product is not a tonne of contained nickel unless the producer reports it on that basis.
A miner may ship to a refiner in another country. A refiner making a final alloy input and a company making battery-grade sulphate may buy different categories of feed. Country of mine origin therefore says little about the number of qualified suppliers at later stages. The IEA industry description documents both stainless-oriented processing and routes through intermediates to downstream battery products. (IEA Nickel chapter, pp. 150 to 151)
How much of the growth came from Indonesia?
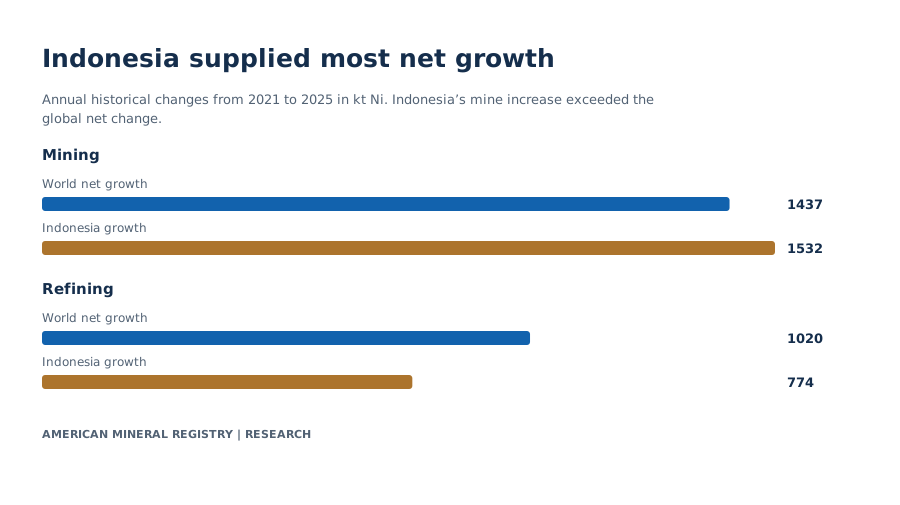
In IEA data, Indonesia supplied 1,532 kilotons of the 1,437-kiloton net increase in world mine output from 2021 to 2025. World output outside Indonesia, calculated by subtracting Indonesia from the world value at each endpoint, went from 1,665 to 1,570 kilotons. Indonesia’s mining increase exceeded world net growth because that combined series fell. This is a useful way to show how quickly supply shifted across locations. (IEA Nickel supply, p. 354)

View chart data
Annual historical changes from 2021 to 2025 in kt Ni. Indonesia’s mine increase exceeded the global net change.
| Stage | World net growth | Indonesia growth |
|---|---|---|
| Mining | 1437 | 1532 |
| Refining | 1020 | 774 |
Values and definitions are also readable in HTML. Source precision and scope apply.
| IEA stage | World 2021 (kt Ni) | World 2025 (kt Ni) | World change (kt Ni) | Indonesia 2021 (kt Ni) | Indonesia 2025 (kt Ni) | Indonesia change (kt Ni) | Other locations net change (kt Ni) | AMR Indonesia share of net growth (%) |
|---|---|---|---|---|---|---|---|---|
| Mining | 2770 | 4207 | 1437 | 1105 | 2637 | 1532 | -95 | 106.6110 |
| Refining | 2709 | 3729 | 1020 | 907 | 1681 | 774 | 246 | 75.8824 |
The same calculation gives 75.88% for Indonesia’s share of net refining growth. That country added 774 kilotons out of a world increase of 1,020. Refining outside Indonesia increased by 246 kilotons. This comparison captures a change over time, whereas the 45.08% figure describes Indonesia’s share of refining in one year.
| Country or group | 2021 history (kt Ni) | 2025 history (kt Ni) | 2030 base case (kt Ni) | 2040 base case (kt Ni) |
|---|---|---|---|---|
| Indonesia | 1105 | 2637 | 3567 | 3568 |
| Philippines | 476 | 482 | 308 | 308 |
| Russia | 205 | 192 | 218 | 218 |
| China | 108 | 147 | 161 | 152 |
| New Caledonia | 186 | 138 | 207 | 207 |
| Canada | 134 | 138 | 147 | 52 |
| Brazil | 76 | 85 | 82 | 82 |
| Rest of world | 480 | 388 | 408 | 271 |
| World | 2770 | 4207 | 5098 | 4858 |
| Country or group | 2021 history (kt Ni) | 2025 history (kt Ni) | 2030 base case (kt Ni) | 2040 base case (kt Ni) |
|---|---|---|---|---|
| Indonesia | 907 | 1681 | 2080 | 2081 |
| China | 746 | 1160 | 1194 | 1194 |
| Canada | 113 | 125 | 134 | 90 |
| Russia | 121 | 123 | 142 | 142 |
| Japan | 128 | 108 | 107 | 107 |
| Norway | 91 | 100 | 92 | 92 |
| Brazil | 61 | 64 | 73 | 65 |
| Rest of world | 541 | 367 | 409 | 387 |
| World | 2709 | 3729 | 4231 | 4159 |
The two supply tables also give the IEA base case for 2030 and 2040. Mining and refining country sets differ because the larger producers differ. The global mine base case rises to 5,098 kilotons in 2030 and shows 4,858 in 2040. The IEA puts the top three producers at 79% of mine output and 80% of refining in 2025, increasing to 84% and 82% respectively in the 2040 base case. Use these as outcomes under the report’s project assumptions. They describe what was captured in its project pipeline at the time of publication.
| Period and status | IEA top three mine producers (%) | IEA top three refining producers (%) |
|---|---|---|
| 2021 history | 65 | 66 |
| 2025 history | 79 | 80 |
| 2030 base case | 80 | 81 |
| 2040 base case | 84 | 82 |
Why do IEA and USGS estimates disagree?
For 2025 the IEA reports a world mine estimate of 4,207 kilotons and USGS reports a rounded 3,900 kilotons. The two estimates also differ in their country values, most visibly for the Philippines at 482 kilotons in the IEA table and 270 kilotons in the USGS table. This comparison preserves each publisher’s own estimates. The tables alone do not establish a cause or an adjustment to move between them.
| Country or group | USGS 2025 estimate (kt Ni) | IEA 2025 historical estimate (kt Ni) | Difference in displayed estimates (kt Ni) |
|---|---|---|---|
| World total (rounded) | 3900 | 4207 | 307 |
| Indonesia | 2600 | 2637 | 37 |
| Philippines | 270 | 482 | 212 |
| China | 120 | 147 | 27 |
| New Caledonia | 140 | 138 | -2 |
| Canada | 140 | 138 | -2 |
| Brazil | 70 | 85 | 15 |
| Russia | 200 | 192 | -8 |
For an AMR concentration comparison across stages, both numerator and denominator therefore come from the same IEA annex. For a long USGS series, continue to use the USGS chapter and its revisions. A ratio using an IEA Indonesian estimate and a USGS world total would fall outside both methods.
How much nickel demand comes from EVs and clean energy?
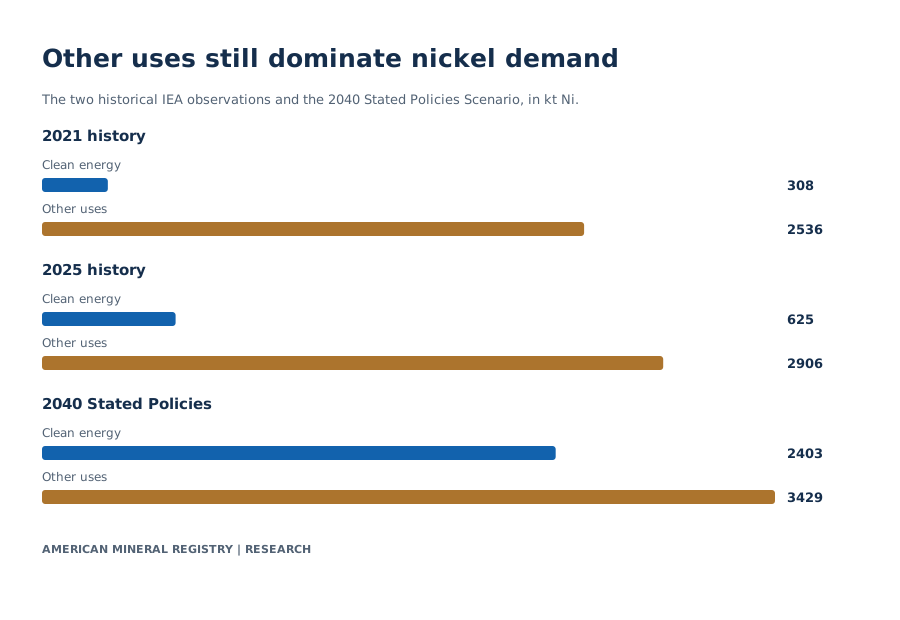
The IEA reports global nickel demand of 3,532 kilotons in 2025. Clean energy accounted for 625 kilotons, including 439 for electric vehicles, 28 for battery storage and 159 for other clean energy uses. Component values and subtotals can differ by a kiloton after rounding. The source reports an 18% clean energy share and the printed tonnages give 17.70%. EVs alone represented about 12.43% of the world total. (IEA Nickel demand, p. 353)

View chart data
The two historical IEA observations and the 2040 Stated Policies Scenario, in kt Ni.
| Year and status | Clean energy | Other uses |
|---|---|---|
| 2021 history | 308 | 2536 |
| 2025 history | 625 | 2906 |
| 2040 Stated Policies | 2403 | 3429 |
Values and definitions are also readable in HTML. Source precision and scope apply.
| Observation or scenario | Clean energy (kt Ni) | EVs (kt Ni) | Battery storage (kt Ni) | Other clean energy (kt Ni) | Other uses (kt Ni) | Total demand (kt Ni) | Published clean energy share (%) |
|---|---|---|---|---|---|---|---|
| 2021 history | 308 | 222 | 9 | 77 | 2536 | 2845 | 11 |
| 2025 history | 625 | 439 | 28 | 159 | 2906 | 3532 | 18 |
| 2030 Current Policies | 1276 | 909 | 59 | 308 | 3055 | 4331 | 29 |
| 2040 Current Policies | 1932 | 1449 | 160 | 323 | 3429 | 5361 | 36 |
| 2050 Current Policies | 2051 | 1448 | 305 | 297 | 3746 | 5797 | 35 |
| 2030 Stated Policies | 1409 | 989 | 71 | 348 | 3055 | 4464 | 32 |
| 2040 Stated Policies | 2403 | 1851 | 199 | 353 | 3429 | 5832 | 41 |
| 2050 Stated Policies | 2763 | 2054 | 382 | 326 | 3746 | 6509 | 42 |
| 2030 High Demand | 1698 | 1119 | 92 | 486 | 3100 | 4799 | 35 |
| 2040 High Demand | 3253 | 2500 | 264 | 488 | 3270 | 6523 | 50 |
| 2050 High Demand | 3963 | 2839 | 512 | 611 | 3375 | 7338 | 54 |
Adding EVs, battery storage or the other clean energy line to the clean energy subtotal counts the same demand twice. Another easy error is assigning all non-clean-energy demand to stainless steel. The IEA groups those uses together. The USGS separately reports that stainless and alloy steels and nickel-containing alloys typically account for more than 85% of U.S. domestic consumption. That group covers several uses and has a U.S. denominator. (USGS Nickel, p. 1)
The 2040 Current Policies and Stated Policies scenarios give 5,361 and 5,832 kilotons of total demand, while the 2040 High Demand case gives 6,523. The corresponding clean energy quantities are 1,932, 2,403 and 3,253 kilotons. Compare like years across scenarios to see the range implied by different assumptions. Different battery chemistries, vehicle trajectories and industrial demand can change which part of the value chain grows fastest.
How reliant is the United States on imported nickel?
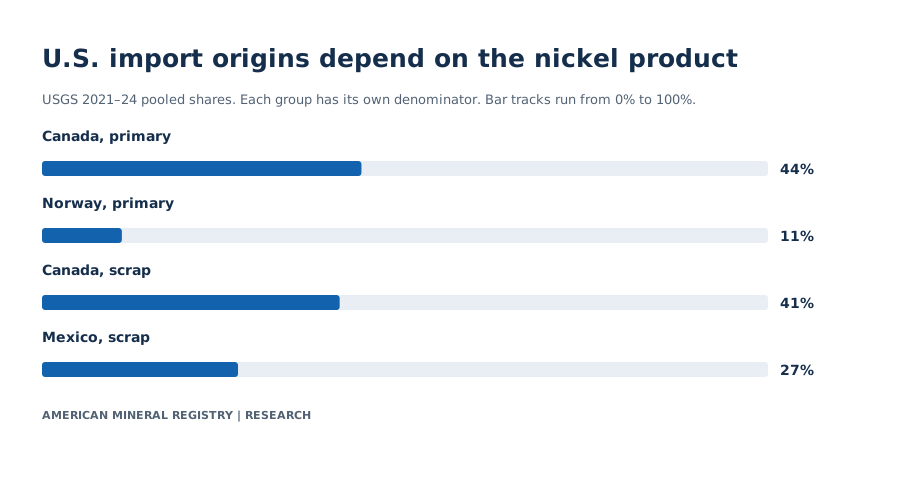
USGS estimates 41% net import reliance for 2025, including the nickel contained in stainless steel and alloy scrap. The report notes that excluding scrap would put reliance near 100%. The country produced about 10,000 tons of nickel in mine concentrate in 2025 and USGS explains that concentrate went to smelters in Canada and overseas. The domestic mine tonnes alone cannot substitute for figures on domestic deliveries of refined nickel. (USGS Nickel, pp. 1 to 2)

View chart data
USGS 2021–24 pooled shares. Each group has its own denominator. Bar tracks run from 0% to 100%.
| Origin and product | Share (%) |
|---|---|
| Canada, primary | 44 |
| Norway, primary | 11 |
| Canada, scrap | 41 |
| Mexico, scrap | 27 |
Values and definitions are also readable in HTML. Source precision and scope apply.
| Import product | Origin | 2021–2024 pooled import share (%) |
|---|---|---|
| Primary nickel | Canada | 44 |
| Primary nickel | Norway | 11 |
| Primary nickel | Australia | 8 |
| Primary nickel | Brazil | 7 |
| Primary nickel | Other | 30 |
| Nickel-containing scrap | Canada | 41 |
| Nickel-containing scrap | Mexico | 27 |
| Nickel-containing scrap | United Kingdom | 9 |
| Nickel-containing scrap | Other | 23 |
| Year and status | Mine production (t Ni) | Byproduct refinery production (t Ni) | Ore/concentrate imports (t Ni) | Primary imports (t Ni) | Secondary imports (t Ni) | Ore/concentrate exports (t Ni) | Primary exports (t Ni) | Secondary exports (t Ni) | Reported primary use (t Ni) | Purchased scrap (t Ni) | Apparent primary use (t Ni) | Apparent total use (t Ni) | Consumer stocks (t Ni) | U.S. LME warehouse stocks (t Ni) |
|---|---|---|---|---|---|---|---|---|---|---|---|---|---|---|
| 2021 | 18400 | W | 18 | 108000 | 34400 | 14900 | 11600 | 29200 | 92100 | 156000 | 97500 | 254000 | 25100 | 1296 |
| 2022 | 17500 | W | Less than 0.5 | 127000 | 37300 | 15200 | 11100 | 44400 | 96700 | 153000 | 117000 | 270000 | 23200 | 6 |
| 2023 | 16400 | W | 4 | 112000 | 39600 | 9100 | 12200 | 57200 | 107000 | 140000 | 98500 | 238000 | 25700 | 1506 |
| 2024 | 7490 | W | 12 | 105000 | 40000 | 5630 | 15900 | 46900 | 114000 | 121000 | 90300 | 211000 | 25500 | 258 |
| 2025 estimate | 10000 | W | 20 | 100000 | 45000 | 11000 | 9800 | 35200 | 120000 | 130000 | 90000 | 220000 | 25000 | 110 |
USGS estimates 90,000 tons of apparent primary use and 220,000 tons of total apparent use for 2025. Purchased secondary scrap was 130,000 tons. The latter two displayed values give about 59% and USGS describes scrap as approximately 60% of apparent consumption. A scrap flow is use of existing nickel in products and waste. It does not create another tonne of newly mined nickel. The metal in stainless steel scrap can remain in steel and alloy applications, so the scrap share does not measure recovery into battery products.
The U.S. estimates distinguish reported primary use from apparent primary consumption. Reported consumption and a balance computed from trade and stock movement serve different purposes. USGS defines apparent primary consumption as primary imports less primary exports with an industry stocks adjustment. It adds reported secondary consumption for total apparent consumption. For 2025 the agency’s 100,000 tons of primary imports and 9,800 tons of primary exports are near 90,000 tons when subtracted, but the agency’s definition and rounded output govern the stated measure. The byproduct refinery line remains withheld in the USGS release.
What do the nickel price and surplus series measure?
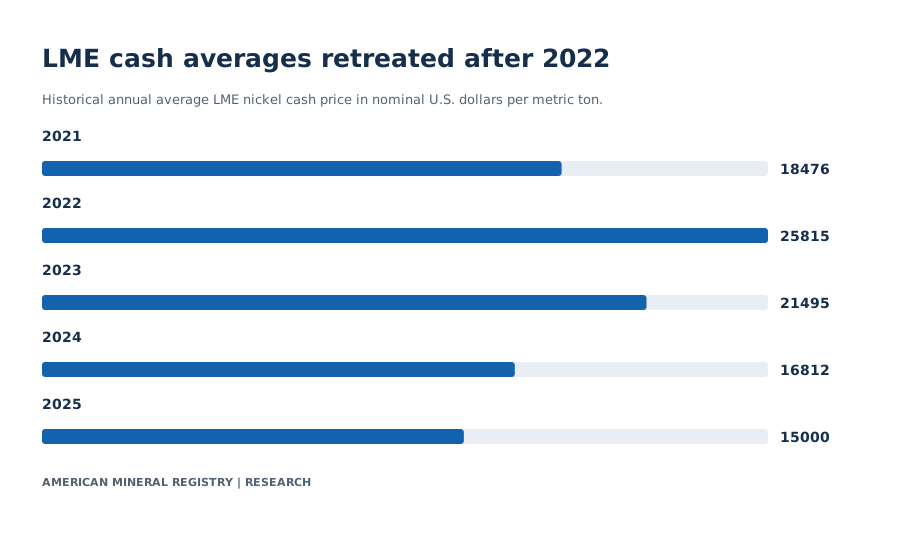
The annual average London Metal Exchange cash price in the USGS table went from $25,815 per metric ton in 2022 to an estimated $15,000 per metric ton in 2025. It measures a benchmark price in nominal U.S. dollars and does not measure the cost of mining, the negotiated price of an intermediate, or the price of the sulphate input used in a battery. It is also separate from the annual U.S. stock observations. (USGS Nickel, p. 1)

View chart data
Historical annual average LME nickel cash price in nominal U.S. dollars per metric ton.
| Year | USD/t Ni |
|---|---|
| 2021 | 18476 |
| 2022 | 25815 |
| 2023 | 21495 |
| 2024 | 16812 |
| 2025 | 15000 |
Values and definitions are also readable in HTML. Source precision and scope apply.
| Year and status | USGS net import reliance (%) | LME cash annual average (USD/t Ni) | LME cash annual average (USD/lb Ni) |
|---|---|---|---|
| 2021 | 38 | 18476 | 8.38 |
| 2022 | 43 | 25815 | 11.71 |
| 2023 | 41 | 21495 | 9.75 |
| 2024 | 43 | 16812 | 7.63 |
| 2025 estimate | 41 | 15000 | 6.90 |
USGS cites the International Nickel Study Group for a global primary nickel surplus of 182,000 tons in full-year 2024 and 189,000 tons in the first nine months of 2025. For a matched first-nine-month comparison, the report gives 107,000 tons in 2024. A primary market surplus describes a production and consumption balance. A lower price can coexist with increasing mine concentration and a different balance in an individual product. Comparing the same calendar span and product series helps distinguish these issues.
Frequently asked questions
How much nickel was mined worldwide in 2025?
USGS estimated 3.90 million metric tons of nickel content. The IEA estimates 4.207 million for the same year in its own historical series. Choose the source that matches the rest of the comparison and state the edition and quantity.
Is China the biggest nickel producer?
The answer depends on the product. Indonesia leads the broad mining and refining figures in the IEA’s 2025 tables. The IEA separately identifies China as the largest producer of nickel sulphate in its 2026 report. Mine production is defined by location of extraction. A downstream product’s production is defined by where that product is made.
Why can one country account for more than 100% of mining growth?
The percentage compares an increase within one country with the change across the world. The denominator is the sum of the national changes. Other countries’ negative contributions can shrink that denominator. Both levels of actual world production remain larger than the single national level.
What is a useful distinction between nickel demand and apparent use?
The IEA’s demand estimates group uses across the world and show scenarios. USGS’s apparent domestic use is an accounting measure built from selected trade, stock and scrap inputs. Either can answer a well-defined question about consumption. Use its own year, geography and category.
Is a nickel resource estimate available supply?
Resources describe in-ground quantities under the source’s classification. Reserves use more specific economic and technical criteria. An annual production total measures flow. A mine can have substantial resources with no proved annual output on a given date. For availability or concentration, cite the flow in the relevant stage and period.
Which nickel statistic belongs in a story about battery suppliers?
Use the IEA nickel sulphate concentration with the source’s product boundary if the story is about that chemical. Use the EV and storage demand rows if the story concerns end use. A global mine share describes exposure earlier in the chain and offers complementary context. AMR’s EV battery mineral chemistry statistics distinguish nickel-bearing cathodes from phosphate chemistries. The lithium mine supply statistics cover a different battery ingredient.
Methodology and Sources
USGS 2026 statistics use metric tons of contained nickel unless the displayed label specifies dollars per pound, percentages or another unit. IEA Annex p. 353 demand and p. 354 supply use kilotons, each equal to 1,000 metric tons. The data files preserve named and residual groups, original rounding, U.S. withholding and the less-than-half-unit flag. The same-year revision table subtracts the 2025-edition 2024 value from the 2026-edition 2024 value and divides by the older value for percent change. USGS’s 2025 output is an estimate. IEA labels its 2025 Annex values historical, and future values remain model and case figures.
AMR computes shares by dividing a row’s stated numerator by its stated denominator. Net growth is the difference of two annual values, with non-Indonesian change equal to world change less Indonesian change. Each citation links to the precise PDF page. Rounded percentages in prose are calculated from displayed input quantities. The IEA notes explain the coverage of refining and the relationship between categories in the demand table. The downloadable source ledger maps all table rows to original sources, and the reproduction program can recompute the anchored findings from the supplied CSVs.
Glossary
- Contained nickel. Nickel in a material measured by its nickel mass. A measure of ore, concentrate or product weight can be larger.
- Nickel refining. The finished product stage defined by each dataset. The IEA broad supply series includes products for several end uses.
- Nickel sulphate. A specific nickel-bearing chemical used in the battery supply chain. Its producers can differ from producers of other nickel products.
- Nickel pig iron. An iron and nickel alloy input used principally in stainless steel.
- Mixed hydroxide precipitate. A nickel-bearing intermediate sent for additional processing.
- Apparent use. An accounting measure of consumption using available supply, trade and stock or scrap data as defined by the source.
- Percentage point. The difference between two percentages, such as 62.68% and 45.08%.
Sources
- USGS Mineral Commodity Summaries 2026, Nickel. Page 1 supplies domestic measures, prices and origin shares. Page 2 supplies world mine estimates, revisions and footnotes.
- USGS Mineral Commodity Summaries 2025, Nickel, p. 2. Original 2024 mine estimates.
- IEA Global Critical Minerals Outlook 2026, Nickel demand, p. 353. Historical and modeled sector demand in kt Ni.
- IEA Global Critical Minerals Outlook 2026, Nickel supply, p. 354. Observed historical estimates, base case supply and definitions.
- IEA Global Critical Minerals Outlook 2026, Nickel chapter, p. 151. Nickel sulphate and intermediate-product boundaries.
- USGS Nickel, p. 1. Domestic trade, consumption, price and stocks.
- USGS Nickel, p. 2. Mine rows and domestic reliance footnotes.
- IEA Nickel processing, p. 150. Product routes and uses.