Research list
Top Oil Producing States in 2025: All 32 Ranked, With Natural Gas
The top oil producing states in 2025 were Texas, New Mexico and North Dakota. With the federal offshore, they produced 81 percent of U.S. crude oil, and Texas alone produced 42 percent. Here is every producing state ranked from EIA’s figures, with natural gas alongside.
Where to look first
Oil production in the United States is concentrated: the top three states and the federal offshore produced 81.1% of the nation’s crude in 2025. The full ranking of all 32 states, and the natural gas ranking, follow the top ten.
| Question | Answer |
|---|---|
| Which state produces the most oil? | Texas, with 42.2% of U.S. crude in 2025 |
| Which states come next? | New Mexico (16.1%) and North Dakota (8.6%) |
| How much comes from the federal offshore? | 708.8 million barrels in the Gulf of America, 14.2% of the U.S. total, counted apart from any state |
| Which state produces the most natural gas? | Texas, then Pennsylvania and New Mexico |
| How many states produce oil? | 32 states report crude oil production to EIA, and 16 report natural gas |
How we checked
Every figure is from the U.S. Energy Information Administration’s state production tables released on September 30, 2026 and read on October 1, 2026: crude oil field production in thousand barrels and natural gas marketed production in million cubic feet, shown here in millions of barrels and billions of cubic feet. EIA notes that its state figures are estimates that can differ from what state agencies publish.
Federal offshore production in the Gulf of America is counted apart from any state, as EIA counts it. The same data, with series identifiers, is in AMR’s oil and gas production by state and its CSV.
1. Texas, 42.2% of U.S. crude
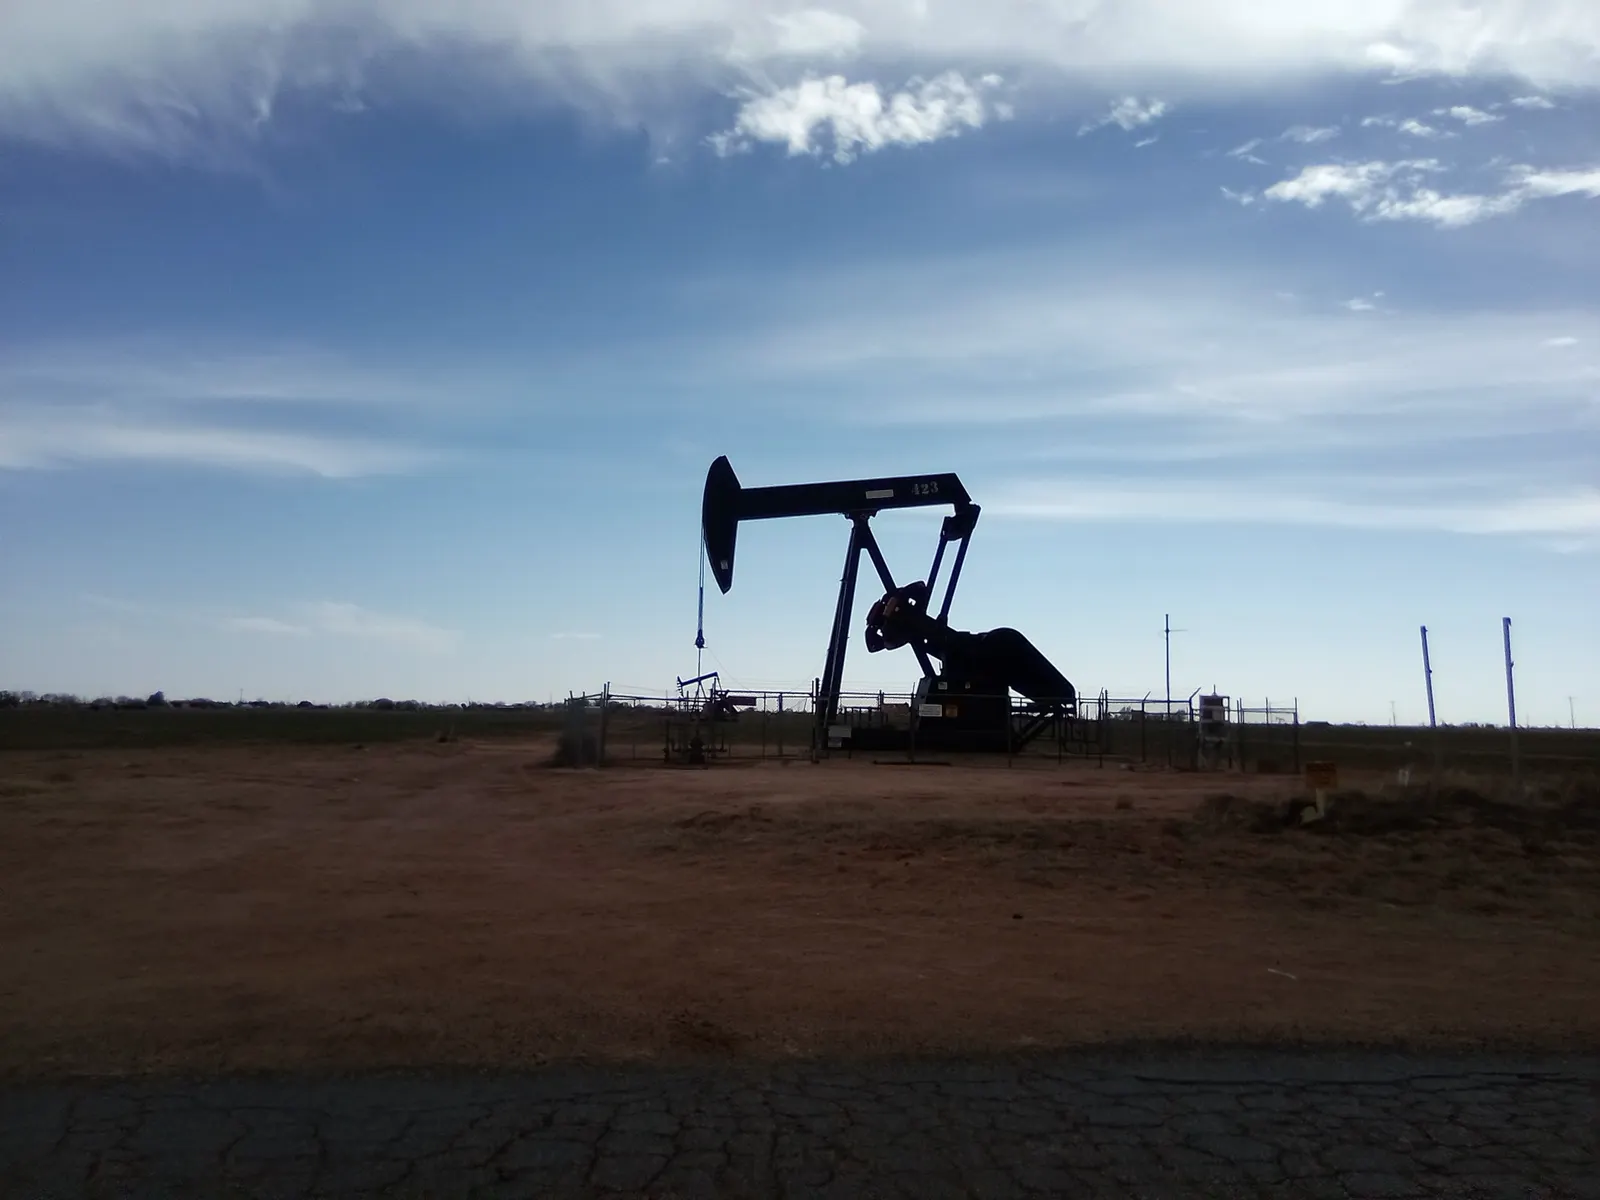
Texas produced 2,102.6 million barrels of crude oil in 2025, 42.2% of the U.S. total and up 1.2% from 2024.
- Crude oil, 2025
- 2,102.6 million barrels
- Share of U.S. crude
- 42.2%
- Natural gas, 2025
- 12,657 billion cubic feet, number 1 among states
- Change from 2024
- +1.2%
Most of its oil comes from the Permian Basin in West Texas, the Eagle Ford in South Texas and the Haynesville in East Texas.
How Texas treats unused mineral interests, and the statute, is on AMR’s Texas mineral rights page.
EIA, crude oil production by state, released September 30, 2026
2. New Mexico, 16.1% of U.S. crude
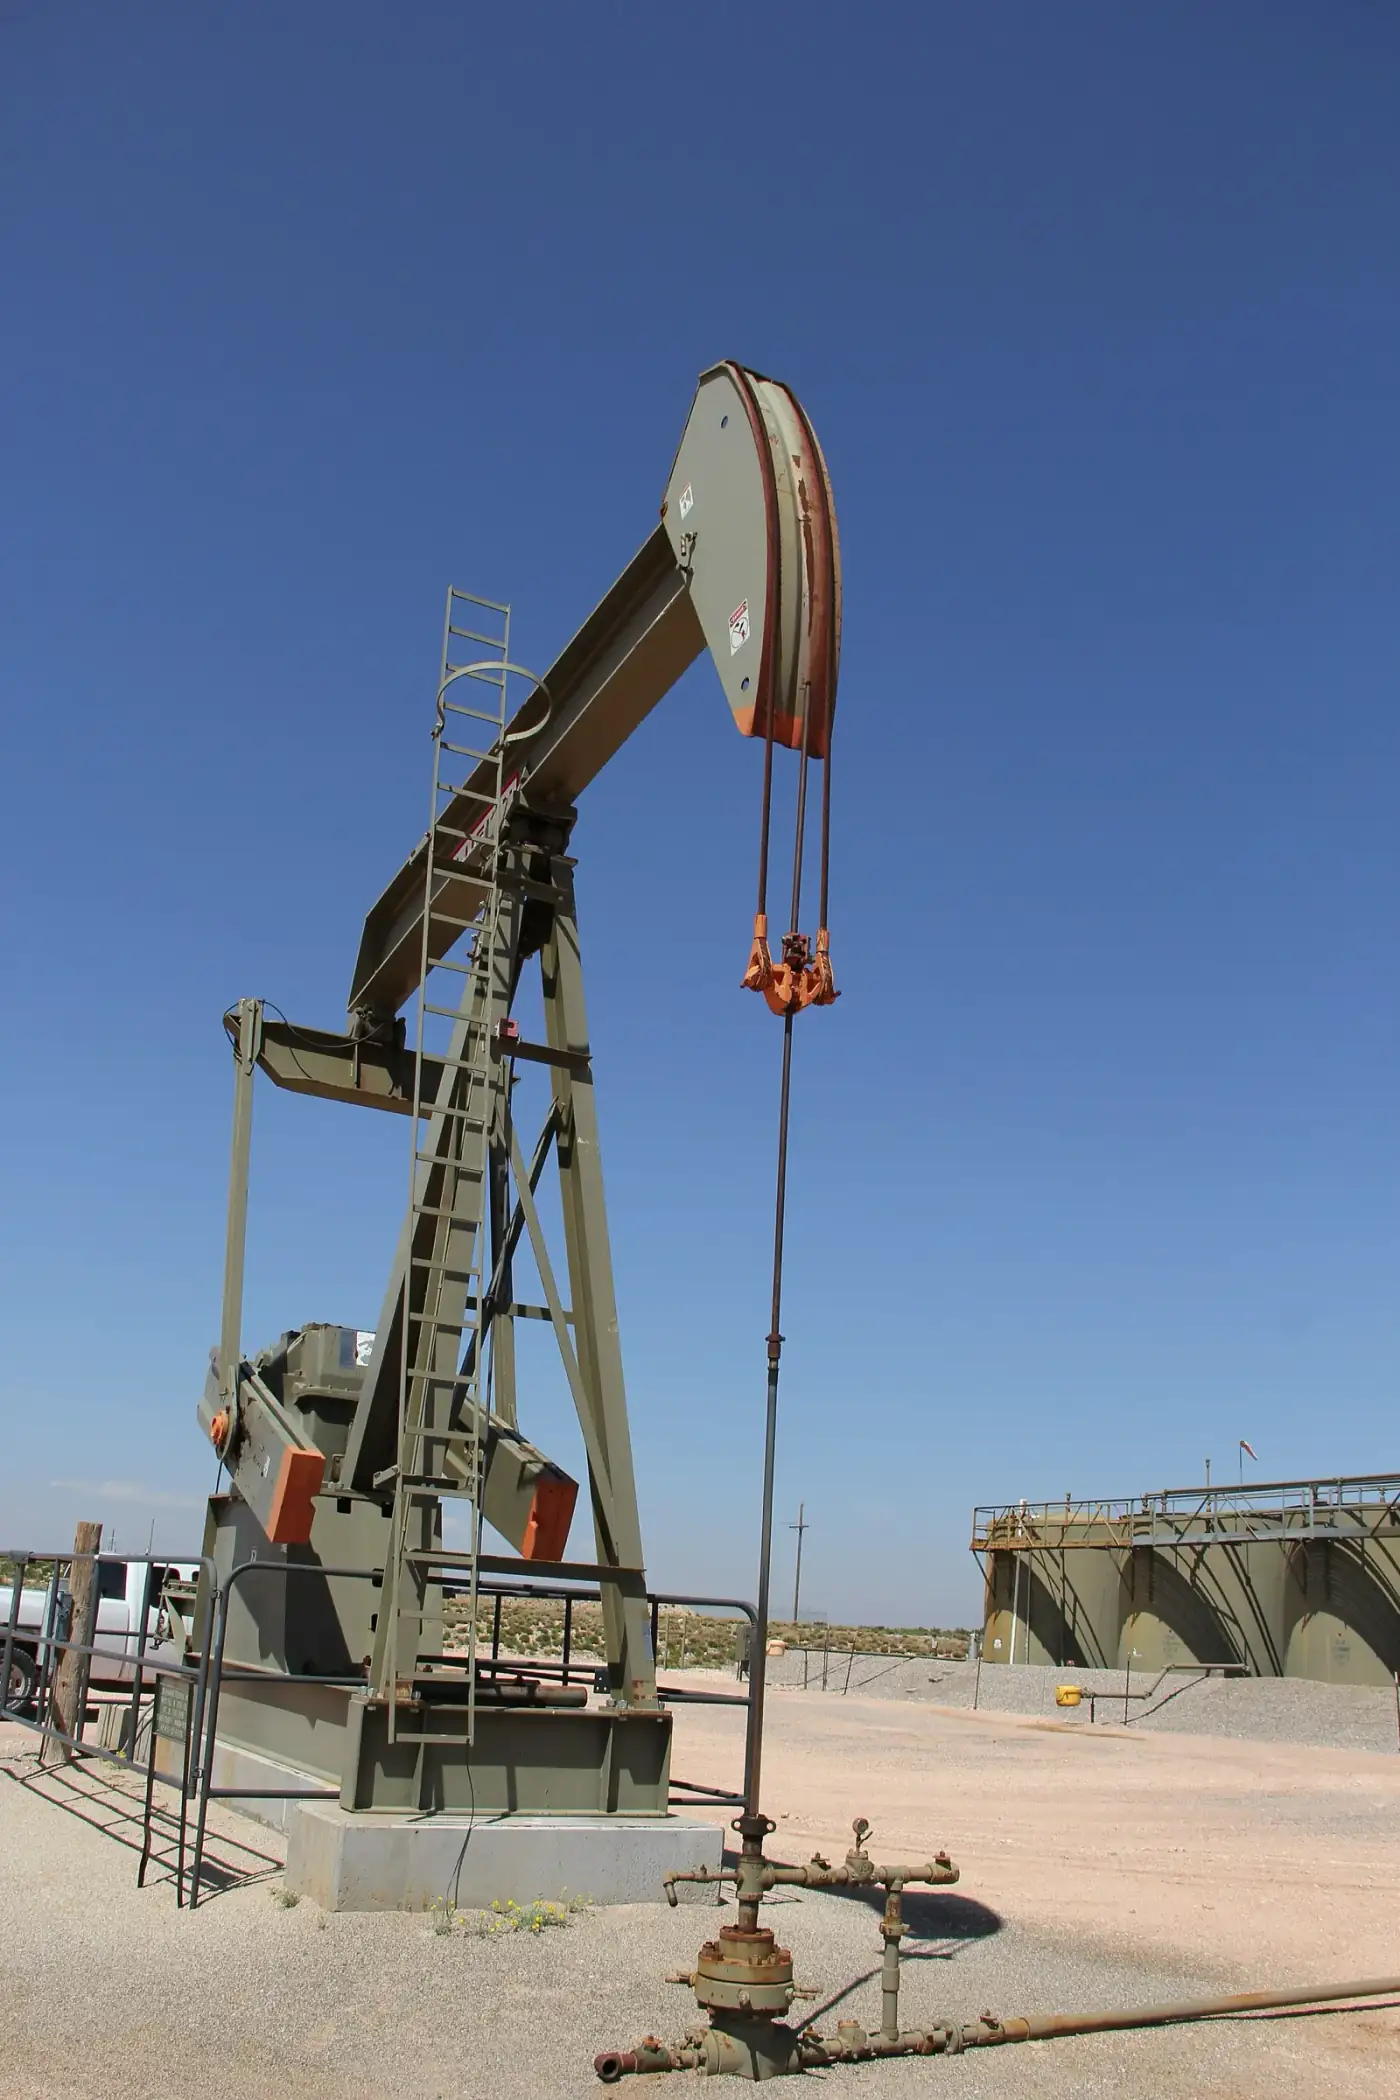
New Mexico produced 805.0 million barrels of crude oil in 2025, 16.1% of the U.S. total and up 8.1% from 2024.
- Crude oil, 2025
- 805.0 million barrels
- Share of U.S. crude
- 16.1%
- Natural gas, 2025
- 4,131 billion cubic feet, number 3 among states
- Change from 2024
- +8.1%
Most of its oil comes from the Delaware Basin side of the Permian in the southeast and the San Juan Basin gas play in the northwest.
How New Mexico treats unused mineral interests, and the statute, is on AMR’s New Mexico mineral rights page.
EIA, crude oil production by state, released September 30, 2026
3. North Dakota, 8.6% of U.S. crude
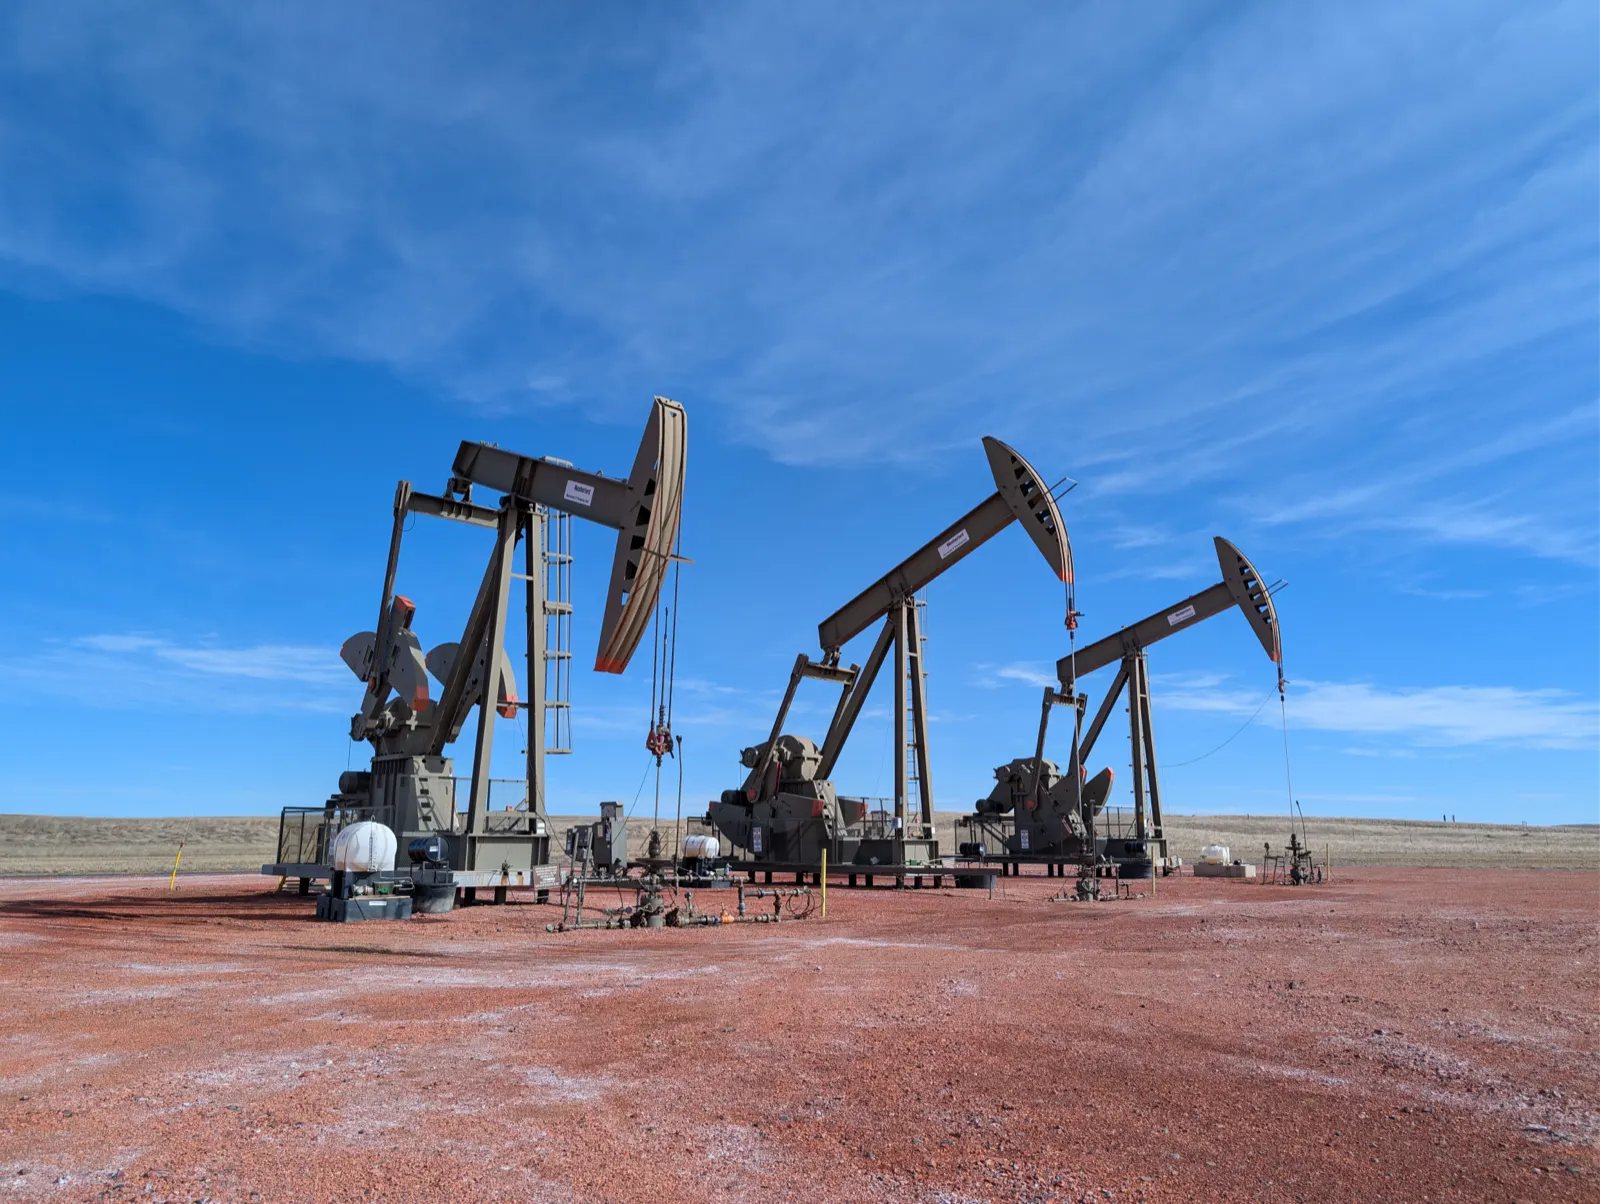
North Dakota produced 427.6 million barrels of crude oil in 2025, 8.6% of the U.S. total and down 2.5% from 2024.
- Crude oil, 2025
- 427.6 million barrels
- Share of U.S. crude
- 8.6%
- Natural gas, 2025
- 1,198 billion cubic feet, number 9 among states
- Change from 2024
- -2.5%
Most of its oil comes from the Bakken and the Three Forks beneath it in the Williston Basin.
How North Dakota treats unused mineral interests, and the statute, is on AMR’s North Dakota mineral rights page.
EIA, crude oil production by state, released September 30, 2026
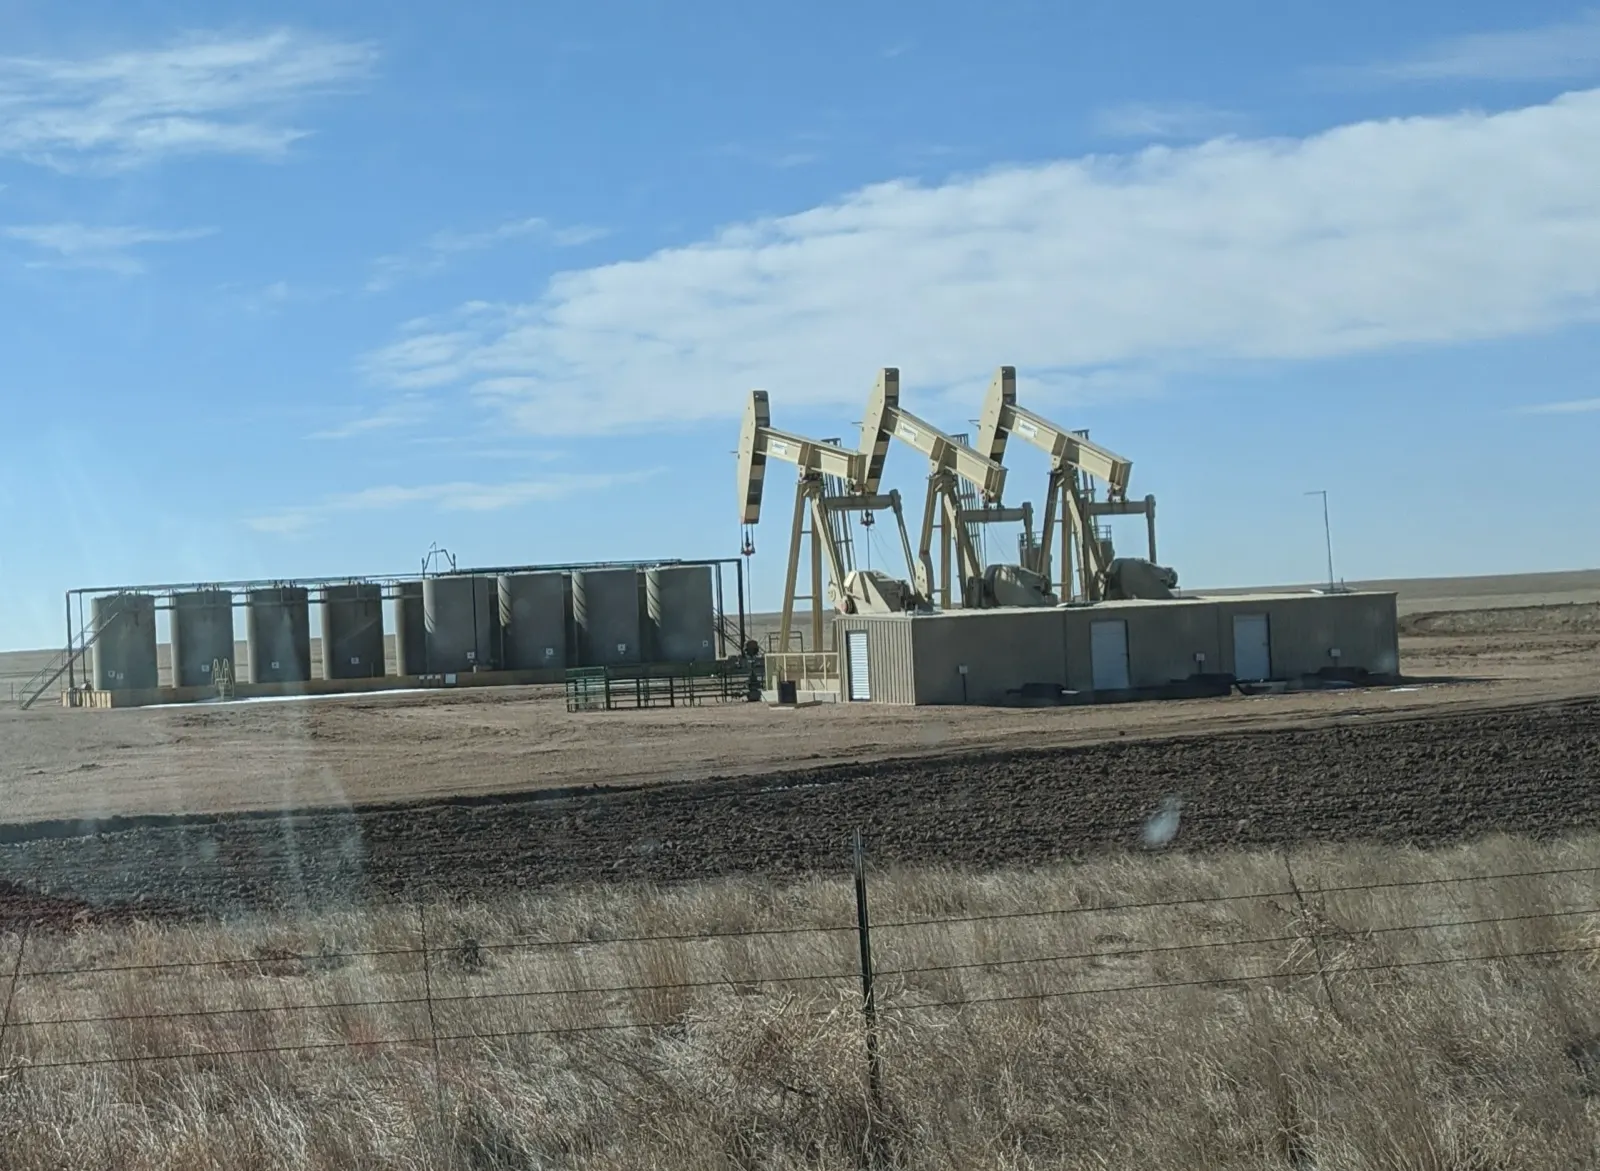
4. Colorado, 3.5% of U.S. crude
Colorado produced 173.3 million barrels of crude oil in 2025, 3.5% of the U.S. total and up 0.3% from 2024.
- Crude oil, 2025
- 173.3 million barrels
- Share of U.S. crude
- 3.5%
- Natural gas, 2025
- 1,870 billion cubic feet, number 8 among states
- Change from 2024
- +0.3%
Most of its oil comes from the Denver Julesburg Basin and its Niobrara play on the Front Range, and the Piceance Basin gas play on the Western Slope.
How Colorado treats unused mineral interests, and the statute, is on AMR’s Colorado mineral rights page.
EIA, crude oil production by state, released September 30, 2026
5. Alaska, 3.1% of U.S. crude
Alaska produced 154.0 million barrels of crude oil in 2025, 3.1% of the U.S. total and down 0.2% from 2024.
- Crude oil, 2025
- 154.0 million barrels
- Share of U.S. crude
- 3.1%
- Natural gas, 2025
- 369 billion cubic feet, number 11 among states
- Change from 2024
- -0.2%
Most of its oil comes from the North Slope, which EIA reports separately from the rest of the state.
How Alaska treats unused mineral interests, and the statute, is on AMR’s Alaska mineral rights page.
EIA, crude oil production by state, released September 30, 2026
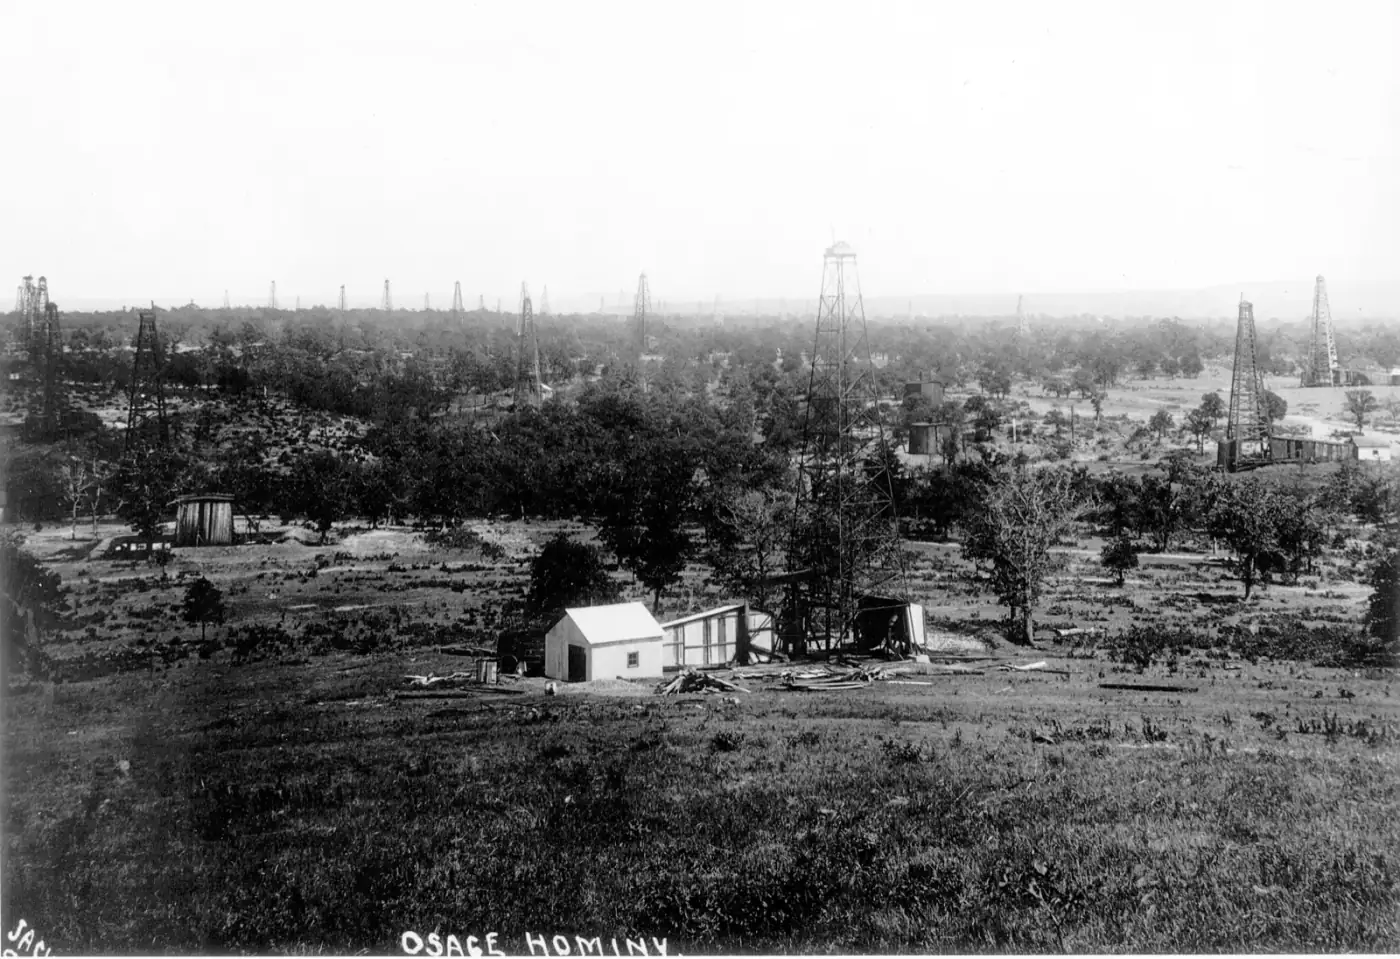
6. Oklahoma, 3.0% of U.S. crude
Oklahoma produced 147.5 million barrels of crude oil in 2025, 3.0% of the U.S. total and up 0.8% from 2024.
- Crude oil, 2025
- 147.5 million barrels
- Share of U.S. crude
- 3.0%
- Natural gas, 2025
- 2,878 billion cubic feet, number 6 among states
- Change from 2024
- +0.8%
Most of its oil comes from the SCOOP and STACK plays in the Anadarko Basin and the Arkoma Basin in the southeast.
How Oklahoma treats unused mineral interests, and the statute, is on AMR’s Oklahoma mineral rights page.
EIA, crude oil production by state, released September 30, 2026
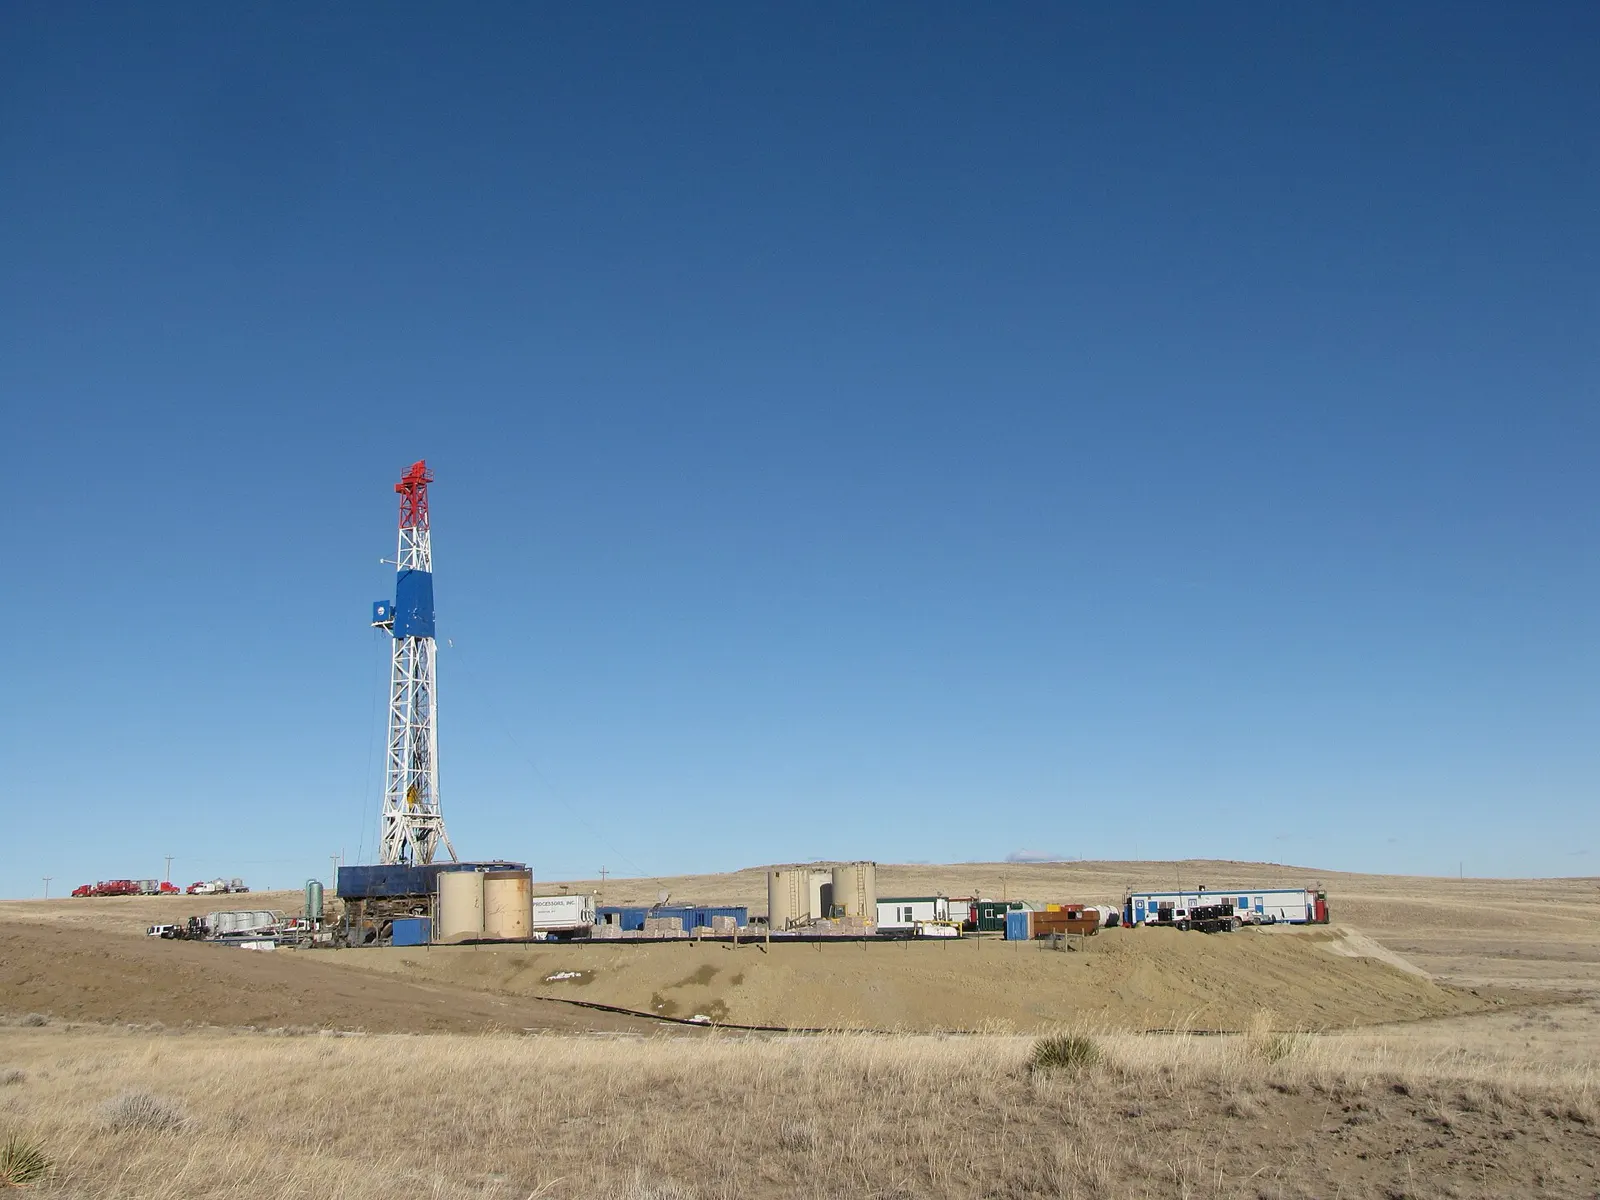
7. Wyoming, 2.1% of U.S. crude
Wyoming produced 105.3 million barrels of crude oil in 2025, 2.1% of the U.S. total and down 1.3% from 2024.
- Crude oil, 2025
- 105.3 million barrels
- Share of U.S. crude
- 2.1%
- Natural gas, 2025
- 938 billion cubic feet, number 10 among states
- Change from 2024
- -1.3%
Most of its oil comes from the Powder River Basin, the Green River Basin and the Niobrara.
How Wyoming treats unused mineral interests, and the statute, is on AMR’s Wyoming mineral rights page.
EIA, crude oil production by state, released September 30, 2026
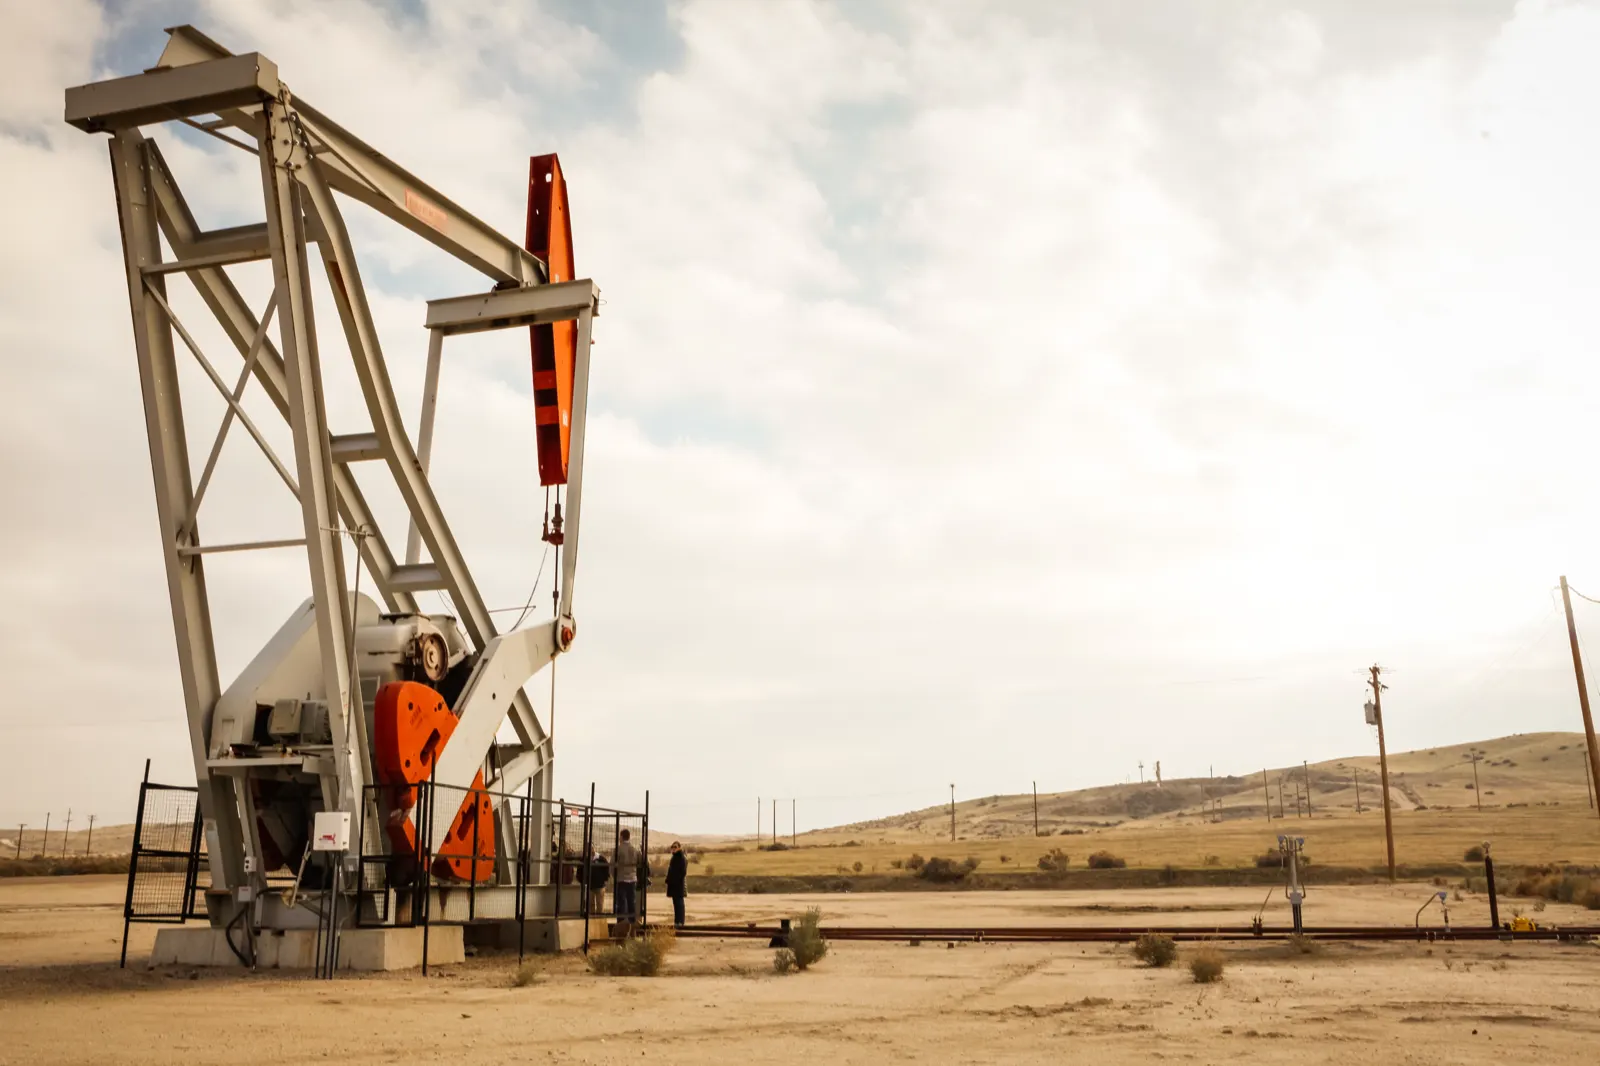
8. California, 2.1% of U.S. crude
California produced 105.2 million barrels of crude oil in 2025, 2.1% of the U.S. total and down 6.9% from 2024.
- Crude oil, 2025
- 105.2 million barrels
- Share of U.S. crude
- 2.1%
- Natural gas, 2025
- 112 billion cubic feet, number 15 among states
- Change from 2024
- -6.9%
Most of its oil comes from the San Joaquin Basin and the Los Angeles and Ventura basins along the coast.
How California treats unused mineral interests, and the statute, is on AMR’s California mineral rights page.
EIA, crude oil production by state, released September 30, 2026
9. Utah, 1.4% of U.S. crude
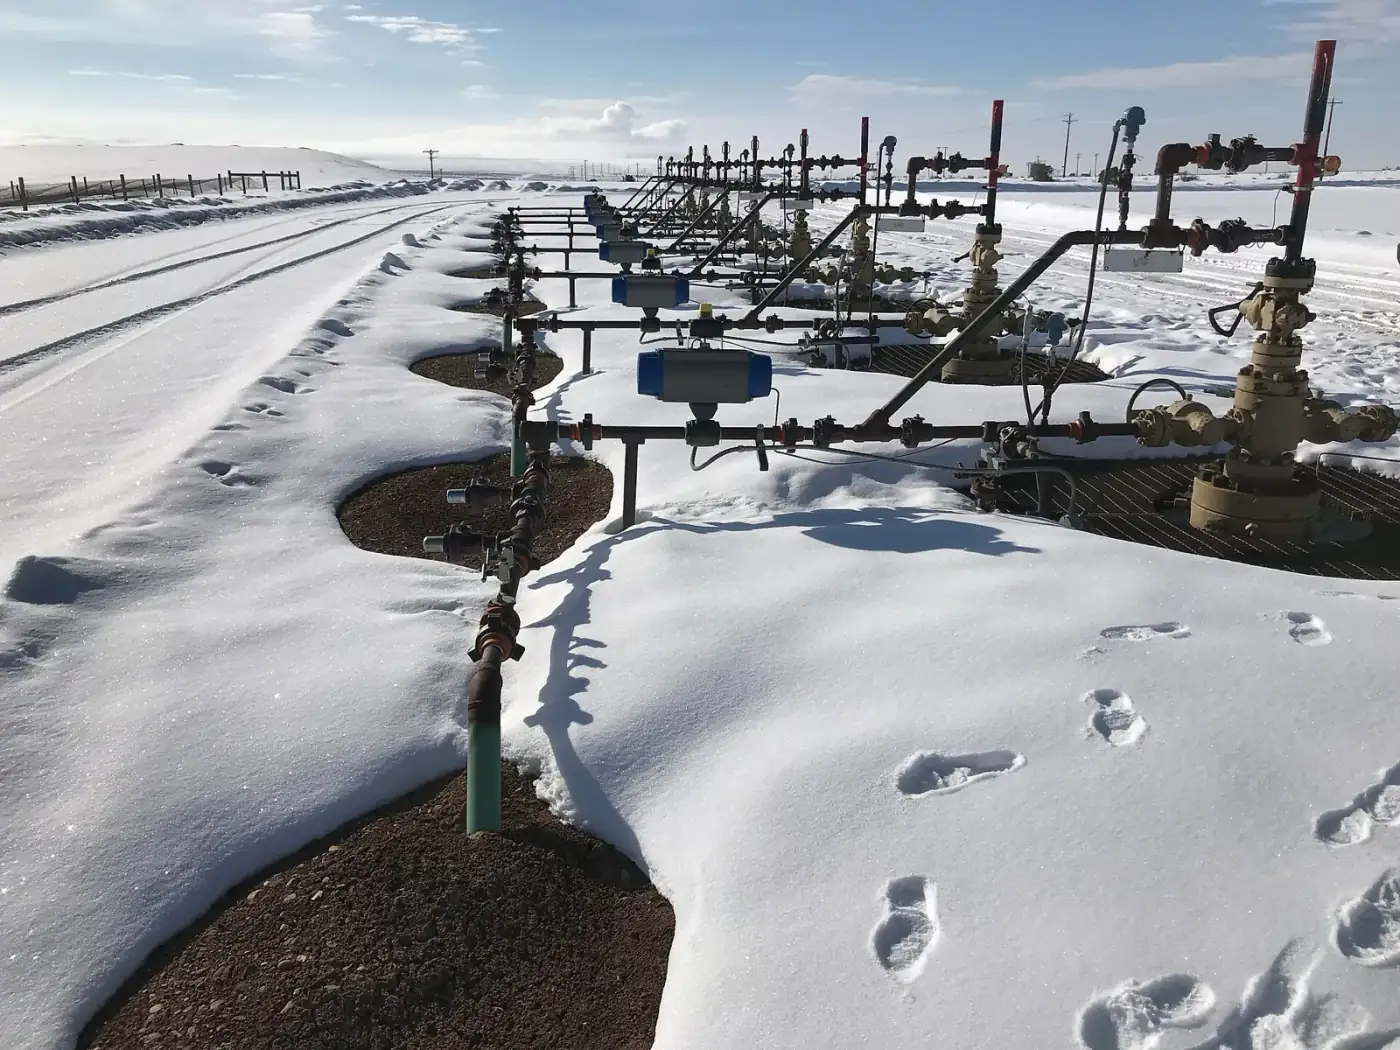
Utah produced 67.9 million barrels of crude oil in 2025, 1.4% of the U.S. total and up 4.1% from 2024.
- Crude oil, 2025
- 67.9 million barrels
- Share of U.S. crude
- 1.4%
- Natural gas, 2025
- 337 billion cubic feet, number 12 among states
- Change from 2024
- +4.1%
Most of its oil comes from the Uinta Basin and the Paradox Basin in the southeast.
How Utah treats unused mineral interests, and the statute, is on AMR’s Utah mineral rights page.
EIA, crude oil production by state, released September 30, 2026
10. Ohio, 1.0% of U.S. crude
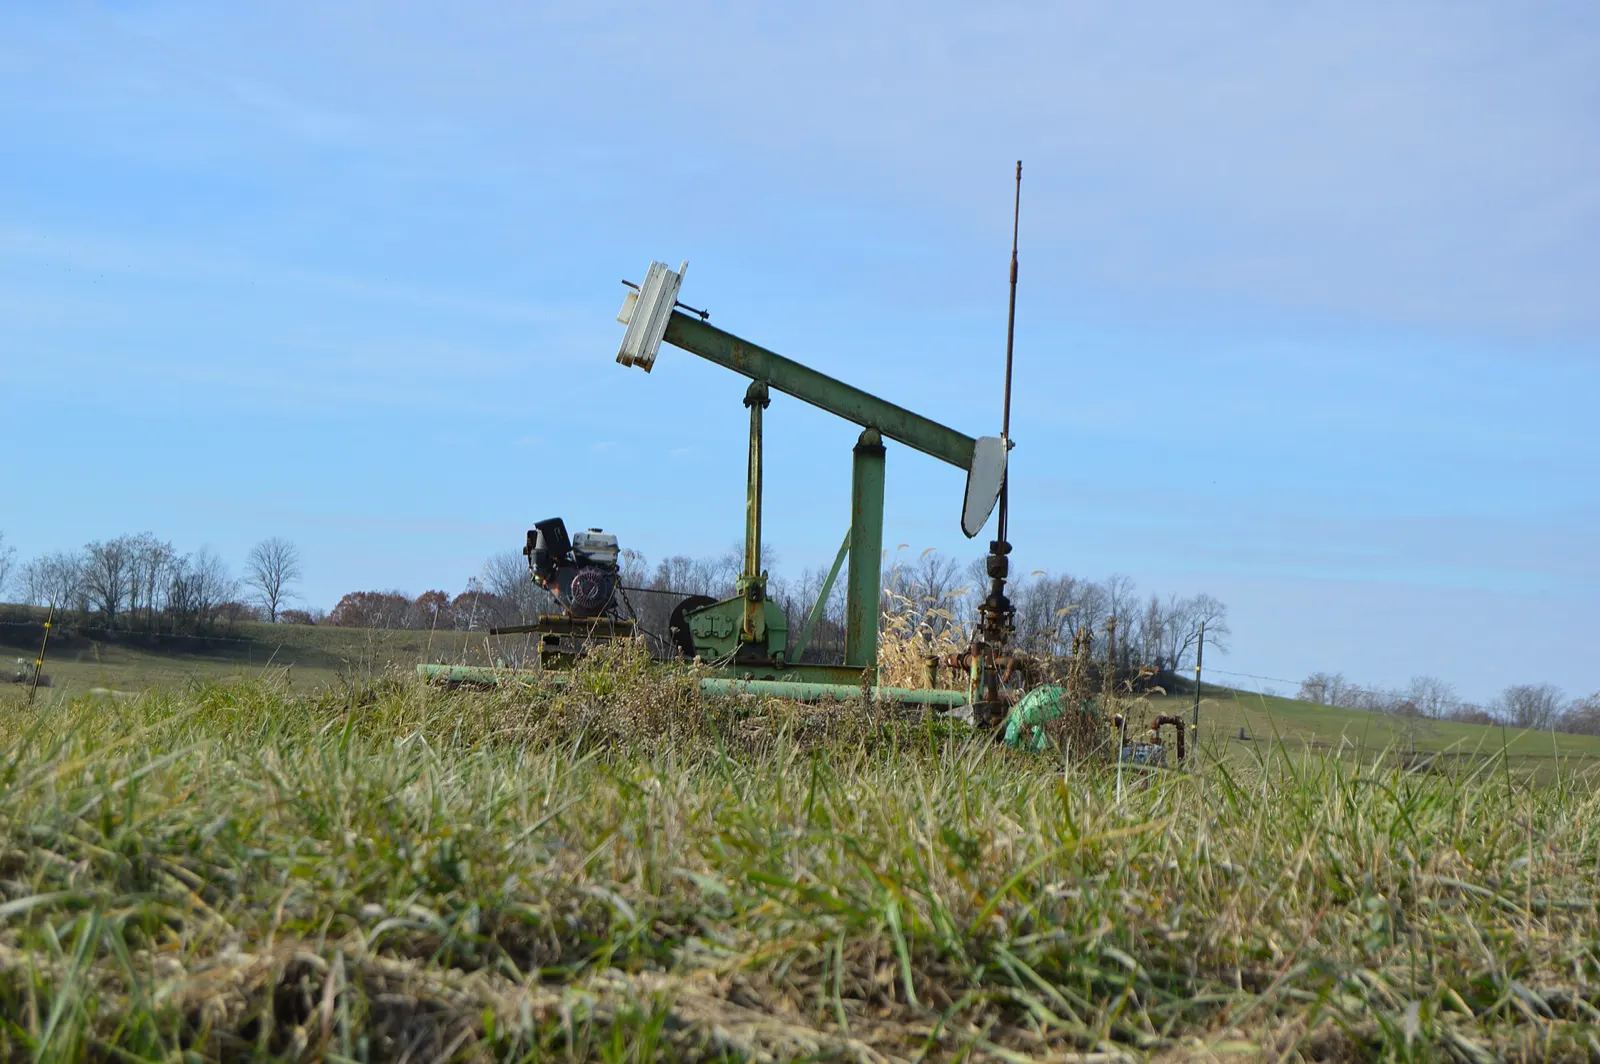
Ohio produced 50.1 million barrels of crude oil in 2025, 1.0% of the U.S. total and up 35.1% from 2024.
- Crude oil, 2025
- 50.1 million barrels
- Share of U.S. crude
- 1.0%
- Natural gas, 2025
- 2,101 billion cubic feet, number 7 among states
- Change from 2024
- +35.1%
Most of its oil comes from the Utica Shale and the Point Pleasant interval below it in the Appalachian Basin.
How Ohio treats unused mineral interests, and the statute, is on AMR’s Ohio mineral rights page.
EIA, crude oil production by state, released September 30, 2026
All 32 oil producing states
| Crude oil, 2025 | Share of U.S. | Change from 2024 | |
|---|---|---|---|
| 1. Texas | 2,102.6 million barrels | 42.2% | +1.2% |
| 2. New Mexico | 805.0 million barrels | 16.1% | +8.1% |
| 3. North Dakota | 427.6 million barrels | 8.6% | -2.5% |
| 4. Colorado | 173.3 million barrels | 3.5% | +0.3% |
| 5. Alaska | 154.0 million barrels | 3.1% | -0.2% |
| 6. Oklahoma | 147.5 million barrels | 3.0% | +0.8% |
| 7. Wyoming | 105.3 million barrels | 2.1% | -1.3% |
| 8. California | 105.2 million barrels | 2.1% | -6.9% |
| 9. Utah | 67.9 million barrels | 1.4% | +4.1% |
| 10. Ohio | 50.1 million barrels | 1.0% | +35.1% |
| 11. Montana | 28.8 million barrels | 0.6% | +7.8% |
| 12. Louisiana | 26.9 million barrels | 0.5% | -11.4% |
| 13. Kansas | 25.4 million barrels | 0.5% | -5.3% |
| 14. West Virginia | 15.0 million barrels | 0.3% | +10.2% |
| 15. Mississippi | 10.1 million barrels | 0.2% | -17.4% |
| 16. Illinois | 6.6 million barrels | 0.1% | -5.9% |
| 17. Pennsylvania | 4.3 million barrels | 0.1% | -3.1% |
| 18. Michigan | 4.0 million barrels | 0.1% | -11.5% |
| 19. Arkansas | 4.0 million barrels | 0.1% | -3.0% |
| 20. Alabama | 3.1 million barrels | 0.1% | -8.5% |
| 21. Kentucky | 1.7 million barrels | 0.0% | -15.0% |
| 22. Nebraska | 1.4 million barrels | 0.0% | +6.8% |
| 23. Indiana | 1.3 million barrels | 0.0% | -19.2% |
| 24. South Dakota | 0.8 million barrels | 0.0% | -5.9% |
| 25. Florida | 0.8 million barrels | 0.0% | -10.8% |
| 26. Nevada | 0.2 million barrels | 0.0% | -2.8% |
| 27. Tennessee | 0.2 million barrels | 0.0% | +0.0% |
| 28. New York | 0.2 million barrels | 0.0% | -26.1% |
| 29. Missouri | 0.0 million barrels | 0.0% | -15.8% |
| 30. Idaho | 0.0 million barrels | 0.0% | +42.1% |
| 31. Virginia | 0.0 million barrels | 0.0% | +60.0% |
| 32. Arizona | 0.0 million barrels | 0.0% | -25.0% |
Top natural gas producing states
Natural gas ranks differently: Pennsylvania, second for gas, is not in the top ten for oil.
| Marketed gas, 2025 | Share of U.S. | Change from 2024 | |
|---|---|---|---|
| 1. Texas | 12,657 billion cubic feet | 29.3% | +5.3% |
| 2. Pennsylvania | 7,676 billion cubic feet | 17.8% | +3.4% |
| 3. New Mexico | 4,131 billion cubic feet | 9.6% | +14.8% |
| 4. Louisiana | 3,814 billion cubic feet | 8.8% | +5.5% |
| 5. West Virginia | 3,600 billion cubic feet | 8.3% | +5.3% |
| 6. Oklahoma | 2,878 billion cubic feet | 6.7% | +4.6% |
| 7. Ohio | 2,101 billion cubic feet | 4.9% | -2.6% |
| 8. Colorado | 1,870 billion cubic feet | 4.3% | +1.2% |
| 9. North Dakota | 1,198 billion cubic feet | 2.8% | +1.0% |
| 10. Wyoming | 938 billion cubic feet | 2.2% | -10.9% |
| 11. Alaska | 369 billion cubic feet | 0.9% | -0.8% |
| 12. Utah | 337 billion cubic feet | 0.8% | +10.6% |
| 13. Arkansas | 323 billion cubic feet | 0.7% | -9.0% |
| 14. Kansas | 122 billion cubic feet | 0.3% | -2.9% |
| 15. California | 112 billion cubic feet | 0.3% | -10.0% |
| 16. Montana | 44 billion cubic feet | 0.1% | +6.1% |
Common questions
What is the top oil producing state in the U.S.?
Texas, which produced 2,102.6 million barrels of crude oil in 2025, 42.2% of the national total.
What are the top 5 oil producing states?
Texas, New Mexico, North Dakota, Colorado, Alaska, in that order, by EIA’s 2025 figures.
Which state produces the most natural gas?
Texas, followed by Pennsylvania, New Mexico and Louisiana.
Is Gulf of America production counted in Texas or Louisiana?
Only the state waters near shore are. Federal offshore production is reported separately, and in 2025 it was 708.8 million barrels.
Where can I see production by county?
AMR’s production by county page carries county data where state agencies publish it.
Summary
Texas alone produces more crude than the next five states together, and New Mexico is a clear second at 16.1% of the U.S. total. For the law that comes with the oil, each state’s rule on unused minerals is in AMR’s Mineral Rights by State.
Sources
Every page below was opened on October 1, 2026.
- EIA, Crude Oil Production, annual, thousand barrels (EIA Petroleum Supply Annual and Monthly)
- EIA, Natural Gas Marketed Production, annual, million cubic feet (EIA Natural Gas Annual and Monthly)
Cite this list
American Mineral Registry. "Top Oil Producing States in 2025: All 32 Ranked, With Natural Gas." Release 2026.10.1, October 5, 2026. https:// americanmineralregistry.com/ research/ top-oil-producing-states
[Top Oil Producing States in 2025: All 32 Ranked, With Natural Gas](https:// americanmineralregistry.com/ research/ top-oil-producing-states), American Mineral Registry, release 2026.10.1 (October 5, 2026).
<a href="https:// americanmineralregistry.com/ research/ top-oil-producing-states">Top Oil Producing States in 2025: All 32 Ranked, With Natural Gas</ a>, American Mineral Registry, release 2026.10.1 (October 5, 2026).
@online{amr_top_oil_producing_states_in_2025_all_32_ranked_with_natural_gas_2026101,
  author = {{American Mineral Registry}},
  title = {Top Oil Producing States in 2025: All 32 Ranked, With Natural Gas},
  version = {2026.10.1},
  date = {2026-10-05},
  url = {https://americanmineralregistry.com/research/top-oil-producing-states}
} TY - ELEC AU - American Mineral Registry TI - Top Oil Producing States in 2025: All 32 Ranked, With Natural Gas ET - 2026.10.1 DA - 2026/10/ 05 UR - https:/ / americanmineralregistry.com/ research/ top-oil-producing-states ER -