Key takeaways
- Federal geothermal bonuses exceeded royalties in three of 21 fiscal years with all four receipt categories reported, FY 2008, FY 2009 and FY 2026. The comparison covers FY 2004 through FY 2026 with FY 2005 and FY 2006 excluded for absent bonus rows.
- Royalties made up 61.52% of federal geothermal lease receipts across the 21 fiscal years with all four receipt types in ONRR’s FY 2004 through FY 2026 series. Royalties total $294,061,849.83, divided by $477,968,755.55 in signed receipts.
- Federal geothermal lease receipts rose by $23,068,293.83 from FY 2025 to FY 2026, while royalty receipts fell by $669,250.85. Bonus receipts increased by $20,879,941.00. This is an additive bridge by recorded payment type.
- Federal geothermal lease receipts excluding bonuses peaked at $22,126,717.58 in FY 2023. FY 2026 recorded the highest all-type total, but its subtotal excluding bonuses was $21,732,627.63. The subtotal combines signed royalties, rents and other revenues across the 21 complete comparison years.
- Average annual federal geothermal lease receipts excluding bonuses were 37.29% higher in FY 2022 through FY 2026 than in FY 2007 through FY 2011, rising from $14,855,949.52 to $20,396,261.25. Both periods contain five complete fiscal years. The amounts are nominal annual means of the signed subtotal.

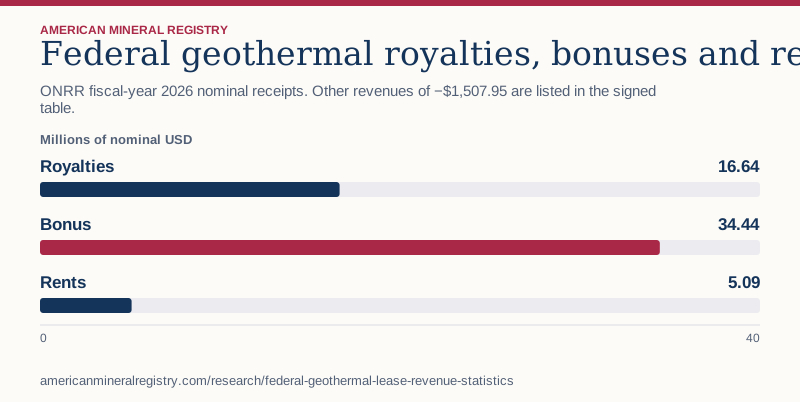
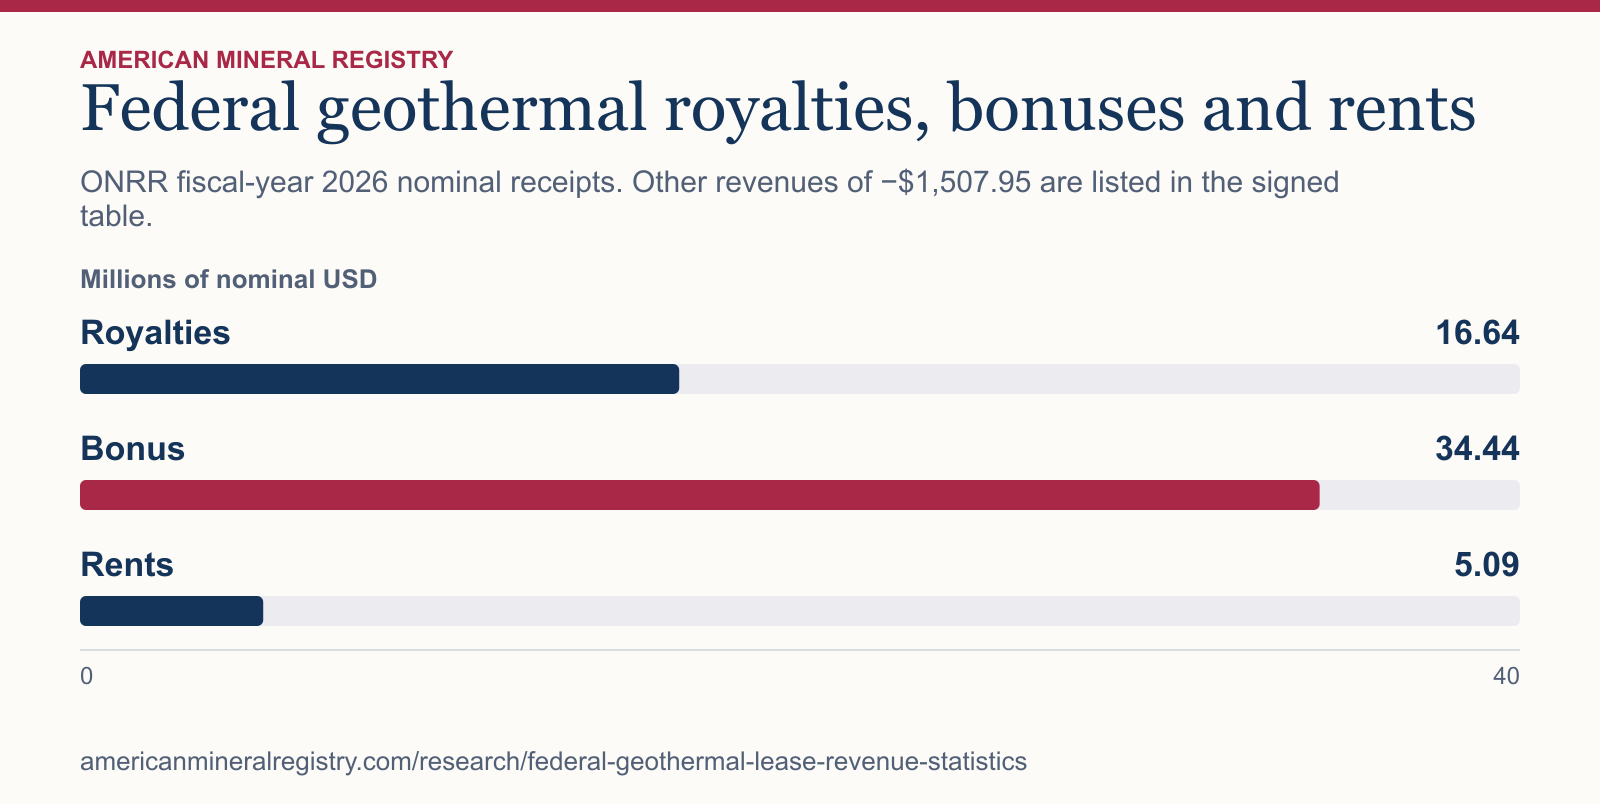
Figure 1 in text
ONRR fiscal-year 2026 nominal receipts. Other revenues of −$1,507.95 are listed in the signed table. Millions of nominal USD.
| Category | Millions of nominal USD |
|---|---|
| Royalties | 16.64 |
| Bonus | 34.44 |
| Rents | 5.09 |
Chart wording and scale
Federal geothermal royalties, bonuses and rents ONRR fiscal-year 2026 nominal receipts. Other revenues of −$1,507.95 are listed in the signed table.
Millions of nominal USD
Royalties
16.64
Bonus
34.44
Rents
5.09 0 40
Source and data: Download chart source data
Permanent link to this figure’s text and data · Sources and context
What counts as federal geothermal lease revenue?
The EIA geothermal energy definitions and uses defines geothermal energy as heat from inside the earth and distinguishes uses such as direct heating and electricity generation. The BLM geothermal leasing and development stages describes exploration, resource drilling, production and reclamation as stages of development on federal geothermal leases. A payment can appear in a federal receipt file even when the analysis is about the lease portfolio rather than power generated.
In ONRR’s fiscal revenue data, select the Geothermal value in Mineral Lease Type and Federal in Land Class. Every matching row in this snapshot is onshore. Then separate Royalties, Bonus, Rents and Other revenues. Bonus rows capture the source category for lease bids. Rent rows record lease rentals. Royalties are the production-linked category. The Congressional Research Service comparison of federal geothermal lease terms distinguishes these obligations. Keep Other revenues separate because the published aggregate supplies no single economic explanation for all entries in that bucket.
How much of the FY 2026 total was royalties?
Of the $56,167,825.63 in signed federal geothermal lease receipts, royalties contributed $16,644,722.45, or 29.63%. Bonus receipts were larger than royalty receipts. If the question asks how much ONRR recorded in geothermal royalties, use the royalty row. If it asks how much ONRR recorded across the four geothermal lease payment types, use the signed total.
The percentages below all divide by the same fiscal-year total. Other revenues is negative, and rounding its share to two decimal places can hide the sign. The table shows extra precision for that share. If a republication drops the signed value or combines it with royalties, it changes the meaning of at least one figure.
| FY 2026 revenue type | Signed nominal receipts | Share of signed total |
|---|---|---|
| Royalties | $16,644,722.45 | 29.63% |
| Bonus | $34,435,198.00 | 61.31% |
| Rents | $5,089,413.13 | 9.06% |
| Other revenues | −$1,507.95 | -0.00268% |
| All four types | $56,167,825.63 | 100.00% |
Why filter the lease type rather than only the commodity field?
The lease-type question asks what ONRR recorded on leases classified Geothermal. The Commodity field describes a separate classification on a row. The selected snapshot contains three Gas commodity royalty rows that carry Geothermal as their lease type. Those rows remain in the lease measure. Someone building a different series defined by Commodity = Geothermal would need to state that filter and reconcile its difference.
To reproduce the four-type series, group each selected fiscal year’s rows by Revenue Type and add the original signed Revenue amounts within each bucket. Keep the full dollar-and-cent values through addition and percentage calculations. A dollar amount in a source row is already an aggregate in the published extract. The count columns in the download are counts of rows, so they cannot be used to infer how many leases, bills or payers were involved.
If you want to compare a state subtotal with the national mix, apply the same lease and revenue filters before selecting the state. The four types also need to be present at that finer level for an equivalent payment-mix comparison. The national coverage check alone cannot establish state-level category completeness.
How can lease receipts rise while royalties decline?
Start with the FY 2025 four-category sum of $33,099,531.80. Subtract each FY 2025 category from its FY 2026 counterpart. The largest increase is the bonus contribution of $20,879,941.00. Rents also rose, while royalties and other revenues reduced the increase. Adding the four signed changes gives $23,068,293.83, which equals the change in the reported total.
The bridge identifies the source categories responsible for the arithmetic. An account of why bonus receipts increased would need matched evidence on individual lease awards, payments and the dates they entered ONRR’s system. Royalty receipts are the right series for a royalty trend. A rising aggregate can tell a different story when bonus payments account for much of the increase.
| Revenue type | FY 2025 nominal receipts | FY 2026 nominal receipts | FY 2026 less FY 2025 |
|---|---|---|---|
| Royalties | $17,313,973.30 | $16,644,722.45 | −$669,250.85 |
| Bonus | $13,555,257.00 | $34,435,198.00 | $20,879,941.00 |
| Rents | $2,204,937.52 | $5,089,413.13 | $2,884,475.61 |
| Other revenues | $25,363.98 | −$1,507.95 | −$26,871.93 |
| All four types | $33,099,531.80 | $56,167,825.63 | $23,068,293.83 |
Did the largest totals and the largest royalties occur together?
The largest signed four-category total occurs in FY 2026, while the royalty subtotal peaks in FY 2023 and the bonus subtotal peaks in FY 2009. Comparing all three years helps separate a high royalty year from a high lease-receipt year. Bonus exceeded royalties in the three years named in the findings, but that comparison alone does not establish a pattern for future lease sales.
The pooled royalty share answers another question. Sum royalties over all 21 comparison years and divide by the signed four-category total for those years. That procedure gives years with larger receipt totals more weight than an unweighted average of annual shares. The pooled denominator includes every selected type, with receipts kept in nominal dollars across fiscal years.
| Fiscal year | Reason selected | Royalties | Bonus | Signed all-type total |
|---|---|---|---|---|
| FY 2009 | largest bonus | $11,420,317.34 | $34,897,279.00 | $48,606,634.35 |
| FY 2023 | largest royalties | $19,247,114.82 | $3,209,614.00 | $25,336,331.58 |
| FY 2026 | largest total | $16,644,722.45 | $34,435,198.00 | $56,167,825.63 |
Which years support a complete four-category comparison?
The calculation requires at least one matching row for every payment category. The reviewed snapshot has no matching bonus row in FY 2005 or FY 2006. Those years are excluded from the four-type CSV, pooled totals, and rankings. In FY 2016 the extract supplies an explicit bonus row of $0.00. That year stays in the comparison. This treatment preserves the difference between a recorded zero and a missing category row.
A reader looking up a single royalty subtotal can filter that type separately. The absence of a bonus row is a coverage fact and does not make the royalty rows for FY 2005 or FY 2006 incomplete for that separate question. The DOI fiscal revenue coverage and metadata describes the public file’s categories and coverage. Check the source vintage because a later revision could change a row, a sign or the category’s presence.
How much of the apparent change remains after separating lease bonuses?
Subtract Bonus from each year’s four-type total. This leaves Royalties, Rents and Other revenues with their original signs. In FY 2026 that subtotal was $21,732,627.63. FY 2023 was larger on the same measure at $22,126,717.58. The gap between the two retained subtotals was $394,089.95, even though FY 2026 had the higher all-type amount.
The subtotal is a way to compare the three selected payment types after setting bonus receipts aside. It does not establish a recurring or guaranteed baseline, because the three components can still vary from year to year. A report about royalty receipts alone should use the Royalties column directly. This subtotal also stays separate from money disbursed to governments or funds.
Rank years independently on the all-type and retained amounts before writing a record-year headline. Each ranking requires complete coverage for the four categories so the comparison uses the same observations.
| Fiscal year | All four types | Bonus | Receipts excluding bonus | Royalties alone |
|---|---|---|---|---|
| 2008 | $37,839,806.11 | $22,016,128.00 | $15,823,678.11 | $14,088,197.41 |
| 2009 | $48,606,634.35 | $34,897,279.00 | $13,709,355.35 | $11,420,317.34 |
| 2023 | $25,336,331.58 | $3,209,614.00 | $22,126,717.58 | $19,247,114.82 |
| 2024 | $20,570,181.11 | $825,733.00 | $19,744,448.11 | $17,284,898.89 |
| 2025 | $33,099,531.80 | $13,555,257.00 | $19,544,274.80 | $17,313,973.30 |
| 2026 | $56,167,825.63 | $34,435,198.00 | $21,732,627.63 | $16,644,722.45 |
How do typical annual amounts compare across equal fiscal windows?
The table uses four consecutive five-year blocks from FY 2007 through FY 2026. These are 20 adjacent complete observations. FY 2004 is available in the full 21-year comparison, but falls outside these contiguous blocks because the FY 2005 and FY 2006 bonus categories are absent from the reviewed data.
In the earliest block the mean excluding bonuses was $14,855,949.52. In the latest it was $20,396,261.25. The difference was $5,540,311.72 per year. Compare the royalty column to see how much of the retained amount comes from the production-linked receipt category. That column is part of the subtotal, so it should not be added to the subtotal a second time.
To reproduce any row, add the five signed fiscal totals and divide by five. Use the same five fiscal years for the bonus average and the subtotal average. Their sum matches the full average before display rounding. This setup tests how the mean changes when a category is removed, with the period held fixed.
| Five fiscal years | Mean all four types | Mean bonus | Mean excluding bonus | Mean royalties |
|---|---|---|---|---|
| FY 2007 to 2011 | $29,711,365.72 | $14,855,416.20 | $14,855,949.52 | $12,239,939.57 |
| FY 2012 to 2016 | $14,950,594.17 | $53,386.60 | $14,897,207.57 | $12,468,478.66 |
| FY 2017 to 2021 | $16,325,599.28 | $158,142.10 | $16,167,457.18 | $14,581,064.32 |
| FY 2022 to 2026 | $31,241,348.25 | $10,845,087.00 | $20,396,261.25 | $17,488,220.57 |
Which subtotal is appropriate for a royalty or lease revenue headline?
For a question about what the government recorded across the selected lease payment types, start with the signed four-category total. For a question about how receipts look without bids, use the subtotal excluding bonuses and say which categories remain. For a question specifically about royalties, keep that single payment type. A document that alternates between these measures should label each figure independently.
The two earliest blocks illustrate how much the choice can matter. Their mean excluding bonus is close, while their full means differ substantially. This shows that the payment mix changes the observed period comparison. It does not establish whether the underlying volume of geothermal heat, generation, number of projects or prices moved with the receipts.
When reusing the latest window, retain the distinction between a per-year average and a total for the five-year period. The former divides by five. The latter adds all five years in nominal dollars. Both can be calculated from the download, but the unit in the headline should identify which one was used.
How can you verify that the comparison preserves signed amounts?
Rebuild the subtotal in two ways. First take the published four-category total and subtract the Bonus amount. Then add Royalties, Rents and Other revenues directly. Use the dollar-and-cent values from the same fiscal row for both calculations. They should agree before rounding. If they differ, check whether an import removed a sign or converted a numeric field to text.
FY 2016 provides a useful check because the bonus amount is an explicit source zero. The all-type total equals the subtotal excluding bonus in that year. That test does not authorize treating an absent category as a zero. The years omitted from the complete comparison remain outside the calculation when comparing the full and retained amounts.
Carry the signed Other revenues amount into the retained subtotal even when it is small beside royalties. If the subtotal is then used in a percentage, the signed amount still affects the denominator. A calculation that drops it should be labeled as a two-type comparison of royalties and rents.
A pooled share weights each fiscal year by its recorded dollars, while an annual mean gives one observation to each fiscal year. When an article compares the earlier and later payment mix, use the same approach in both periods and keep the denominator visible.
How does this analysis compare with published sources?
This study draws on ONRR / DOI, Bureau of Land Management, Congressional Research Service, U.S. Energy Information Administration, ONRR / DOI. The comparison below shows which questions each source answers and which calculations AMR adds.
| Publication | What it covers | Where the scope differs | How AMR uses it |
|---|---|---|---|
| ONRR / DOI | Catalog defines fiscal, land class, revenue type and product coverage. | The metadata does not tabulate the complete geothermal payment mix by year. | Sum signed lease-type rows and retain the coverage rule. |
| Bureau of Land Management | Federal geothermal leasing overview distinguishes exploration, drilling, production and reclamation. | The overview does not report ONRR signed receipt totals. | Use for development-stage context. |
| Congressional Research Service | The lease terms section compares federal geothermal bids, rents and royalties. | The reviewed terms do not report annual signed ONRR receipt totals. | Use to distinguish payment categories. |
| U.S. Energy Information Administration | Explains geothermal energy and distinct uses including electricity and heat. | The explanation does not provide federal lease payment totals. | Keep energy measures separate from lease receipts. |
| ONRR / DOI | Describes fiscal-year disbursements and recipient funds. | The metadata does not provide the payment-type receipt history. | Use as the reference for recipient questions. |
When should you use geothermal receipts, production or disbursement figures?
Use the fiscal revenue table for amounts recorded under the federal geothermal lease category. Use an energy dataset for electricity generation or geothermal use. EIA’s EIA geothermal energy definitions and uses explains why electricity captures only one use of geothermal heat. Receipt dollars alone cannot measure output, the number of generating projects or the share of national electricity supplied by federal leases.
Use the DOI fiscal disbursement data coverage when asking what a government or fund received. Check its filters before attaching a geothermal-only label, especially for a subtotal that may pool commodities. For a reusable citation, include ONRR, the fiscal year, the Federal and Geothermal lease scope, and the receipt type. A chart that compares payment types should keep the nominal basis and the two-year comparison exclusions visible.
Sources and data
- ONRR original fiscal-year revenue CSV
- DOI fiscal revenue coverage and metadata
- BLM geothermal leasing and development stages
- Congressional Research Service comparison of federal geothermal lease terms
- EIA geothermal energy definitions and uses
- DOI fiscal disbursement data coverage
Download the data (CSV) · Read the data dictionary. The AMR analysis and figures are licensed CC BY 4.0. Refer to the original issuers for their materials.