Key takeaways
- The Gulf accounted for 96.96% of the $122.68 billion in signed federal offshore oil and gas lease royalty receipts across FY 2004 through FY 2026. Pool the signed region amounts over the full period before dividing.
- The highest Gulf share of federal offshore oil and gas lease royalties was 99.35% in FY 2023. The largest offshore receipt total occurred in FY 2008. The share uses the three-region denominator in each fiscal year.
- Pacific federal offshore oil and gas lease royalty receipts rose from $36,536,946.22 in FY 2025 to $100,015,560.11 in FY 2026. The source-region change is measured in nominal, signed fiscal receipt dollars.
- The Pacific accounted for 95.22% of signed federal offshore oil and gas lease royalty receipts outside the Gulf in ONRR’s FY 2004 through FY 2026 data. The Pacific numerator is $3,551,458,182.32 and the Pacific-plus-Alaska denominator is $3,729,772,669.50. The result pools dollars across years.
- Federal offshore oil and gas lease royalty receipts outside the Gulf rose from $215,681,431.59 in FY 2017 through FY 2021 to $283,753,795.57 in FY 2022 through FY 2026, while their share of offshore royalties fell from 1.10% to 0.88%. Both windows cover five federal fiscal years. Each share uses the total signed royalty receipts from all three observed offshore regions in that same window.

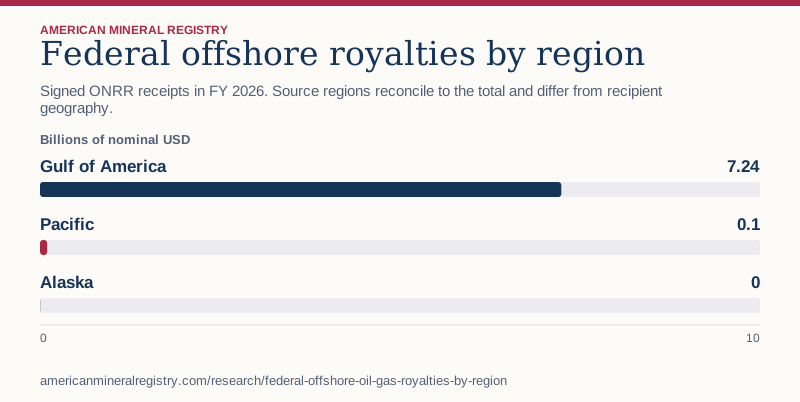
Figure 1 in text
Signed ONRR receipts in FY 2026. Source regions reconcile to the total and differ from recipient geography. Billions of nominal USD.
| Category | Billions of nominal USD |
|---|---|
| Gulf of America | 7.24 |
| Pacific | 0.1 |
| Alaska | 0 |
Chart wording and scale
Federal offshore royalties by region Signed ONRR receipts in FY 2026. Source regions reconcile to the total and differ from recipient geography.
Billions of nominal USD
Gulf of America
7.24
Pacific
0.1
Alaska
0 0 10
Source and data: Download chart source data
Permanent link to this figure’s text and data · Sources and context
Where did the federal offshore royalties come from?
The public fiscal revenue file identifies the offshore region associated with a revenue row. This study selects federal offshore rows on oil and gas leases with the revenue type Royalties. In the reviewed FY 2004 through FY 2026 snapshot, all matching rows report one of three regions. The totals below answer a source question about where recorded receipts were attributed.
The BOEM’s four administrative offshore regions page lists four administrative regions, including Atlantic. The ONRR filter returns no Atlantic row in this snapshot. That is an observation about the selected royalty data. The table omits an Atlantic receipt amount because the source contains no matching row. It cannot answer whether BOEM had leases, planning activity or another revenue type in that region.
| FY 2026 source region | Signed royalty receipts | Share of all matched offshore royalties |
|---|---|---|
| Gulf of America | $7,240,578,282.48 | 98.60% |
| Pacific | $100,015,560.11 | 1.36% |
| Alaska | $2,894,611.90 | 0.04% |
| Offshore total | $7,343,488,454.49 | 100.00% |
How do you reproduce the Gulf share?
First read the three FY 2026 region totals, then add them with their signs. The Gulf numerator is $7,240,578,282.48 and the sum is $7,343,488,454.49. Divide the numerator by that sum and multiply by 100. The result describes the Gulf’s share of the selected federal offshore royalty receipts. It has a different denominator from the offshore share of all federal oil and gas royalties, which also includes federal onshore receipts.
Rebuild the calculation from the same release if a published total differs. A figure limited to the Oil commodity, all payment types, or a broader federal denominator can each be valid for a different question. Use the region amounts before display rounding so that smaller rows remain in the total. Report the scope directly next to the percentage in a chart caption.
Did the Gulf reach its highest share in the biggest receipt year?
FY 2008 had the largest total for the three observed offshore regions at $8,257,667,623.30. It also had the lowest Gulf share of the study window at 94.26%. FY 2023 had the highest Gulf share, even though its offshore total was lower. The share can rise when other regions shrink or fail to keep pace, even if the Gulf itself remains below an earlier dollar peak.
The table uses full annual sums to select the peak and the lowest or highest share before presentation rounding. It pairs the fiscal years that answer the two different ranking questions with the latest observed year. A sentence about a record share should identify it as a share of receipts and should avoid implying a record dollar amount.
| Fiscal year and comparison | Gulf royalties | Pacific plus Alaska | Offshore total | Gulf share |
|---|---|---|---|---|
| FY 2008, largest offshore total | $7,783,797,508.45 | $473,870,114.85 | $8,257,667,623.30 | 94.26% |
| FY 2023, highest Gulf share | $6,410,681,565.13 | $41,770,662.54 | $6,452,452,227.67 | 99.35% |
| FY 2026, latest snapshot year | $7,240,578,282.48 | $102,910,172.01 | $7,343,488,454.49 | 98.60% |
Which regions account for the most recent annual change?
From FY 2025 to FY 2026 the offshore total rose by $1,712,101,759.36. The Gulf was the largest dollar contributor. The Pacific increased, while Alaska declined. Subtract the earlier value from the later value for each region, keeping the sign, then sum the differences to get the offshore change. The row for Alaska reduces the aggregate change.
A contribution calculation traces how the change adds up. It does not explain what led to the change. The public rows identify financial amounts by source categories. Isolating production changes, changes in value, timing effects or lease terms would require aligned evidence on those quantities. Small regional bases can also produce large percentage movements that matter less in the dollar bridge.
| Region | FY 2025 nominal receipts | FY 2026 nominal receipts | FY 2026 less FY 2025 |
|---|---|---|---|
| Gulf of America | $5,591,786,642.17 | $7,240,578,282.48 | $1,648,791,640.31 |
| Pacific | $36,536,946.22 | $100,015,560.11 | $63,478,613.89 |
| Alaska | $3,063,106.74 | $2,894,611.90 | −$168,494.84 |
| Offshore total | $5,631,386,695.13 | $7,343,488,454.49 | $1,712,101,759.36 |
What is the Gulf’s share across the whole period?
Sum each region across all 23 years first. The Gulf subtotal is $118,946,246,839.04. The denominator is $122,676,019,508.54 across the three regions. This pooled calculation gives more weight to years in which the national offshore total was large. An average of 23 annual Gulf shares would instead give each fiscal year an equal weight. Use the pooled measure when describing how the recorded receipts were attributed by source region across the full period.
Keep the units nominal in a long-period dollar total. Adding reported dollars across years summarizes what ONRR recorded, even though the purchasing power of the dollars changed over the interval. If the question is which period had the most offshore receipt purchasing power, first choose and document a common price basis.
Can Gulf source receipts answer a GOMESA distribution question?
The Gulf region subtotal measures signed receipts on matching federal offshore oil and gas lease royalty rows. A GOMESA question concerns a revenue-sharing program and amounts disbursed to recipients. The Interior’s FY 2026 disbursement release discusses Gulf revenue sharing inside a disbursement release. That release also reports other destination categories. The source-region amount and the amount allocated to eligible recipients are separate accounting measures.
Start with the DOI fiscal disbursement data coverage for recipient data, then confirm whether the selected table or release isolates the program and beneficiary in question. A press release date can differ from the fiscal period it describes. Multiplying the Gulf receipt subtotal by a headline sharing rate does not identify the eligible pool, the accounting period used by the program or the dollars paid to a particular recipient.
How do you check the regional totals against the federal revenue file?
Read the DOI fiscal revenue coverage and metadata for coverage. Filter Land Class = Federal, Land Category = Offshore, Mineral Lease Type = Oil & Gas and Revenue Type = Royalties. Group by Fiscal Year and Offshore Region. This lease-type definition preserves every source commodity under the selected lease type. A product-level oil or gas comparison must apply its own Commodity and Product filters.
Keep negative values and report the actual number of source rows selected. The Alaska regional sum is negative in FY 2010 and FY 2014 in this file. Dropping negative values changes both the offshore total and the Gulf share. The public regional aggregate does not establish why either Alaska amount was negative. To audit geography, check that all selected rows have an observed region, then confirm that the three signed region subtotals reconcile to the ungrouped offshore filter.
How concentrated are offshore receipts after excluding the Gulf?
The two remaining source regions are the Pacific and Alaska. Across FY 2004 through FY 2026, the Pacific contributed $3,551,458,182.32 and Alaska contributed $178,314,487.18. To compare the two regions, add those amounts and divide each region by the resulting signed total. The Gulf stays outside both the numerator and denominator. The resulting Pacific share is 95.22%, which describes the composition of the observed receipts outside the Gulf.
If a reader is looking for the Pacific share of all federal offshore oil and gas lease royalties, the Gulf must stay in the denominator. The two percentages use the same Pacific numerator, but they answer different questions. A chart caption should give the denominator in full so a large Pacific share outside the Gulf cannot be mistaken for a large share of all offshore receipts.
The Pacific plus Alaska scope is determined by the matching rows in the fiscal extract. It does not assign an amount to an administrative region that had no matching record, and it does not add royalties associated with state waters.
Can receipts outside the Gulf rise while their share of the total falls?
Yes. From the first to the second of the two latest five-year windows, the signed Pacific-plus-Alaska subtotal increased by $68,072,363.98. Over the same comparison, the full offshore denominator increased by $12,639,261,528.97. The denominator grew faster than the subtotal, so the share fell from 1.10% to 0.88%.
The table divides the latest 20 fiscal years into four adjacent five-year blocks. It leaves FY 2004 through FY 2006 outside this particular comparison so every block has the same duration. Within each block, add the Pacific and Alaska receipts and divide by the block’s full offshore total. Adding the dollar amounts first gives a share of dollars rather than an average of five annual percentages.
Use the receipt column to describe the size of the non-Gulf source pool. Use the share column to describe its place in the offshore total. Neither column alone answers both questions.
| Five fiscal years | Pacific receipts | Alaska receipts | Combined outside Gulf | All offshore receipts | Outside-Gulf share |
|---|---|---|---|---|---|
| FY 2007 to 2011 | $1,424,515,383.38 | $30,107,028.25 | $1,454,622,411.63 | $29,227,877,196.99 | 4.98% |
| FY 2012 to 2016 | $1,053,422,215.22 | $7,114,736.90 | $1,060,536,952.12 | $24,857,028,995.30 | 4.27% |
| FY 2017 to 2021 | $194,680,571.57 | $21,000,860.02 | $215,681,431.59 | $19,609,264,954.12 | 1.10% |
| FY 2022 to 2026 | $263,413,724.72 | $20,340,070.85 | $283,753,795.57 | $32,248,526,483.09 | 0.88% |
How can the Pacific share of the non-Gulf total exceed 100%?
In FY 2010 the Pacific recorded $267,765,035.77 and Alaska recorded −$115,656,455.92. Adding the two signed amounts produces a denominator of $152,108,579.85. Because the Alaska amount reduces the combined subtotal, the Pacific amount exceeds that subtotal. FY 2014 presents the same arithmetic with a smaller Alaska offset.
Keep the negative amount when reproducing the signed share. Truncating the result at 100% or discarding the negative region would change the question being answered. A pie chart presumes nonnegative components, so a signed dollar table communicates this composition more clearly. Keep the signed denominator and its scope in any citation that quotes the percentage.
The arithmetic only shows how the published region totals add up. A negative regional amount does not identify a refund, a particular lease or the fiscal period in which the underlying production occurred.
| Fiscal year | Pacific signed receipts | Alaska signed receipts | Pacific plus Alaska | Pacific share of signed subtotal |
|---|---|---|---|---|
| 2010 | $267,765,035.77 | −$115,656,455.92 | $152,108,579.85 | 176.04% |
| 2014 | $276,068,559.66 | −$26,311,832.60 | $249,756,727.06 | 110.53% |
What should a regional trend chart preserve?
The combined Pacific-plus-Alaska subtotal was highest in FY 2008 at $473,870,114.85 and lowest in FY 2017 at $33,818,970.89. Those are annual extremes for the two-region measure. A graph of the full offshore total uses a different scale and can make changes in the smaller region totals hard to read.
A regional trend can display both non-Gulf series in nominal dollars on the same vertical axis. Preserve zero on a signed chart so a negative Alaska year remains visibly below it. A separate share chart can show changes in the place of those two regions within all offshore receipts, but should identify that broader denominator and retain the same fiscal-year labels.
A useful check for the broader share is to subtract the Gulf amount from the full offshore total and compare the result with the sum of Pacific and Alaska. The two methods should reconcile to the cent. A mismatch usually signals different filters, source releases or geographic groupings.
To reconcile a chart with the downloadable file, first match the source region labels, then check whether each point represents an annual observation or a pooled window. The figures describe where the source file attributes federal offshore receipts. Disbursement totals use recipient categories and should be cited on their own basis.
How does this analysis compare with published sources?
This study draws on ONRR / DOI, Bureau of Ocean Energy Management, U.S. Department of the Interior, ONRR / DOI. The comparison below shows which questions each source answers and which calculations AMR adds.
| Publication | What it covers | Where the scope differs | How AMR uses it |
|---|---|---|---|
| ONRR / DOI | Catalog documents offshore federal waters, location fields, lease and revenue types. | The reviewed metadata does not tabulate annual shares by region. | Use ONRR rows for signed totals. |
| Bureau of Ocean Energy Management | Lists Alaska, Atlantic, Gulf and Pacific administrative regions. | The region page does not state a fiscal receipt amount for any region. | Keep Atlantic administrative coverage distinct from ONRR observed rows. |
| U.S. Department of the Interior | FY 2026 release discusses revenue sharing and lists disbursement destinations. | The release does not present this three-region royalty-only receipt series. | Use as the source-versus-recipient distinction. |
| ONRR / DOI | Fiscal disbursement metadata identifies funds and coverage. | The metadata does not establish the regional source receipt denominator. | Link as the separate starting point for disbursement questions. |
What can a source row count tell you?
The count columns let a reader test whether an independent extract selected the same records. An Alaska row count of one means one published combination survived the filter for that region and year. The row count cannot establish the number of leases or operators represented. Check counts alongside dollar totals. Two opposite errors can cancel in the dollars and still leave a mismatch in the selected records.
Sources and data
- ONRR original fiscal-year revenue CSV
- DOI fiscal revenue coverage and metadata
- BOEM’s four administrative offshore regions
- Interior’s FY 2026 disbursement release
- DOI fiscal disbursement data coverage
Download the data (CSV) · Read the data dictionary. The AMR analysis and figures are licensed CC BY 4.0. Refer to the original issuers for their materials.